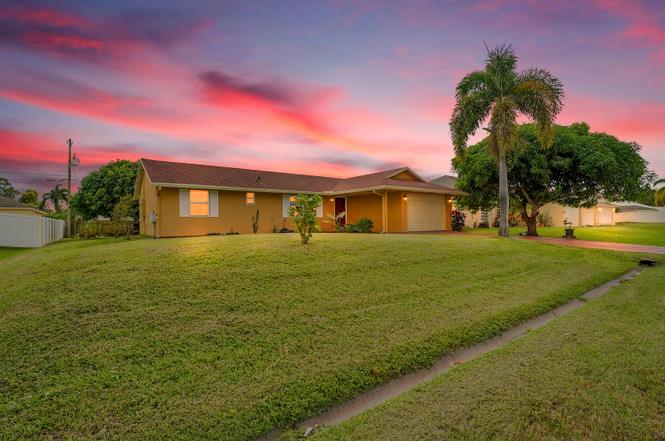
1652 SW Crawford Ave · Port St. Lucie, FL
Flood risk 1/10 · Minimal
- FEMA flood zone
- X (unshaded)
- Chance of flooding over 30 yrs
- 0.0%
- Est. flood insurance / yr
- $507 – $1,088
Fire risk 1/10 · Minimal
- Est. fire insurance / yr
- $947 – $1,759
Heat risk 10/10 · Severe
- Hot days now (above 107°F)
- 7 days/yr
- Hot days in 30 yrs
- 24 days/yr
Wind risk 10/10 · Severe
- Chance of severe wind over 30 yrs
- 99.0%
Air-quality risk 1/10 · Minimal
- Unhealthy air days now
- 0 days/yr
- Unhealthy air days in 30 yrs
- 0 days/yr
Risk factors via First Street. Map © Google.
Why this score? — see what drove the D grade
The composite is a weighted blend of 9 inputs, each scored 0–100. Each bar is that input's sub-score; the figure is the points it added to the 100-point composite (weight × sub-score).
- Cash flow +14.5/30.0
- ARV discount +6.5/15.0
- 1% rule +4.5/10.0
- DSCR +4.4/10.0
- Schools +3.7/10.0
- Rent growth +2.6/5.0
- Livability +2.5/5.0
- Condition / age +2.5/5.0
- Appreciation +0.0/10.0
$299,900
🖨 Deal sheet (PDF) 📄 Offer letter ✓ Due diligence
Listing remarks
Welcome to your new home a beautifully maintained 3 bedroom, 2 bathroom residence with a spacious garage and an oversized back yard that is a gardener's dream! You will love the abundance of fruit trees offering a private oasis right in your own yard. Located off Rosser south of Gatlin this home sits in one of the most desirable areas in Port St Lucie, Just minutes from Tradition, shopping, dining, parks, and I-95 for easy commuting. Step inside and you will find a bright open floorplan that's completely move-in ready perfect for anyone looking for a low maintenance Florida lifestyle. Homes like this don't come around often and they don't last long. Schedule your private showing today befor
Key facts
- Move-in ready
- Oversized back yard
- 0.23 acre lot
Tags
Property features AI
Finance
- Other: Pets allowed with no restrictions
Exterior
- Parking: Attached 2-car garage (covered)
- Utilities: Public water; Septic tank sewer; Three-phase electric; Cable available
- Home design: Single-family residence; One story; Resale condition; Faces northeast; West of US-1 frontage
- Construction: Frame and stucco construction
- Exterior features: Entry-level living area; Not waterfront
Interior
- Kitchen: Dishwasher; Electric range; Microwave; Refrigerator
- Bedrooms: 3 bedrooms on the main level
- Flooring: Laminate flooring
- Bathrooms: 2 full bathrooms on the main level
- Heating & cooling: Central electric heating; Central electric air conditioning
- Interior features: Walk-in closets
- Laundry & utility: Electric water heater
Neighborhood map
What this means for you Summary
Snapshot
- This is a 3-bed/2.0-bath single-family listed at $300k.
Deal economics
- At list price, monthly cash flow is $65 ($779/yr) — positive.
- The deal already cash-flows at list — no discount required.
- To meet the 1% rule (rent ≥ 1% of price), the offer needs to be $286k (4.7% below list).
- Recommended offer: $264k (12.0% below list) — sets the bar for market timing.
- Cap rate 6.6% vs local median 3.9% in Port St. Lucie — top-decile yield for the area; either an underpriced asset or a hidden risk that comps aren't pricing in. Stress-test before assuming the spread holds.
Location & tenants
- Location reads: area grade D — affects rentability + tenant quality, not the cash-flow math above.
- St. Lucie (urban): math 40% / reading 48% proficiency, ranked #51 of 73 in FL (top 70%) — families likely to look elsewhere, expect single-tenant / working-renter base with shorter leases.
- Zoned schools: Manatee Academy K-8 (math 53% / reading 51%, grade C-, #990 of 2,144 statewide, top 48%, 1,664 students, 65% FRL); Southern Oaks Middle School (math 39% / reading 43%, grade F, #353 of 571 statewide, top 63%, 894 students, 76% FRL); Fort Pierce Central High School (math 15% / reading 45%, grade F, #441 of 667 statewide, top 67%, 3,091 students, 62% FRL).
- Market conditions: Rents flat; 768 active listings in the ZIP; 6 comparable units currently listed for rent nearby; rentals at typical pace (median 16d on market — plan ~3-4 weeks tenant-placement turnaround); solid renter incomes; 4,868 units permitted in St. Lucie County in 2024 (268 in 5+ unit buildings).
- This rent runs 40% of the median local income ($86k/yr) — at the standard rent-burdened threshold; future hikes will face affordability resistance.
Forward outlook
- Local home prices are declining (-3.0%/yr); year-one equity from $2k of loan paydown is wiped out by about $9k of value loss. Plan a longer hold.
- St. Lucie County population projected at +20% by 2050 — long-run rental-demand tailwind backs the buy-and-hold thesis.
Negotiation context
- It's been on market 237 days — a 12% lower offer ($264k) is reasonable based on typical stale-listing flexibility.
- 2 sale attempts with the ask held roughly flat each time — persistent listings suggest the price (not the market) is what's stuck; bring a comps-based counter.
- Current owner paid $214k; 40% above their basis — modest negotiation headroom, anchor on the comps not their cost.
Risks & watch-outs
- Climate carrying-cost: severe wind risk, 99% chance of damaging wind over 30y; extreme-heat days projected 7→24/yr by 2055 (HVAC capex compounding) — expect insurance premiums to compound above CPI over the hold.
Questions for the listing agent
- It's been on market 237 days. Have you received any prior offers? Is the seller open to a 12% concession, seller financing, or rate buy-down credit?
- Why hasn't it sold? Are there any deal-killer items the seller is aware of (foundation, flood, title, zoning, code violations)?
- Is there a deadline driving the sale (1031 exchange, divorce, estate, relocation)? That informs how much negotiation room exists.
- The area grade is low — what's the realistic commute time and amenity access for the typical tenant pool here? Any planned neighborhood developments (good or bad) we should know about?
- What's the average days-on-market for RENTAL listings here right now (not sales)? A rising rental-DOM trend means longer vacancies and softer asking-rent achievability than the comps imply.
- What's the recent tenant-quality profile in this submarket — average credit score on applications, eviction rate, late-payment / NSF rate, and stable-employment percentage? A property-management company in the area should have these aggregated.
- How much new for-sale + rental construction is in the pipeline within 1–3 miles? Heavy new supply typically softens prices + rents 12–24 months out; constrained supply supports both.
Investment metrics
- 1% rule
- 0.95% ✗
- Cap rate
- 6.55%
- Cash-on-cash
- 0.93%
- DSCR
- 1.04
- GRM
- 8.7
CMA / ARV
- ARV (on-the-fly)
- $293,150
- Comps found
- 4
Show comp detail 4 sales within ~0.75 mi
| Address | Dist | Beds/Ba | Sqft | Sold | Price | $/sf | Match |
|---|---|---|---|---|---|---|---|
| 3185 SW Crumpacker St | 0.37mi | 3/2.0 | 1,152 (+12%) | 20mo | $250,000 | $217 | 46 |
| 1725 SW Capehart Ave | 0.38mi | 2/2.0 (-1) | 912 (-11%) | 22mo | $288,000 | $316 | 40 |
| 2897 SW Ortega St | 0.73mi | 2/2.0 (-1) | 1,112 (+8%) | 11mo | $260,000 | $234 | 38 |
| 1573 SW Wepaco Ave | 0.73mi | 3/2.0 | 1,120 (+9%) | 23mo | $320,000 | $286 | 31 |
Match score weights: distance 35% · size 25% · config 20% · recency 20%. Top-matched comps best support the ARV.
Projected returns pro-forma
-3.0% appreciation · 0.22% rent growth · sell at horizon
- IRR
- -18.1%
- Equity multiple
- 0.38×
- Total profit
- $-52,122
- Equity at exit
- $44,716
- IRR
- -17.5%
- Equity multiple
- 0.17×
- Total profit
- $-69,781
- Equity at exit
- $25,930
Cash invested: $83,972 (down + closing). Projections, not guarantees.
Landlord ↔ Tenant lean methodology
- Overall (STATE)
- 87 Strongly Landlord-Friendly
- State Florida
- 87 Strongly Landlord-Friendly · R+3
- County
- — inherits STATE
- City
- — inherits STATE
ZIP-level market 34953
- Home prices YoY
- -10.1%
- Rents YoY
- 0.2%
- Active inventory
- 768
- Price-to-rent
- 8.7×
Monthly cashflow live
- Estimated rent
- $2,859 high interval (Pro) →
- Mortgage (P&I)
- −$1,573
- Tax from tax record
- −$496 /mo · $5,948/yr
- Insurance
- −$125
- HOA
- −$0
- Vacancy / Maint / Mgmt
- −$600
- Net cashflow
- $65
Break-even live
Sensitivity live
| Price | -10% $235 | -5% $150 | +0% $65 | +5% $-20 | +10% $-105 |
|---|---|---|---|---|---|
| Rent | -10% $-161 | -5% $-48 | +0% $65 | +5% $178 | +10% $291 |
| Rate | -1.0pp $216 | -0.5pp $141 | base $65 | +0.5pp $-13 | +1.0pp $-92 |
UW: 25.0% down · 7.5% · 30yr · 1.5% tax · 5.0% vac · 8.0% maint · 8.0% mgmt
Financing live
Cash to close
- Down payment
- $74,975
- Closing costs
- $8,997
- Reserves months
- —
- Total cash needed
- —
Loan-product check · same deal, 3 products live
Conventional
25% down · 7.5% · 30yr
- Down + closing
- —
- Monthly P&I
- —
- Monthly cashflow
- —
- DSCR
- —
- Eligible?
- —
Personal DTI + credit; lowest rate.
DSCR
20% down · 8.5% · 30yr
- Down + closing
- —
- Monthly P&I
- —
- Monthly cashflow
- —
- DSCR
- —
- Eligible?
- —
No personal income docs; deal must DSCR.
Hard money
10% down · 12.0% · 12mo
- Down + closing
- —
- Monthly P&I
- —
- Monthly cashflow
- —
- DSCR
- —
- Eligible?
- —
Short-term bridge; refi at stabilization.
Rent comps 6 comps
| Address | Beds | Baths | Sqft | Rent | $/sqft | DOM | Units | Dist |
|---|---|---|---|---|---|---|---|---|
| 3201 SW Collings Dr Port Saint Lucie, FL | 3.0 | 2.0 | 1389 | $2,616 | $1.88 | 16d | 1 | 0.38mi |
| 1900 SW Aledo Ln Port Saint Lucie, FL | 1.0–3.0 | 1.0–2.0 | 1060 | $2,666 | $2.52 | 16d | 16 | 0.76mi |
| 3150 SW Centamino St Port Saint Lucie, FL | 3.0 | 2.0 | 1284 | $2,200 | $1.71 | 16d | 1 | 0.99mi |
| 1021 SW Dubois Ave Port Saint Lucie, FL | 3.0 | 2.0 | 1331 | $2,400 | $1.80 | 25d | 1 | 1.04mi |
| 2542 SW Kensington St Port Saint Lucie, FL | 3.0 | 2.0 | 1470 | $3,200 | $2.18 | 16d | 1 | 1.28mi |
| 1025 SW Majorca Ave Port Saint Lucie, FL | 3.0 | 2.0 | 1480 | $3,300 | $2.23 | 25d | 1 | 1.29mi |
Listing history 24 events
-
2026-06-21days on market $299,900 Active 237 DOM
-
2026-06-18days on market $299,900 Active 234 DOM
-
2026-06-17pricedays on market $299,900 Active 233 DOM
-
2026-06-16days on market $309,900 Active 232 DOM
-
2026-06-15days on market $309,900 Active 231 DOM
-
2026-06-14days on market $309,900 Active 229 DOM
-
2026-06-13statusdays on market $309,900 Active 228 DOM
-
2026-06-10statusdays on market $309,900 Active Under Contract 226 DOM
-
2026-06-09days on market $309,900 Active 225 DOM
-
2026-06-08days on market $309,900 Active 224 DOM
-
2026-06-07days on market $309,900 Active 223 DOM
-
2026-06-05days on market $309,900 Active 220 DOM
-
2026-06-03days on market $309,900 Active 219 DOM
-
2026-06-02days on market $309,900 Active 218 DOM
-
2026-06-01days on market $309,900 Active 217 DOM
-
2026-05-31days on market $309,900 Active 216 DOM
-
2026-05-30days on market $309,900 Active 215 DOM
-
2026-04-17price $309,900
-
2026-02-11status Active
-
2026-01-24historical Active Under Contract
-
2026-01-12price $314,500
-
2025-10-27$315,000 Active
-
2025-10-03soldstatus $214,000
-
1992-04-10soldstatus $7,000
ⓘ Source: listings_history table (triggers on properties + properties_extension) + one-shot
backfill from property_details.listing_events for pre-trigger history.
Tax reassessment forecast FL · Resets to sale price
- Current annual tax
- $5,948 · $496/mo
- Projected year-2 tax
- $5,948 · $496/mo
- Expected delta
- $0/yr ($0/mo · 0.0%)
ⓘ Screening estimate from a state-policy table — verify with the county assessor before closing.
Climate risk First Street
- Flood 1/10 Low FEMA zone X (unshaded) · 0% chance over 30 yrs
- Wildfire 1/10 Low
- Heat 10/10 Extreme 7 d/yr ≥107°F today · 24 d/yr by 30 yrs out
- Wind 10/10 Extreme 99% chance of damaging wind over 30 yrs
- Air quality 1/10 Low 0 unhealthy d/yr today · 0 by 30 yrs out
Nearby sold comps map
Loading sold comps map…
Walkable amenities ~0.75 mi
Loading nearby amenities…
Taxation est. · year 1
- Rental income
- $34,303
- − Mortgage interest
- −$16,799
- − Property taxes
- −$5,948
- − Insurance
- −$1,500
- − Repairs & maintenance
- −$2,744
- − Management
- −$2,744
- − Depreciation
- −$8,724
- Taxable loss
- −$4,156
- Est. tax savings @ 24.0%
- +$998
- After-tax cash flow
- $1,777/yr
For passive investors: Depreciation is non-cash, so a rental often shows a tax loss while cash-flowing — sheltering income. Rental losses are passive: they offset passive income freely, and up to $25,000/yr can offset ordinary (W-2) income if you actively participate and your MAGI is under $100k (phasing out to $0 by $150k); unused losses carry forward. On sale, claimed depreciation is recaptured at up to 25%, and gains may owe capital-gains tax (a 1031 exchange can defer both). Figures are a year-1 estimate at your 24.0% rate — not tax advice; consult a CPA.
Schools (NCES district)
- District
- St. Lucie
- NCES district ID
- 1201770
- Math proficiency
- 40% ▼ -11.00%
- Reading proficiency
- 48% ▼ -4.00%
- Median HH income
- $44,737
- Composite
- 37.28/100
- National rank
- #4449
- State rank
- #51 of 73 in FL
Livability — Port St. Lucie
No livability data for this city. (Only ~50 U.S. cities are tracked.)
Census & demographics
- Census place
- Port St. Lucie, FL
- County
- Saint Lucie County · 337,150 people
- City population
- 221,051
- Metro
- Port St. Lucie, FL
- Population (ZIP)
- 86,875
- Household income
- $85,667
- Rent vs Own
- Severe rent burden
- 857.0
Population outlook (St. Lucie County) Hauer SSP2
- Today (2025)
- 338,016 people
- By 2030
- 355,687 · +5.2%
- By 2040
- 385,521 · +14.1%
- By 2050
- 406,106 · +20.1%
- By 2075
- 441,054 · +30.5%
- By 2100
- 436,885 · +29.2%
Race, ethnicity, and origin ACS 2023
- Neighborhood character
- Diverse neighborhood (Simpson 0.69)
- Race & ethnicity
- White 42% Hispanic / Latino 28% Black 23% Two or more races 15% Asian 2%
- Hispanic origin (detail)
- Mexican 2% Puerto Rican 8% Cuban 4% Dominican 3%
- Common ancestry
- Hispanic 4% Romanian 2% Estonian 2%
- Foreign-born
- 24% · Canada, Jamaica, China
- Languages at home
- 69% English-only · Spanish 19% French/Haitian/Cajun 6% Other Indo-European 3%
Political lean MEDSL · St. Lucie
- 2024 margin
- Lean R (+9.1) · D 45.1% · R 54.2%
- 2008→2024 swing
- -21.2pp toward R · 2008: 12.1pp · 2024: -9.1pp
- All cycles
- 2024: R+9.1 2020: R+1.6 2016: R+2.5 2012: D+7.9 2008: D+12.1
Not yet ingested
- Civics
- —
Market trends
- HPI YoY
- ▼ -44.19%
- Current HPI
- 392.7681
- Rent YoY
- ▲ 0.22%
- Metro
- Port St. Lucie, FL
- State GDP YoY
- ▲ 3.28%
- F500 in state
- 36
Industry mix (Fortune 500 HQ in FL)
| Industry | F500 HQs | Revenue |
|---|---|---|
| Industrial Technology | 2 | $29B |
|
||
| Insurance | 2 | $17B |
|
||
| Retail | 1 | $60B |
|
||
| Technology Distribution | 1 | $58B |
|
||
| Homebuilding | 1 | $35B |
|
||
| Technology Manufacturing | 1 | $35B |
|
||
Price history
+4327.1% since first listed7 events — show timeline
- 2026-04-17 Price Changed $309,900 Beaches MLS
- 2026-02-11 Relisted — Beaches MLS
- 2026-01-24 Contingent — Beaches MLS
- 2026-01-12 Price Changed $314,500 Beaches MLS
- 2025-10-27 Listed $315,000 Beaches MLS
- 2025-10-03 Sold (Public Records) $214,000 Public Records
- 1992-04-10 Sold (Public Records) $7,000 Public Records
Property tax history
+19.1%/yrLatest (2025): $5,948 · +393.0% YoY. Source: county tax records.
Cash-flow waterfall
monthlySold comps — $/sqft
last 12 mo · ≤1 miLoading sold comps…