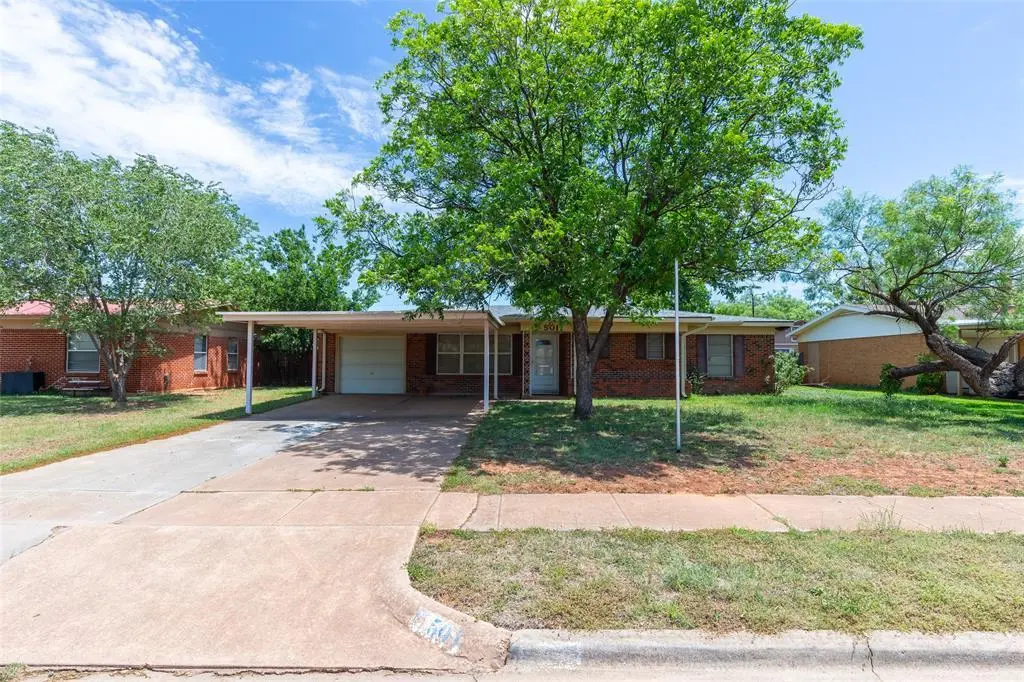
501 S La Salle Dr · Abilene, TX
Flood risk 5/10 · Moderate
- FEMA flood zone
- X (unshaded)
- Chance of flooding over 30 yrs
- 0.59%
- Est. flood insurance / yr
- $507 – $1,088
Fire risk 3/10 · Minor
- Est. fire insurance / yr
- $1,222 – $2,270
Heat risk 7/10 · Major
- Hot days now (above 104°F)
- 7 days/yr
- Hot days in 30 yrs
- 24 days/yr
Wind risk 4/10 · Minor
- Chance of severe wind over 30 yrs
- 11.0%
Air-quality risk 1/10 · Minimal
- Unhealthy air days now
- 0 days/yr
- Unhealthy air days in 30 yrs
- 0 days/yr
Risk factors via First Street. Map © Google.
Why this score? — see what drove the B grade
The composite is a weighted blend of 9 inputs, each scored 0–100. Each bar is that input's sub-score; the figure is the points it added to the 100-point composite (weight × sub-score).
- Cash flow +28.8/30.0
- ARV discount +13.4/15.0
- DSCR +10.0/10.0
- 1% rule +8.0/10.0
- Rent growth +5.0/5.0
- Livability +3.8/5.0
- Schools +2.8/10.0
- Condition / age +2.5/5.0
- Appreciation +0.0/10.0
$167,500
🖨 Deal sheet (PDF) 📄 Offer letter ✓ Due diligence
Listing remarks
Welcome to 501 S La Salle, a 3 bedroom, 2 bathroom home full of potential and opportunity. Whether you’re looking for your first home or your next investment property, this one is priced and positioned to move quickly. Inside, you’ll find a functional layout with plenty of space to make your own, while outside offers a detached shed that would make a great workshop, craft space, storage area, or hobby room. This property offers a great chance to add value and make it your own over time. Don’t miss your chance to get into a home with so much potential at an affordable price point!
Key facts
- Hobby room
- Great workshop
- Functional layout
Tags
Property features AI
Finance
- Financial info: Accepts Cash, Conventional, FHA, and VA financing; No second mortgage reported
- HOA & community: No homeowners association
Exterior
- Parking: Detached and attached garage with one garage space; Garage is 13' wide by 21' long; Carport with 2 spaces; Additional covered parking and driveway; Off-street and on-street parking available; Garage faces front with a 2-car single door
- Utilities: City water; City sewer; Electricity connected; Individual gas meter; Individual water meter; Natural gas available; Curbs in place; Property in a municipal utility district
- Home design: Single-family residence; One story; Preowned (built in 1954)
- Construction: Brick construction; Asphalt roof; Slab foundation; Year built 1954
- Exterior features: Covered and enclosed front and rear porches; Covered porch(es); Chain link and wood fencing; Lot under 0.5 acre
Interior
- Kitchen: Dishwasher; Electric cooktop; Electric oven; Electric range
- Bedrooms: Three bedrooms (all on the main level); Primary bedroom with ensuite bathroom
- Flooring: Carpet; Linoleum; Tile
- Bathrooms: Two full bathrooms
- Heating & cooling: Central heating (natural gas); Central electric air conditioning
- Interior features: Natural woodwork and paneling; Window coverings; Six total rooms with separate living and dining areas; One living area; One dining area; Single-level (one story)
- Laundry & utility: Full-size washer/dryer area; Washer hookup; Electric dryer hookup
Neighborhood map
What this means for you Summary
Snapshot
- This is a 3-bed/1.5-bath single-family listed at $168k.
Deal economics
- At list price, monthly cash flow is $562 ($7k/yr) — positive.
- The deal already cash-flows at list — no discount required.
- Meets the 1% rule at list price ($2k rent vs $168k).
- Recommended offer: $165k (1.5% below list) — sets the bar for market timing.
- Cap rate 10.3% vs local median 6.8% in Abilene — top-decile yield for the area; either an underpriced asset or a hidden risk that comps aren't pricing in. Stress-test before assuming the spread holds.
Location & tenants
- Location reads 75/100 on livability (#142 in TX, #4,037 nationally) — a middle-class / working-renter tenant base. Strengths: cost of living A+, housing A+, health & safety A+; Watch: crime D, commute F.
- Abilene ISD (urban): math 32% / reading 34% proficiency, ranked #575 of 826 in TX (top 70%) — families likely to look elsewhere, expect single-tenant / working-renter base with shorter leases.
- Zoned schools: Bonham El (math 29% / reading 28%, grade F, #2,706 of 4,322 statewide, top 63%, 482 students, 79% FRL) — zoned schools average 79% FRL vs 57% district-wide (21 pts higher); higher-poverty schools than district average — tighter screening recommended.
- Market conditions: Rents rising fast (+32.1%/yr); 109 active listings in the ZIP; 8 comparable units currently listed for rent nearby; rentals at typical pace (median 14d on market — plan ~3-4 weeks tenant-placement turnaround); 508 units permitted in Taylor County in 2024 (0 in 5+ unit buildings).
- This rent runs 41% of the median local income ($63k/yr) — at the standard rent-burdened threshold; future hikes will face affordability resistance.
Forward outlook
- Local home prices are declining (-3.0%/yr); year-one equity from $1k of loan paydown is wiped out by about $5k of value loss. Plan a longer hold.
- Taylor County population projected at +16% by 2050 — long-run rental-demand tailwind backs the buy-and-hold thesis.
- At projected returns (-3.0% appreciation + 8.0% rent growth), your $47k cash investment doubles in ~6 years — after that, you're playing with house money.
Negotiation context
- It's been on market 17 days — a 2% lower offer ($165k) is reasonable based on typical stale-listing flexibility.
Risks & watch-outs
- Watch-outs: built in 1954 — expect roof / HVAC / electrical / plumbing capex.
- Climate carrying-cost: moderate flood risk; extreme-heat days projected 7→24/yr by 2055 (HVAC capex compounding) — expect insurance premiums to compound above CPI over the hold.
Questions for the listing agent
- Built in 1954 — when were the roof, HVAC, electrical panel, plumbing, and water heater last replaced?
- Is there a deadline driving the sale (1031 exchange, divorce, estate, relocation)? That informs how much negotiation room exists.
- Schools are D-rated, which usually means shorter tenancies and higher turnover. Who's the typical renter profile here, and what's been the actual vacancy rate?
- Crime grade is D in this area — have there been break-ins, vandalism, or insurance claims at this property in the last 3 years? What carrier currently insures it and at what premium?
- What's the average days-on-market for RENTAL listings here right now (not sales)? A rising rental-DOM trend means longer vacancies and softer asking-rent achievability than the comps imply.
- What's the recent tenant-quality profile in this submarket — average credit score on applications, eviction rate, late-payment / NSF rate, and stable-employment percentage? A property-management company in the area should have these aggregated.
- How much new for-sale + rental construction is in the pipeline within 1–3 miles? Heavy new supply typically softens prices + rents 12–24 months out; constrained supply supports both.
Investment metrics
- 1% rule
- 1.30% ✓
- Cap rate
- 10.32%
- Cash-on-cash
- 14.38%
- DSCR
- 1.64
- GRM
- 6.4
CMA / ARV
- ARV (on-the-fly)
- $192,705
- Comps found
- 12
Show comp detail 12 sales within ~0.75 mi
| Address | Dist | Beds/Ba | Sqft | Sold | Price | $/sf | Match |
|---|---|---|---|---|---|---|---|
| 4225 S 6th St | 0.26mi | 3/2.0 | 1,322 (-0%) | 1mo | $169,900 | $129 | 84 |
| 826 S La Salle Dr | 0.30mi | 3/1.0 | 1,309 (-2%) | 1mo | $152,500 | $117 | 81 |
| 918 Buccaneer Dr | 0.39mi | 3/2.0 | 1,332 (+0%) | 1mo | $210,000 | $158 | 78 |
| 918 S San Jose Dr | 0.36mi | 3/1.5 | 1,400 (+5%) | 2mo | $212,000 | $151 | 72 |
| 5208 Aztec Dr | 0.54mi | 3/2.0 | 1,300 (-2%) | 0mo | $189,000 | $145 | 69 |
| 5131 Durango Dr | 0.40mi | 3/1.0 | 1,176 (-12%) | 2mo | $165,000 | $140 | 58 |
| 1141 S La Salle | 0.52mi | 4/1.0 (+1) | 1,427 (+7%) | 2mo | $190,000 | $133 | 54 |
| 1058 Westridge Dr | 0.55mi | 3/2.0 | 1,468 (+10%) | 4mo | $210,000 | $143 | 52 |
| 709 Hawthorne St | 0.41mi | 2/1.0 (-1) | 1,154 (-13%) | 3mo | $199,900 | $173 | 49 |
| 5273 Pueblo Dr | 0.57mi | 3/2.0 | 1,140 (-14%) | 3mo | $170,000 | $149 | 45 |
| 1233 S Jefferson | 0.59mi | 2/1.0 (-1) | 1,179 (-11%) | 2mo | $185,000 | $157 | 45 |
| 1266 Buccaneer Dr | 0.66mi | 3/1.0 | 1,502 (+13%) | 3mo | $130,000 | $87 | 43 |
Match score weights: distance 35% · size 25% · config 20% · recency 20%. Top-matched comps best support the ARV.
Projected returns pro-forma
-3.0% appreciation · 8.0% rent growth · sell at horizon
- IRR
- 10.3%
- Equity multiple
- 1.43×
- Total profit
- $20,183
- Equity at exit
- $24,975
- IRR
- 23.2%
- Equity multiple
- 3.48×
- Total profit
- $116,128
- Equity at exit
- $14,482
Cash invested: $46,900 (down + closing). Projections, not guarantees.
Landlord ↔ Tenant lean methodology
- Overall (STATE)
- 87 Strongly Landlord-Friendly
- State Texas
- 87 Strongly Landlord-Friendly · R+5
- County
- — inherits STATE
- City
- — inherits STATE
ZIP-level market 79605
- Rents YoY
- 32.1%
- Active inventory
- 109
- Price-to-rent
- 6.4×
Monthly cashflow live
- Estimated rent
- $2,176 high interval (Pro) →
- Mortgage (P&I)
- −$878
- Tax from tax record
- −$208 /mo · $2,501/yr
- Insurance
- −$70
- HOA
- −$0
- Vacancy / Maint / Mgmt
- −$457
- Net cashflow
- $562
Break-even live
Sensitivity live
| Price | -10% $657 | -5% $609 | +0% $562 | +5% $515 | +10% $467 |
|---|---|---|---|---|---|
| Rent | -10% $390 | -5% $476 | +0% $562 | +5% $648 | +10% $734 |
| Rate | -1.0pp $646 | -0.5pp $605 | base $562 | +0.5pp $519 | +1.0pp $474 |
UW: 25.0% down · 7.5% · 30yr · 1.5% tax · 5.0% vac · 8.0% maint · 8.0% mgmt
Financing live
Cash to close
- Down payment
- $41,875
- Closing costs
- $5,025
- Reserves months
- —
- Total cash needed
- —
Loan-product check · same deal, 3 products live
Conventional
25% down · 7.5% · 30yr
- Down + closing
- —
- Monthly P&I
- —
- Monthly cashflow
- —
- DSCR
- —
- Eligible?
- —
Personal DTI + credit; lowest rate.
DSCR
20% down · 8.5% · 30yr
- Down + closing
- —
- Monthly P&I
- —
- Monthly cashflow
- —
- DSCR
- —
- Eligible?
- —
No personal income docs; deal must DSCR.
Hard money
10% down · 12.0% · 12mo
- Down + closing
- —
- Monthly P&I
- —
- Monthly cashflow
- —
- DSCR
- —
- Eligible?
- —
Short-term bridge; refi at stabilization.
Rent comps 8 comps
| Address | Beds | Baths | Sqft | Rent | $/sqft | DOM | Units | Dist |
|---|---|---|---|---|---|---|---|---|
| 841 S San Jose Dr Abilene, TX | 2.0 | 1.0 | 1122 | $3,000 | $2.67 | 22d | 1 | 0.34mi |
| 5348 Benbrook St Abilene, TX | 3.0 | 2.0 | 1164 | $2,100 | $1.80 | 45d | 1 | 0.90mi |
| 234 Clyde St Abilene, TX | 3.0 | 1.0 | 998 | $1,995 | $2.00 | 14d | 1 | 0.95mi |
| 728 Redbird Ln Abilene, TX | 2.0 | 1.5 | 994 | $1,695 | $1.71 | 14d | 1 | 1.18mi |
| 5441 N 10th St Abilene, TX | 3.0 | 2.0 | 1270 | $2,500 | $1.97 | 14d | 1 | 1.25mi |
| 5850 Hartford St Lot 123 Abilene, TX | 3.0 | 2.0 | 1280 | $1,495 | $1.17 | 14d | 1 | 1.31mi |
| 3250 College St Abilene, TX | 2.0 | 1.0 | 1148 | $1,595 | $1.39 | 22d | 1 | 1.42mi |
| 2850 S 5th St Abilene, TX | 4.0 | 2.0 | 1175 | $1,995 | $1.70 | 14d | 1 | 1.44mi |
Listing history 8 events
-
2026-06-07statusdays on market $167,500 Pending 17 DOM
-
2026-06-03days on market $167,500 Active Option Contract 16 DOM
-
2026-06-02days on market $167,500 Active Option Contract 15 DOM
-
2026-06-01days on market $167,500 Active Option Contract 14 DOM
-
2026-05-31days on market $167,500 Active Option Contract 13 DOM
-
2026-05-30days on market $167,500 Active Option Contract 12 DOM
-
2026-05-19$167,500 Active
-
1996-01-08soldstatus
ⓘ Source: listings_history table (triggers on properties + properties_extension) + one-shot
backfill from property_details.listing_events for pre-trigger history.
Tax reassessment forecast TX · Resets to sale price
- Current annual tax
- $2,501 · $208/mo
- Projected year-2 tax
- $3,065 · $255/mo
- Expected delta
- +$564/yr (+$47/mo · 22.5%)
ⓘ Screening estimate from a state-policy table — verify with the county assessor before closing.
Climate risk First Street
- Flood 5/10 Major FEMA zone X (unshaded) · 59% chance over 30 yrs
- Wildfire 3/10 Moderate
- Heat 7/10 Severe 7 d/yr ≥104°F today · 24 d/yr by 30 yrs out
- Wind 4/10 Moderate 11% chance of damaging wind over 30 yrs
- Air quality 1/10 Low 0 unhealthy d/yr today · 0 by 30 yrs out
Nearby sold comps map
Loading sold comps map…
Walkable amenities ~0.75 mi
Loading nearby amenities…
Taxation est. · year 1
- Rental income
- $26,106
- − Mortgage interest
- −$9,383
- − Property taxes
- −$2,501
- − Insurance
- −$838
- − Repairs & maintenance
- −$2,088
- − Management
- −$2,088
- − Depreciation
- −$4,873
- Taxable income
- $4,335
- Est. tax owed @ 24.0%
- −$1,040
- After-tax cash flow
- $5,704/yr
For passive investors: Depreciation is non-cash, so a rental often shows a tax loss while cash-flowing — sheltering income. Rental losses are passive: they offset passive income freely, and up to $25,000/yr can offset ordinary (W-2) income if you actively participate and your MAGI is under $100k (phasing out to $0 by $150k); unused losses carry forward. On sale, claimed depreciation is recaptured at up to 25%, and gains may owe capital-gains tax (a 1031 exchange can defer both). Figures are a year-1 estimate at your 24.0% rate — not tax advice; consult a CPA.
Schools (NCES district)
- District
- Abilene ISD
- NCES district ID
- 4807440
- Math proficiency
- 32% ▼ -11.00%
- Reading proficiency
- 34% ▼ -5.00%
- Median HH income
- $39,782
- Composite
- 27.71/100
- National rank
- #6909
- State rank
- #575 of 826 in TX
Livability — Abilene
- Score
- 75/100
- State rank
- #142
- US rank
- #4037
Category grades
Schools grade is shown separately in the Schools card above.
Census & demographics
- Census place
- Abilene, TX
- County
- Taylor County · 136,672 people
- City population
- 136,672
- Metro
- Abilene, TX
- Population (ZIP)
- 28,467
- Household income
- $62,929
- Rent vs Own
- Severe rent burden
- 1096.0
Population outlook (Taylor County) Hauer SSP2
- Today (2025)
- 145,270 people
- By 2030
- 150,050 · +3.3%
- By 2040
- 159,417 · +9.7%
- By 2050
- 168,883 · +16.3%
- By 2075
- 194,436 · +33.8%
- By 2100
- 203,163 · +39.9%
Race, ethnicity, and origin ACS 2023
- Neighborhood character
- Majority White (63%)
- Race & ethnicity
- White 63% Hispanic / Latino 22% Two or more races 12% Black 8% Asian 2%
- Hispanic origin (detail)
- Mexican 19%
- Common ancestry
- Slovak 2% Lithuanian 1% Serbian 1%
- Foreign-born
- 6% · Canada
- Languages at home
- 84% English-only · Spanish 14% German/W. Germanic 1% Other Asian/Pacific 0%
Political lean MEDSL · Taylor
- 2024 margin
- Solid R (+49.8) · D 24.6% · R 74.4% · Other 1.0%
- 2008→2024 swing
- -4.2pp toward R · 2008: -45.6pp · 2024: -49.8pp
- All cycles
- 2024: R+49.8 2020: R+45.3 2016: R+51.1 2012: R+53.6 2008: R+45.6
Not yet ingested
- Civics
- —
Market trends
- HPI YoY
- ▼ -181.75%
- Current HPI
- 201.2341
- Rent YoY
- ▲ 32.08%
- Metro
- Abilene, TX
- State GDP YoY
- ▲ 3.95%
- F500 in state
- 110
Industry mix (Fortune 500 HQ in TX)
| Industry | F500 HQs | Revenue |
|---|---|---|
| Energy | 16 | $1,198B |
|
||
| Technology | 5 | $198B |
|
||
| Engineering / Construction | 4 | $72B |
|
||
| Energy Services | 3 | $60B |
|
||
| Utilities | 3 | $41B |
|
||
| Healthcare | 2 | $330B |
|
||
Price history
2 events — show timeline
- 2026-05-19 Listed $167,500 NTREIS
- 1996-01-08 Sold (Public Records) — Public Records
Property tax history
+4.2%/yrLatest (2025): $2,501 · +8.3% YoY. Source: county tax records.
Cash-flow waterfall
monthlySold comps — $/sqft
last 12 mo · ≤1 miLoading sold comps…