1106 S 11th St · Frederick, OK
Flood risk 4/10 · Minor
- FEMA flood zone
- —
- Chance of flooding over 30 yrs
- 0.22%
- Est. flood insurance / yr
- —
Fire risk 3/10 · Minor
- Est. fire insurance / yr
- $2,463 – $4,575
Heat risk 7/10 · Major
- Hot days now (above 109°F)
- 7 days/yr
- Hot days in 30 yrs
- 18 days/yr
Wind risk 3/10 · Minor
- Chance of severe wind over 30 yrs
- 6.0%
Air-quality risk 1/10 · Minimal
- Unhealthy air days now
- 0 days/yr
- Unhealthy air days in 30 yrs
- 0 days/yr
Risk factors via First Street. Map © Google.
Why this score? — see what drove the B grade
The composite is a weighted blend of 9 inputs, each scored 0–100. Each bar is that input's sub-score; the figure is the points it added to the 100-point composite (weight × sub-score).
- Cash flow +30.0/30.0
- 1% rule +10.0/10.0
- DSCR +10.0/10.0
- ARV discount +7.5/15.0
- Appreciation +3.3/10.0
- Livability +3.1/5.0
- Schools +2.9/10.0
- Rent growth +2.5/5.0
- Condition / age +2.5/5.0
$53,000
🖨 Deal sheet 📄 Offer letter ✓ Due diligence
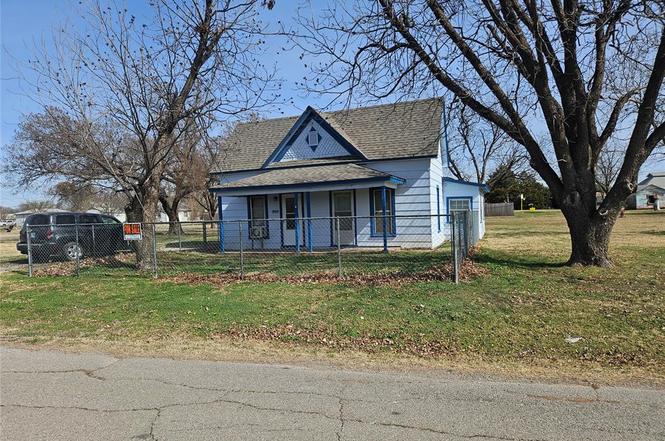
Listing remarks
This quaint, little house sits on a 3500 square foot corner lot, with multiple pecan trees around your new home. This 944 square foot home has 3 bedrooms and 1 bathroom. The washer, dryer, and hot water heater are in one of the rooms. This home had a roof replacement in 2024, along with replacing most of the electrical wiring. It sits across from a small pasture to help give this large corner lot the idea that you ALMOST do not live in town. The back yard is wide open. While the small, front yard is enclosed with a chain link fence.
Key facts
- Roof replacement
- Multiple pecan trees
- Wide open back yard
Tags
Property features AI
Finance
- Financial info: Not assumable; Loan financing allowed
- HOA & community: No mandatory association dues
Exterior
- Home design: Single family residence; One level; Property faces west; Existing property
- Construction: Frame construction; Composition roof (replaced/installed 2024); Conventional foundation
- Exterior features: Chain link fencing; Corner lot
Interior
- Bedrooms: 3 bedrooms
- Bathrooms: 1 full bathroom
- Heating & cooling: Floor furnace heating; Window unit(s) for cooling
- Interior features: One living area; One dining area; Gas log fireplace
Neighborhood map
What this means for you Summary
Snapshot
- This is a 3-bed/1.0-bath single-family listed at $53k.
Deal economics
- At list price, monthly cash flow is $470 ($6k/yr) — positive.
- The deal already cash-flows at list — no discount required.
- Meets the 1% rule at list price ($988 rent vs $53k).
- Recommended offer: $48k (9.0% below list) — sets the bar for market timing.
Location & tenants
- Location reads 61/100 on livability (#304 in OK) — a middle-class / working-renter tenant base. Strengths: cost of living A+, housing A+; Watch: crime D, amenities F, commute F.
- Frederick (town): math 41% / reading 28% proficiency, ranked #46 of 270 in OK (top 17%) — families likely to look elsewhere, expect single-tenant / working-renter base with shorter leases; 68% free/reduced lunch — lower-income household profile, screen leases tightly.
- Zoned schools: Frederick Es (math 57% / reading 27%, grade F, #84 of 845 statewide, top 11%, 386 students, 0% FRL); Frederick Hs (math 15% / reading 24%, grade F, #274 of 447 statewide, top 66%, 250 students, 0% FRL) — zoned schools average 0% FRL vs 68% district-wide (68 pts lower); this property's tenant base skews higher-income than the district average.
- Market conditions: 31 active listings in the ZIP.
Forward outlook
- Local home prices are declining (-3.0%/yr); year-one equity from $366 of loan paydown is wiped out by about $2k of value loss. Plan a longer hold.
- Tillman County population projected to shrink 8% by 2050 — rents likely to lag national; underwrite the cash flow, not the appreciation.
- At projected returns (-3.0% appreciation + 3.0% rent growth), your $15k cash investment doubles in ~4 years — after that, you're playing with house money.
Negotiation context
- It's been on market 108 days — a 9% lower offer ($48k) is reasonable based on typical stale-listing flexibility.
- 3 sale attempts since 2y ago; this cycle's ask has dropped $7k (12%) from the opening price — seller is motivated, your offer sets the floor, not the list.
Risks & watch-outs
- Watch-outs: built in 1940 — expect roof / HVAC / electrical / plumbing capex.
- Climate carrying-cost: extreme-heat days projected 7→18/yr by 2055 (HVAC capex compounding) — expect insurance premiums to compound above CPI over the hold.
Questions for the listing agent
- It's been on market 108 days. Have you received any prior offers? Is the seller open to a 9% concession, seller financing, or rate buy-down credit?
- Built in 1940 — when were the roof, HVAC, electrical panel, plumbing, and water heater last replaced?
- Why hasn't it sold? Are there any deal-killer items the seller is aware of (foundation, flood, title, zoning, code violations)?
- Is there a deadline driving the sale (1031 exchange, divorce, estate, relocation)? That informs how much negotiation room exists.
- Schools are D-rated, which usually means shorter tenancies and higher turnover. Who's the typical renter profile here, and what's been the actual vacancy rate?
- Crime grade is D in this area — have there been break-ins, vandalism, or insurance claims at this property in the last 3 years? What carrier currently insures it and at what premium?
- What's the average days-on-market for RENTAL listings here right now (not sales)? A rising rental-DOM trend means longer vacancies and softer asking-rent achievability than the comps imply.
- What's the recent tenant-quality profile in this submarket — average credit score on applications, eviction rate, late-payment / NSF rate, and stable-employment percentage? A property-management company in the area should have these aggregated.
- How much new for-sale + rental construction is in the pipeline within 1–3 miles? Heavy new supply typically softens prices + rents 12–24 months out; constrained supply supports both.
Investment metrics
- 1% rule
- 1.86% ✓
- Cap rate
- 16.94%
- Cash-on-cash
- 38.02%
- DSCR
- 2.69
- GRM
- 4.5
CMA / ARV
No comps found within radius.
Projected returns pro-forma
-3.0% appreciation · 3.0% rent growth · sell at horizon
- IRR
- 34.0%
- Equity multiple
- 2.44×
- Total profit
- $21,336
- Equity at exit
- $7,902
- IRR
- 40.9%
- Equity multiple
- 4.84×
- Total profit
- $57,058
- Equity at exit
- $4,582
Cash invested: $14,840 (down + closing). Projections, not guarantees.
Landlord ↔ Tenant lean methodology
- Overall (STATE)
- 83 Strongly Landlord-Friendly
- State Oklahoma
- 83 Strongly Landlord-Friendly · R+20
- County
- — inherits STATE
- City
- — inherits STATE
ZIP-level market 73542
- Home prices YoY
- -2.0%
- Active inventory
- 31
- Price-to-rent
- 4.5×
Monthly cashflow live
- Estimated rent
- $988 medium interval (Pro) →
- Mortgage (P&I)
- −$278
- Tax from tax record
- −$10 /mo · $124/yr
- Insurance
- −$22
- HOA
- −$0
- Vacancy / Maint / Mgmt
- −$207
- Net cashflow
- $470
Break-even live
UW: 25.0% down · 7.5% · 30yr · 1.5% tax · 5.0% vac · 8.0% maint · 8.0% mgmt
Financing live
Cash to close
- Down payment
- $13,250
- Closing costs
- $1,590
- Reserves months
- —
- Total cash needed
- —
Loan-product check · same deal, 3 products live
Conventional
25% down · 7.5% · 30yr
- Down + closing
- —
- Monthly P&I
- —
- Monthly cashflow
- —
- DSCR
- —
- Eligible?
- —
Personal DTI + credit; lowest rate.
DSCR
20% down · 8.5% · 30yr
- Down + closing
- —
- Monthly P&I
- —
- Monthly cashflow
- —
- DSCR
- —
- Eligible?
- —
No personal income docs; deal must DSCR.
Hard money
10% down · 12.0% · 12mo
- Down + closing
- —
- Monthly P&I
- —
- Monthly cashflow
- —
- DSCR
- —
- Eligible?
- —
Short-term bridge; refi at stabilization.
Listing history 21 events
-
2026-06-18days on market $53,000 Active 108 DOM
-
2026-06-17days on market $53,000 Active 107 DOM
-
2026-06-16days on market $53,000 Active 106 DOM
-
2026-06-15days on market $53,000 Active 105 DOM
-
2026-06-13days on market $53,000 Active 103 DOM
-
2026-06-12days on market $53,000 Active 102 DOM
-
2026-06-09days on market $53,000 Active 99 DOM
-
2026-06-08days on market $53,000 Active 98 DOM
-
2026-06-08days on market $53,000 Active 97 DOM
-
2026-06-07days on market $53,000 Active 96 DOM
-
2026-06-04days on market $53,000 Active 93 DOM
-
2026-06-02days on market $53,000 Active 92 DOM
-
2026-06-01days on market $53,000 Active 91 DOM
-
2026-05-31days on market $53,000 Active 90 DOM
-
2026-03-26price $53,000
-
2026-02-26$59,900 Active
-
2025-01-27status Active
-
2025-01-20price $59,000
-
2024-11-15price $69,000
-
2024-09-06price $74,000
-
2024-07-22$75,000 Active
ⓘ Source: listings_history table (triggers on properties + properties_extension) + one-shot
backfill from property_details.listing_events for pre-trigger history.
Tax reassessment forecast OK · Resets to sale price
- Current annual tax
- $124 · $10/mo
- Projected year-2 tax
- $477 · $40/mo
- Expected delta
- +$353/yr (+$29/mo · 284.7%)
ⓘ Screening estimate from a state-policy table — verify with the county assessor before closing.
Climate risk First Street
- Flood 4/10 Moderate 22% chance over 30 yrs
- Wildfire 3/10 Moderate
- Heat 7/10 Severe 7 d/yr ≥109°F today · 18 d/yr by 30 yrs out
- Wind 3/10 Moderate 6% chance of damaging wind over 30 yrs
- Air quality 1/10 Low 0 unhealthy d/yr today · 0 by 30 yrs out
Nearby sold comps map
Loading sold comps map…
Walkable amenities ~0.75 mi
Loading nearby amenities…
Taxation est. · year 1
- Rental income
- $11,856
- − Mortgage interest
- −$2,969
- − Property taxes
- −$124
- − Insurance
- −$265
- − Repairs & maintenance
- −$948
- − Management
- −$948
- − Depreciation
- −$1,542
- Taxable income
- $5,059
- Est. tax owed @ 24.0%
- −$1,214
- After-tax cash flow
- $4,428/yr
For passive investors: Depreciation is non-cash, so a rental often shows a tax loss while cash-flowing — sheltering income. Rental losses are passive: they offset passive income freely, and up to $25,000/yr can offset ordinary (W-2) income if you actively participate and your MAGI is under $100k (phasing out to $0 by $150k); unused losses carry forward. On sale, claimed depreciation is recaptured at up to 25%, and gains may owe capital-gains tax (a 1031 exchange can defer both). Figures are a year-1 estimate at your 24.0% rate — not tax advice; consult a CPA.
Schools (NCES district)
- District
- Frederick
- NCES district ID
- 4012150
- Math proficiency
- 41% ▼ -2.00%
- Reading proficiency
- 28% ▼ -13.00%
- Median HH income
- $34,495
- Composite
- 28.52/100
- National rank
- #6735
- State rank
- #46 of 270 in OK
Livability — Frederick
- Score
- 61/100
- State rank
- #304
- US rank
- #17869
Category grades
Schools grade is shown separately in the Schools card above.
Census & demographics
- Census place
- Frederick, OK
- Population (ZIP)
- 4,167
Population outlook (Tillman County) Hauer SSP2
- Today (2025)
- 6,949 people
- By 2030
- 6,737 · -3.1%
- By 2040
- 6,402 · -7.9%
- By 2050
- 6,364 · -8.4%
- By 2075
- 7,335 · +5.6%
- By 2100
- 9,166 · +31.9%
Race, ethnicity, and origin ACS 2023
- Neighborhood character
- Diverse neighborhood (Simpson 0.61)
- Race & ethnicity
- White 54% Hispanic / Latino 31% Two or more races 13% Black 9% Native American 3%
- Hispanic origin (detail)
- Mexican 29%
- Common ancestry
- Italian 3% European 1% Slovak 1%
- Foreign-born
- 3% · Canada
- Languages at home
- 88% English-only · Spanish 12%
Political lean MEDSL · Tillman
- 2024 margin
- Solid R (+59.5) · D 19.7% · R 79.2% · Other 1.1%
- 2008→2024 swing
- -23.8pp toward R · 2008: -35.6pp · 2024: -59.5pp
- All cycles
- 2024: R+59.5 2020: R+54.6 2016: R+47.6 2012: R+33.4 2008: R+35.6
Not yet ingested
- Civics
- —
Market trends
- HPI YoY
- ▼ -3.32%
- Current HPI
- 159.0458
- Rent YoY
- —
- Metro
- —
- State GDP YoY
- ▲ 1.55%
- F500 in state
- 6
Industry mix (Fortune 500 HQ in OK)
| Industry | F500 HQs | Revenue |
|---|---|---|
| Energy | 3 | $48B |
|
||
Price history
-29.3% since first listed7 events — show timeline
- 2026-03-26 Price Changed $53,000 MLSOK
- 2026-02-26 Listed $59,900 MLSOK
- 2025-01-27 Relisted — LBRMLS
- 2025-01-20 Price Changed $59,000 LBRMLS
- 2024-11-15 Price Changed $69,000 LBRMLS
- 2024-09-06 Price Changed $74,000 LBRMLS
- 2024-07-22 Listed $75,000 LBRMLS
Property tax history
+58.2%/yrLatest (2025): $124 · -2.4% YoY. Source: county tax records.
Cash-flow waterfall
monthlySold comps — $/sqft
last 12 mo · ≤1 miLoading sold comps…