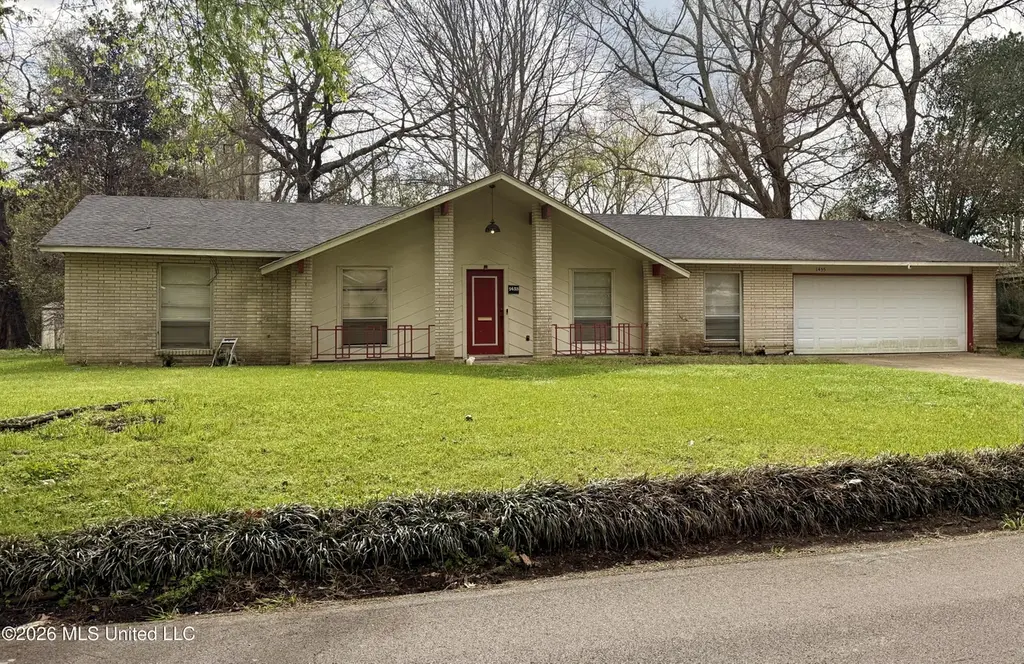
1455 Wooddell Dr · Jackson, MS
Flood risk 5/10 · Moderate
- FEMA flood zone
- X (unshaded)
- Chance of flooding over 30 yrs
- 0.5%
- Est. flood insurance / yr
- $507 – $1,088
Fire risk 3/10 · Minor
- Est. fire insurance / yr
- $1,241 – $2,305
Heat risk 7/10 · Major
- Hot days now (above 108°F)
- 7 days/yr
- Hot days in 30 yrs
- 20 days/yr
Wind risk 8/10 · Major
- Chance of severe wind over 30 yrs
- 80.0%
Air-quality risk 1/10 · Minimal
- Unhealthy air days now
- 0 days/yr
- Unhealthy air days in 30 yrs
- 0 days/yr
Risk factors via First Street. Map © Google.
Why this score? — see what drove the C grade
The composite is a weighted blend of 9 inputs, each scored 0–100. Each bar is that input's sub-score; the figure is the points it added to the 100-point composite (weight × sub-score).
- Cash flow +25.7/30.0
- DSCR +8.6/10.0
- ARV discount +6.8/15.0
- 1% rule +6.4/10.0
- Rent growth +3.6/5.0
- Livability +3.4/5.0
- Condition / age +2.5/5.0
- Schools +1.1/10.0
- Appreciation +0.0/10.0
$115,000
🖨 Deal sheet (PDF) 📄 Offer letter ✓ Due diligence
Listing remarks MLS
Charming older home full of character with great bones and incredible potential! This property features solid construction, a spacious layout, and an attractive price point. Ideal opportunity for buyers who want to add their own style and make it truly their own.
Key facts
- 0.29 acre lot
- 2 garage spots
- Built 1969
Neighborhood map
What this means for you Summary
Snapshot
- This is a 3-bed/2.0-bath single-family listed at $115k.
Deal economics
- At list price, monthly cash flow is $276 ($3k/yr) — positive.
- The deal already cash-flows at list — no discount required.
- Meets the 1% rule at list price ($1k rent vs $115k).
- Recommended offer: $105k (9.0% below list) — sets the bar for market timing.
Location & tenants
- Location reads 68/100 on livability (#66 in MS) — a middle-class / working-renter tenant base. Strengths: commute A+, cost of living A+, housing A+; Watch: amenities F, employment F, health & safety F.
- Jackson Public School District (urban): math 9% / reading 18% proficiency, ranked #112 of 130 in MS (top 86%) — low school quality limits family demand, transient renter base, plan for 1-2y turnover; 88% free/reduced lunch — lower-income household profile, screen leases tightly.
- Zoned schools: Cardozo Middle School (math 5% / reading 10%, grade F, #168 of 179 statewide, top 94%, 625 students, 100% FRL); Forest Hill High School (math 5% / reading 15%, grade F, #168 of 197 statewide, top 86%, 991 students, 100% FRL).
- Market conditions: Rents rising fast (+4.2%/yr); 302 active listings in the ZIP; 37 comparable units currently listed for rent nearby; rentals at typical pace (median 25d on market — plan ~3-4 weeks tenant-placement turnaround); 167 units permitted in Hinds County in 2024 (0 in 5+ unit buildings).
- This rent runs 31% of the median local income ($51k/yr) — at the standard rent-burdened threshold; future hikes will face affordability resistance.
Forward outlook
- Local home prices are declining (-3.0%/yr); year-one equity from $795 of loan paydown is wiped out by about $3k of value loss. Plan a longer hold.
- Hinds County population projected to shrink 6% by 2050 — rents likely to lag national; underwrite the cash flow, not the appreciation.
- At projected returns (-3.0% appreciation + 4.2% rent growth), your $32k cash investment doubles in ~10 years — after that, you're playing with house money.
Negotiation context
- It's been on market 100 days — a 9% lower offer ($105k) is reasonable based on typical stale-listing flexibility.
- 6 sale attempts since 25y ago; this cycle's ask is 5% above the opening price — seller raised mid-cycle; expect resistance to lowballs.
Risks & watch-outs
- Climate carrying-cost: moderate flood risk; severe wind risk, 80% chance of damaging wind over 30y; extreme-heat days projected 7→20/yr by 2055 (HVAC capex compounding) — expect insurance premiums to compound above CPI over the hold.
Questions for the listing agent
- It's been on market 100 days. Have you received any prior offers? Is the seller open to a 9% concession, seller financing, or rate buy-down credit?
- Built in 1969 — when were the roof, HVAC, electrical panel, plumbing, and water heater last replaced?
- Why hasn't it sold? Are there any deal-killer items the seller is aware of (foundation, flood, title, zoning, code violations)?
- Is there a deadline driving the sale (1031 exchange, divorce, estate, relocation)? That informs how much negotiation room exists.
- Schools are F-rated, which usually means shorter tenancies and higher turnover. Who's the typical renter profile here, and what's been the actual vacancy rate?
- What's the average days-on-market for RENTAL listings here right now (not sales)? A rising rental-DOM trend means longer vacancies and softer asking-rent achievability than the comps imply.
- What's the recent tenant-quality profile in this submarket — average credit score on applications, eviction rate, late-payment / NSF rate, and stable-employment percentage? A property-management company in the area should have these aggregated.
- How much new for-sale + rental construction is in the pipeline within 1–3 miles? Heavy new supply typically softens prices + rents 12–24 months out; constrained supply supports both.
Investment metrics
- 1% rule
- 1.14% ✓
- Cap rate
- 9.17%
- Cash-on-cash
- 10.28%
- DSCR
- 1.46
- GRM
- 7.3
CMA / ARV
- ARV (median comp)
- $113,164
- List price
- $115,000
- Delta
- 1.62%
- Verdict
- FAIR
- Comps
- 20 within 1.0 mi
Show comp detail 12 sales within ~0.75 mi
| Address | Dist | Beds/Ba | Sqft | Sold | Price | $/sf | Match |
|---|---|---|---|---|---|---|---|
| 1843 Longwood Dr | 0.16mi | 3/2.0 | 1,634 (-3%) | 10mo | $125,000 | $76 | 79 |
| 1027 Autumn St | 0.53mi | 3/2.0 | 1,694 (+0%) | 2mo | $84,900 | $50 | 74 |
| 1732 Southhaven Cir | 0.43mi | 3/2.0 | 1,675 (-1%) | 8mo | $62,500 | $37 | 71 |
| 1422 Wooddell Dr | 0.13mi | 4/2.0 (+1) | 1,540 (-9%) | 6mo | $99,000 | $64 | 69 |
| 2971 Kentwood Dr | 0.32mi | 4/2.0 (+1) | 1,532 (-10%) | 3mo | $59,900 | $39 | 62 |
| 2938 Oak Forest Dr | 0.65mi | 3/1.5 | 1,726 (+2%) | 9mo | $93,500 | $54 | 57 |
| 1435 Brinoy Dr | 0.63mi | 3/2.0 | 1,760 (+4%) | 12mo | $78,000 | $44 | 54 |
| 1943 Bienville Dr | 0.40mi | 3/2.0 | 1,484 (-12%) | 8mo | $25,000 | $17 | 54 |
| 3007 Oak Forest Dr | 0.66mi | 4/2.0 (+1) | 1,520 (-10%) | 6mo | $99,700 | $66 | 42 |
| 3218 Meadow Forest Dr | 0.68mi | 4/2.0 (+1) | 1,898 (+12%) | 3mo | $59,000 | $31 | 40 |
| 3121 Woodvile Cir | 0.57mi | 4/3.0 (+1) | 1,872 (+11%) | 9mo | $80,000 | $43 | 39 |
| 2530 Crestleigh Mnr | 0.71mi | 3/1.5 | 1,445 (-15%) | 8mo | $62,000 | $43 | 33 |
Match score weights: distance 35% · size 25% · config 20% · recency 20%. Top-matched comps best support the ARV.
Projected returns pro-forma
-3.0% appreciation · 4.23% rent growth · sell at horizon
- IRR
- 0.5%
- Equity multiple
- 1.02×
- Total profit
- $577
- Equity at exit
- $17,147
- IRR
- 11.3%
- Equity multiple
- 1.93×
- Total profit
- $30,051
- Equity at exit
- $9,943
Cash invested: $32,200 (down + closing). Projections, not guarantees.
Landlord ↔ Tenant lean methodology
- Overall (STATE)
- 90 Strongly Landlord-Friendly
- State Mississippi
- 90 Strongly Landlord-Friendly · R+11
- County
- — inherits STATE
- City
- — inherits STATE
ZIP-level market 39212
- Home prices YoY
- -11.7%
- Rents YoY
- 4.2%
- Active inventory
- 302
- Price-to-rent
- 7.3×
Monthly cashflow live
- Estimated rent
- $1,315 high interval (Pro) →
- Mortgage (P&I)
- −$603
- Tax from tax record
- −$112 /mo · $1,345/yr
- Insurance
- −$48
- HOA
- −$0
- Vacancy / Maint / Mgmt
- −$276
- Net cashflow
- $276
Break-even live
Sensitivity live
| Price | -10% $341 | -5% $308 | +0% $276 | +5% $243 | +10% $211 |
|---|---|---|---|---|---|
| Rent | -10% $172 | -5% $224 | +0% $276 | +5% $328 | +10% $380 |
| Rate | -1.0pp $334 | -0.5pp $305 | base $276 | +0.5pp $246 | +1.0pp $216 |
UW: 25.0% down · 7.5% · 30yr · 1.5% tax · 5.0% vac · 8.0% maint · 8.0% mgmt
Financing live
Cash to close
- Down payment
- $28,750
- Closing costs
- $3,450
- Reserves months
- —
- Total cash needed
- —
Loan-product check · same deal, 3 products live
Conventional
25% down · 7.5% · 30yr
- Down + closing
- —
- Monthly P&I
- —
- Monthly cashflow
- —
- DSCR
- —
- Eligible?
- —
Personal DTI + credit; lowest rate.
DSCR
20% down · 8.5% · 30yr
- Down + closing
- —
- Monthly P&I
- —
- Monthly cashflow
- —
- DSCR
- —
- Eligible?
- —
No personal income docs; deal must DSCR.
Hard money
10% down · 12.0% · 12mo
- Down + closing
- —
- Monthly P&I
- —
- Monthly cashflow
- —
- DSCR
- —
- Eligible?
- —
Short-term bridge; refi at stabilization.
Rent comps 37 comps
| Address | Beds | Baths | Sqft | Rent | $/sqft | DOM | Units | Dist |
|---|---|---|---|---|---|---|---|---|
| 2915 Longwood Dr Jackson, MS | 3.0 | 2.0 | 1800 | $1,400 | $0.78 | 25d | 1 | 0.15mi |
| 2808 Ridgeland Dr Jackson, MS | 3.0 | 2.0 | 1606 | $1,600 | $1.00 | 45d | 1 | 0.19mi |
| 2904 Marwood Dr Jackson, MS | 3.0 | 2.0 | 1554 | $1,250 | $0.80 | 25d | 1 | 0.35mi |
| 427 McDowell Park Cir Jackson, MS | 3.0 | 1.5 | 1308 | $1,200 | $0.92 | 15d | 1 | 0.40mi |
| 3020 Lakewood Dr Jackson, MS | 4.0 | 2.0 | 1600 | $1,150 | $0.72 | 25d | 1 | 0.56mi |
| 3049 Lakewood Dr Jackson, MS | 3.0 | 1.0 | 1200 | $975 | $0.81 | 45d | 1 | 0.58mi |
| 1219 Woody Dr Jackson, MS | 3.0 | 1.0 | 1058 | $1,150 | $1.09 | 25d | 1 | 0.65mi |
| 3030 Oak Forest Dr Jackson, MS | 3.0 | 1.5 | 1200 | $1,100 | $0.92 | 45d | 1 | 0.69mi |
| 3030 Oak Forest Dr Jackson, MS | 3.0 | 2.0 | 1200 | $1,100 | $0.92 | 15d | 1 | 0.69mi |
| 1513 Maria Dr Jackson, MS | 3.0 | 2.0 | 1120 | $1,200 | $1.07 | 15d | 1 | 0.73mi |
| 1513 Maria Dr Jackson, MS | 3.0 | 2.0 | 1120 | $1,200 | $1.07 | 25d | 1 | 0.73mi |
| 2732 Woodside Dr Jackson, MS | 4.0 | 2.0 | 1566 | $1,050 | $0.67 | 25d | 1 | 0.74mi |
| 2694 Woodside Dr Jackson, MS | 3.0 | 1.0 | 1509 | $1,075 | $0.71 | 25d | 1 | 0.77mi |
| 2694 Woodside Dr Jackson, MS | 3.0 | 1.0 | 1509 | $1,075 | $0.71 | 15d | 1 | 0.77mi |
| 3122 Oak Forest Dr Jackson, MS | 3.0 | 2.0 | 1421 | $1,100 | $0.77 | 45d | 1 | 0.78mi |
| 3308 Ramona St Jackson, MS | 3.0 | 1.0 | 1104 | $1,150 | $1.04 | 22d | 1 | 0.79mi |
| 3162 Oak Forest Dr Jackson, MS | 3.0 | 1.5 | 1280 | $1,236 | $0.97 | 45d | 1 | 0.83mi |
| 1010 Deryll St Jackson, MS | 3.0 | 2.0 | 1143 | $1,050 | $0.92 | 15d | 1 | 0.85mi |
| 1018 Deryll St Jackson, MS | 3.0 | 1.0 | 1056 | $900 | $0.85 | 25d | 1 | 0.86mi |
| 1533 Raymond Rd Jackson, MS | 2.0 | 1.0 | 1135 | $1,010 | $0.89 | 45d | 1 | 0.87mi |
| 1054 Deryll St Jackson, MS | 3.0 | 1.5 | 1132 | $1,050 | $0.93 | 15d | 1 | 0.89mi |
| 2873 Teresa Dr Jackson, MS | 3.0 | 1.0 | 1100 | $1,100 | $1.00 | 45d | 1 | 0.90mi |
| 3341 Suncrest Dr Jackson, MS | 4.0 | 1.0 | 1292 | $1,225 | $0.95 | 45d | 1 | 0.91mi |
| 1126 Barbara Ann Dr Jackson, MS | 3.0 | 1.0 | 1343 | $1,000 | $0.74 | 15d | 1 | 0.92mi |
| 1126 Barbara Ann Dr Jackson, MS | 3.0 | 1.0 | 1343 | $1,000 | $0.74 | 45d | 1 | 0.92mi |
| 3147 Shirley Dr Jackson, MS | 4.0 | 2.0 | 2137 | $1,425 | $0.67 | 45d | 1 | 0.93mi |
| 3147 Shirley Dr Jackson, MS | 4.0 | 2.0 | 2137 | $1,425 | $0.67 | 15d | 1 | 0.93mi |
| 3151 Shirley Dr Jackson, MS | 4.0 | 2.0 | 1474 | $1,306 | $0.89 | 15d | 1 | 0.94mi |
| 1223 Marydale Dr Jackson, MS | 3.0 | 1.0 | 1300 | $950 | $0.73 | 45d | 1 | 0.94mi |
| 5136 Lurline Dr Unit Ma Jackson, MS | 3.0 | 1.5 | 1134 | $1,100 | $0.97 | 15d | 1 | 0.97mi |
| 2729 Carleton St Jackson, MS | 4.0 | 2.0 | 1666 | $1,575 | $0.95 | 15d | 1 | 0.99mi |
| 1805 Hospital Dr Jackson, MS | 3.0 | 2.0 | 1335 | $1,050 | $0.79 | 15d | 1 | 1.11mi |
| 2242 Castle Hill Dr Jackson, MS | 4.0 | 2.0 | 1500 | $1,475 | $0.98 | 25d | 1 | 1.16mi |
| 2242 Castle Hill Dr Jackson, MS | 4.0 | 2.0 | 1500 | $1,475 | $0.98 | 15d | 1 | 1.16mi |
| 3147 Bilgray Dr Jackson, MS | 3.0 | 2.0 | 1850 | $1,306 | $0.71 | 45d | 1 | 1.25mi |
| 3152 Bilgray Dr Jackson, MS | 3.0 | 1.5 | 1200 | $1,100 | $0.92 | 15d | 1 | 1.28mi |
| 125 Wingfield Ct Unit NA Jackson, MS | 4.0 | 2.0 | 1797 | $1,650 | $0.92 | 25d | 1 | 1.28mi |
Listing history 36 events
-
2026-06-22days on market $115,000 Active 100 DOM
-
2026-06-18days on market $115,000 Active 97 DOM
-
2026-06-17days on market $115,000 Active 96 DOM
-
2026-06-16days on market $115,000 Active 95 DOM
-
2026-06-15days on market $115,000 Active 94 DOM
-
2026-06-14days on market $115,000 Active 92 DOM
-
2026-06-13days on market $115,000 Active 91 DOM
-
2026-06-10days on market $115,000 Active 89 DOM
-
2026-06-09days on market $115,000 Active 88 DOM
-
2026-06-08days on market $115,000 Active 87 DOM
-
2026-06-07days on market $115,000 Active 86 DOM
-
2026-06-05days on market $115,000 Active 83 DOM
-
2026-06-03days on market $115,000 Active 82 DOM
-
2026-06-02days on market $115,000 Active 81 DOM
-
2026-06-01days on market $115,000 Active 80 DOM
-
2026-05-31days on market $115,000 Active 79 DOM
-
2026-05-30days on market $115,000 Active 78 DOM
-
2026-03-14price $115,000 263-char remark
Show marketing remark (263 chars)
Charming older home full of character with great bones and incredible potential! This property features solid construction, a spacious layout, and an attractive price point. Ideal opportunity for buyers who want to add their own style and make it truly their own.
-
2026-03-13$110,000 Active 263-char remark
Show marketing remark (263 chars)
Charming older home full of character with great bones and incredible potential! This property features solid construction, a spacious layout, and an attractive price point. Ideal opportunity for buyers who want to add their own style and make it truly their own.
-
2024-10-30historical
-
2024-09-14price $99,000
-
2024-08-07price $109,998
-
2024-05-13$112,000 Active
-
2021-10-29soldstatus Closed
-
2021-10-29soldstatus
-
2021-10-20historical
-
2021-10-20historical
-
2021-10-08historical
-
2021-09-22$90,000
-
2020-10-07$86,000
-
2007-11-12$119,999
-
2002-01-11soldstatus
-
2002-01-11soldstatus
-
2001-11-12$75,200
-
1987-07-31soldstatus
-
1969-05-09soldstatus
ⓘ Source: listings_history table (triggers on properties + properties_extension) + one-shot
backfill from property_details.listing_events for pre-trigger history.
Tax reassessment forecast MS · Resets to sale price
- Current annual tax
- $1,345 · $112/mo
- Projected year-2 tax
- $1,345 · $112/mo
- Expected delta
- $0/yr ($0/mo · 0.0%)
ⓘ Screening estimate from a state-policy table — verify with the county assessor before closing.
Climate risk First Street
- Flood 5/10 Major FEMA zone X (unshaded) · 50% chance over 30 yrs
- Wildfire 3/10 Moderate
- Heat 7/10 Severe 7 d/yr ≥108°F today · 20 d/yr by 30 yrs out
- Wind 8/10 Severe 80% chance of damaging wind over 30 yrs
- Air quality 1/10 Low 0 unhealthy d/yr today · 0 by 30 yrs out
Nearby sold comps map
Loading sold comps map…
Walkable amenities ~0.75 mi
Loading nearby amenities…
Taxation est. · year 1
- Rental income
- $15,780
- − Mortgage interest
- −$6,442
- − Property taxes
- −$1,345
- − Insurance
- −$575
- − Repairs & maintenance
- −$1,262
- − Management
- −$1,262
- − Depreciation
- −$3,345
- Taxable income
- $1,548
- Est. tax owed @ 24.0%
- −$371
- After-tax cash flow
- $2,938/yr
For passive investors: Depreciation is non-cash, so a rental often shows a tax loss while cash-flowing — sheltering income. Rental losses are passive: they offset passive income freely, and up to $25,000/yr can offset ordinary (W-2) income if you actively participate and your MAGI is under $100k (phasing out to $0 by $150k); unused losses carry forward. On sale, claimed depreciation is recaptured at up to 25%, and gains may owe capital-gains tax (a 1031 exchange can defer both). Figures are a year-1 estimate at your 24.0% rate — not tax advice; consult a CPA.
Schools (NCES district)
- District
- Jackson Public School District
- NCES district ID
- 2802190
- Math proficiency
- 9% ▼ -14.00%
- Reading proficiency
- 18% ▼ -7.00%
- Median HH income
- $33,234
- Composite
- 10.89/100
- National rank
- #9755
- State rank
- #112 of 130 in MS
Livability — Jackson
- Score
- 68/100
- State rank
- #66
- US rank
- #9695
Category grades
Schools grade is shown separately in the Schools card above.
Census & demographics
- Census place
- Jackson, MS
- County
- Hinds County · 167,040 people
- City population
- 140,204
- Metro
- Jackson, MS
- Population (ZIP)
- 25,659
- Household income
- $50,722
- Rent vs Own
- Severe rent burden
- 1314.0
Population outlook (Hinds County) Hauer SSP2
- Today (2025)
- 242,528 people
- By 2030
- 241,113 · -0.6%
- By 2040
- 235,557 · -2.9%
- By 2050
- 226,946 · -6.4%
- By 2075
- 199,995 · -17.5%
- By 2100
- 164,165 · -32.3%
Race, ethnicity, and origin ACS 2023
- Neighborhood character
- Predominantly Black (86%)
- Race & ethnicity
- Black 86% White 9% Hispanic / Latino 3% Two or more races 3%
- Common ancestry
- Serbian 1% Lithuanian 1%
- Foreign-born
- 1% · Canada
- Languages at home
- 97% English-only · Spanish 2%
Political lean MEDSL · Hinds
- 2024 margin
- Solid D (+46.1) · D 72.4% · R 26.3% · Other 1.4%
- 2008→2024 swing
- +7.1pp toward D · 2008: 39.0pp · 2024: 46.1pp
- All cycles
- 2024: D+46.1 2020: D+48.3 2016: D+43.7 2012: D+45.1 2008: D+39.0
Not yet ingested
- Civics
- —
Market trends
- HPI YoY
- ▼ -23.01%
- Current HPI
- 174.4025
- Rent YoY
- ▲ 4.23%
- Metro
- Jackson, MS
- State GDP YoY
- —
- F500 in state
- 0
Price history
+52.9% since first listed19 events — show timeline
- 2026-03-14 Price Changed $115,000 MLSU
- 2026-03-13 Listed $110,000 MLSU
- 2024-10-30 Listing Removed — MLSU
- 2024-09-14 Price Changed $99,000 MLSU
- 2024-08-07 Price Changed $109,998 MLSU
- 2024-05-13 Listed $112,000 MLSU
- 2021-10-29 Sold (Public Records) — Public Records
- 2021-10-29 Sold (MLS) — MLSU
- 2021-10-20 Listing Removed — MLSU
- 2021-10-20 Listing Removed — MLSU
- 2021-10-08 Listing Removed — MLSU
- 2021-09-22 Listed $90,000 MLSU
- 2020-10-07 Listed $86,000 MLSU
- 2007-11-12 Listed $119,999 MLSU
- 2002-01-11 Sold (Public Records) — Public Records
- 2002-01-11 Sold (MLS) — MLSU
- 2001-11-12 Listed $75,200 MLSU
- 1987-07-31 Sold (Public Records) — Public Records
- 1969-05-09 Sold (Public Records) — Public Records
Property tax history
+1.6%/yrLatest (2025): $1,345 · +3.6% YoY. Source: county tax records.
Cash-flow waterfall
monthlySold comps — $/sqft
last 12 mo · ≤1 miLoading sold comps…