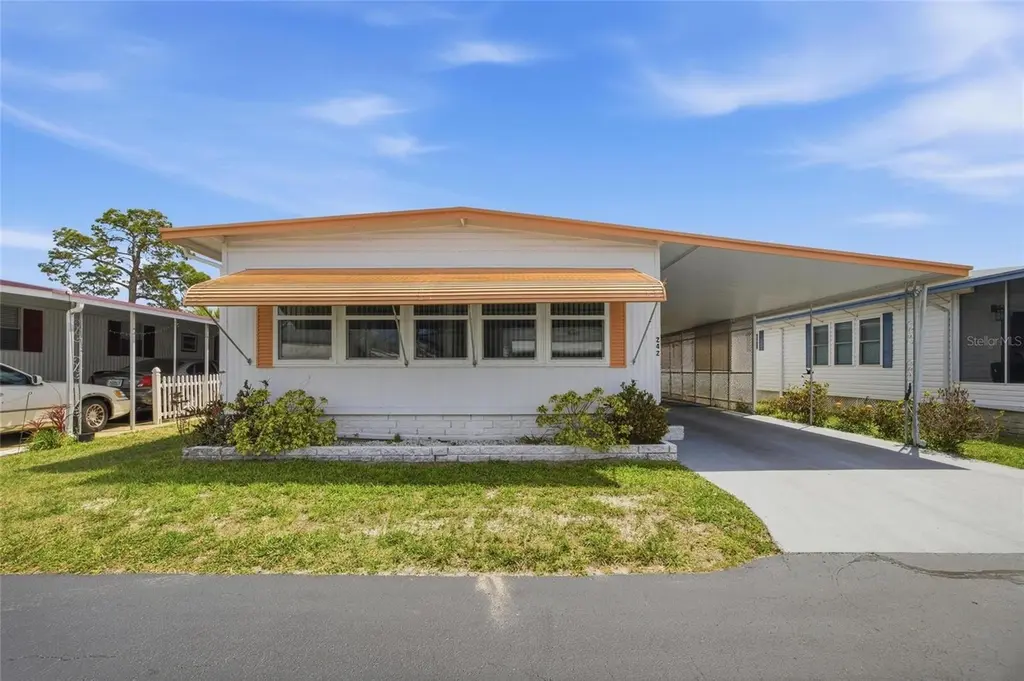
9900 Ulmerton Rd #242 · Largo, FL
Flood risk 9/10 · Severe
- FEMA flood zone
- AE
- Chance of flooding over 30 yrs
- 0.99%
- Est. flood insurance / yr
- $1,737 – $8,500
Fire risk 1/10 · Minimal
- Est. fire insurance / yr
- $947 – $1,759
Heat risk 10/10 · Severe
- Hot days now (above 107°F)
- 6 days/yr
- Hot days in 30 yrs
- 18 days/yr
Wind risk 10/10 · Severe
- Chance of severe wind over 30 yrs
- 99.0%
Air-quality risk 3/10 · Minor
- Unhealthy air days now
- 2 days/yr
- Unhealthy air days in 30 yrs
- 3 days/yr
Risk factors via First Street. Map © Google.
Why this score? — see what drove the C grade
The composite is a weighted blend of 9 inputs, each scored 0–100. Each bar is that input's sub-score; the figure is the points it added to the 100-point composite (weight × sub-score).
- Cash flow +25.8/30.0
- DSCR +8.6/10.0
- 1% rule +7.1/10.0
- Schools +4.3/10.0
- Livability +4.1/5.0
- Condition / age +2.5/5.0
- ARV discount +2.4/15.0
- Rent growth +2.2/5.0
- Appreciation +0.0/10.0
$160,000
🖨 Deal sheet (PDF) 📄 Offer letter ✓ Due diligence
Listing remarks
Come checkout this furnished manufactured home in the Grosse Pointe. A desirable 55+ resort-style community, offering the ultimate Florida lifestyle just minutes from the Gulf beaches and shopping. Walk into a light-filled, open floor plan with a generously sized living space, plenty of natural sunlight, and tasteful updates—ideal for comfortable daily living and hosting guests. Newer kitchen remodel with laminate floors, countertops, dishwasher, and refrigerator. The community offers a wide range of amenities, including a heated pool and soothing hot tub, an updated clubhouse with planned social gatherings, a fitness center, shuffleboard courts, and a billiards room. You’ll als
Key facts
- Updated clubhouse
- Soothing hot tub
- Heated pool
Tags
Property features AI
Finance
- Other: Furnished; Living area approximately 1,056 square feet; Building area approximately 1,908 square feet
- Financial info: Annual taxes (2025): $490; Lease restrictions apply
- HOA & community: Has HOA (monthly fee required, $201.14); Association approval required; Association amenities include clubhouse, pool, spa/hot tub, pickleball courts and shuffleboard courts; Senior community; Pets allowed (cats and dogs), max pet weight 20 lbs
Exterior
- Parking: Carport with 2 spaces
- Utilities: Public water; Public sewer; Cable available; Electricity connected; Water connected; Sewer connected
- Home design: Residential mobile home (double wide); One story; Home faces west
- Construction: Metal roof; Other construction materials
- Exterior features: Awnings; Shed(s)
Interior
- Kitchen: Dishwasher; Range; Range hood; Refrigerator
- Bedrooms: 2 bedrooms
- Flooring: Carpet; Laminate
- Bathrooms: 2 full bathrooms
- Heating & cooling: Central heating; Exhaust fan for ventilation; Central air conditioning
- Interior features: Ceiling fans; Blinds, drapes and curtain rods; Exhaust fan
- Laundry & utility: Outdoor laundry area
Neighborhood map
What this means for you Summary
Snapshot
- This is a 2-bed/2.0-bath manufactured listed at $160k.
Deal economics
- At list price, monthly cash flow is $-40 ($-484/yr) — negative.
- To cash-flow at today's rent, offer at most $153k (4.5% below list).
- Meets the 1% rule at list price ($2k rent vs $160k).
- Recommended offer: $150k (6.0% below list) — sets the bar for market timing.
- Cap rate 9.2% vs local median 4.3% in Largo — top-decile yield for the area; either an underpriced asset or a hidden risk that comps aren't pricing in. Stress-test before assuming the spread holds.
Location & tenants
- Location reads 82/100 on livability (#82 in FL, #1,240 nationally) — a professional / high-income tenant draw. Strengths: commute A+, cost of living A+, housing A+; Watch: employment D+, amenities F.
- Pinellas (suburban): math 51% / reading 51% proficiency, ranked #31 of 73 in FL (top 42%) — acceptable for families but not a draw, mixed tenant base, ~2y average lease.
- Zoned schools: Southern Oak Elementary School (math 63% / reading 49%, grade C+, #832 of 2,144 statewide, top 40%, 556 students, 61% FRL); Osceola Middle School (math 48% / reading 45%, grade D+, #297 of 571 statewide, top 52%, 1,009 students, 52% FRL); Pinellas Park High School (math 28% / reading 35%, grade F, #424 of 667 statewide, top 64%, 1,919 students, 57% FRL).
- Market conditions: Rents soft (-1.1%/yr); 225 active listings in the ZIP; 40 comparable units currently listed for rent nearby; rentals leasing fast (median 7d on market — plan ~1-2 weeks tenant-placement turnaround); 2,676 units permitted in Pinellas County in 2024 (1,422 in 5+ unit buildings).
- This rent runs 39% of the median local income ($60k/yr) — at the standard rent-burdened threshold; future hikes will face affordability resistance.
Forward outlook
- Local home prices are declining (-3.0%/yr); year-one equity from $1k of loan paydown is wiped out by about $5k of value loss. Plan a longer hold.
- Pinellas County population projected at +14% by 2050 — modest demand growth; plan on rents tracking national, not racing it.
Negotiation context
- It's been on market 67 days — a 6% lower offer ($150k) is reasonable based on typical stale-listing flexibility.
- 4 sale attempts with the ask held roughly flat each time — persistent listings suggest the price (not the market) is what's stuck; bring a comps-based counter.
- Current owner paid $75k; list at $160k implies a 114% gain — meaningful room to come down on a strong offer.
Risks & watch-outs
- Watch-outs: flood insurance adds $427/mo.
- Climate carrying-cost: in FEMA flood zone AE (mandatory federal flood insurance); severe wind risk, 99% chance of damaging wind over 30y; extreme-heat days projected 6→18/yr by 2055 (HVAC capex compounding) — expect insurance premiums to compound above CPI over the hold.
Questions for the listing agent
- What do current leases actually rent for vs. the listed asking? Can we see a recent rent roll and the last 12 months of T-12 income?
- It's been on market 67 days. Have you received any prior offers? Is the seller open to a 6% concession, seller financing, or rate buy-down credit?
- Built in 1969 — when were the roof, HVAC, electrical panel, plumbing, and water heater last replaced?
- What's the actual annual flood-insurance premium (NFIP or private), and is the property in a SFHA with mandatory coverage?
- What does the HOA fee cover, when was the last increase, and are there any pending special assessments or reserve-fund shortfalls?
- Why hasn't it sold? Are there any deal-killer items the seller is aware of (foundation, flood, title, zoning, code violations)?
- Is there a deadline driving the sale (1031 exchange, divorce, estate, relocation)? That informs how much negotiation room exists.
- What's the average days-on-market for RENTAL listings here right now (not sales)? A rising rental-DOM trend means longer vacancies and softer asking-rent achievability than the comps imply.
- What's the recent tenant-quality profile in this submarket — average credit score on applications, eviction rate, late-payment / NSF rate, and stable-employment percentage? A property-management company in the area should have these aggregated.
- How much new for-sale + rental construction is in the pipeline within 1–3 miles? Heavy new supply typically softens prices + rents 12–24 months out; constrained supply supports both.
Investment metrics
- 1% rule
- 1.21% ✓
- Cap rate
- 9.19%
- Cash-on-cash
- 10.35%
- DSCR
- 1.46
- GRM
- 6.9
CMA / ARV
- ARV (on-the-fly)
- $143,616
- Comps found
- 5
Show comp detail 5 sales within ~0.75 mi
| Address | Dist | Beds/Ba | Sqft | Sold | Price | $/sf | Match |
|---|---|---|---|---|---|---|---|
| 13225 101st St #411 | 0.20mi | 2/2.0 | 1,056 (0%) | 18mo | $115,000 | $109 | 76 |
| 9900 Ulmerton Rd #236 | 0.00mi | 2/2.0 | 1,152 (+9%) | 13mo | $172,500 | $150 | 74 |
| 13225 101st St #166 | 0.20mi | 2/2.0 | 960 (-9%) | 7mo | $152,500 | $159 | 70 |
| 9900 Ulmerton Rd #214 | 0.00mi | 2/2.0 | 1,152 (+9%) | 20mo | $156,500 | $136 | 68 |
| 13225 101st St #350 | 0.20mi | 2/2.0 | 1,152 (+9%) | 18mo | $80,000 | $69 | 61 |
Match score weights: distance 35% · size 25% · config 20% · recency 20%. Top-matched comps best support the ARV.
Projected returns pro-forma
-3.0% appreciation · 0.0% rent growth · sell at horizon
- IRR
- -22.8%
- Equity multiple
- 0.24×
- Total profit
- $-33,867
- Equity at exit
- $23,857
- IRR
- -35.7%
- Equity multiple
- -0.19×
- Total profit
- $-53,497
- Equity at exit
- $13,834
Cash invested: $44,800 (down + closing). Projections, not guarantees.
Landlord ↔ Tenant lean methodology
- Overall (STATE)
- 87 Strongly Landlord-Friendly
- State Florida
- 87 Strongly Landlord-Friendly · R+3
- County
- — inherits STATE
- City
- — inherits STATE
ZIP-level market 33771
- Home prices YoY
- -30.2%
- Rents YoY
- -1.1%
- Active inventory
- 225
- Price-to-rent
- 6.9×
Monthly cashflow live
- Estimated rent
- $1,942 high interval (Pro) →
- Mortgage (P&I)
- −$839
- Tax from tax record
- −$41 /mo · $490/yr
- Insurance
- −$67
- Flood insurance flood zone
- −$427 /mo · $5,118/yr
- HOA
- −$201
- Vacancy / Maint / Mgmt
- −$408
- Net cashflow
- $-40
Break-even live
Sensitivity live
| Price | -10% $50 | -5% $5 | +0% $-40 | +5% $-86 | +10% $-131 |
|---|---|---|---|---|---|
| Rent | -10% $-194 | -5% $-117 | +0% $-40 | +5% $36 | +10% $113 |
| Rate | -1.0pp $40 | -0.5pp $0 | base $-40 | +0.5pp $-82 | +1.0pp $-124 |
UW: 25.0% down · 7.5% · 30yr · 1.5% tax · 5.0% vac · 8.0% maint · 8.0% mgmt
Financing live
Cash to close
- Down payment
- $40,000
- Closing costs
- $4,800
- Reserves months
- —
- Total cash needed
- —
Loan-product check · same deal, 3 products live
Conventional
25% down · 7.5% · 30yr
- Down + closing
- —
- Monthly P&I
- —
- Monthly cashflow
- —
- DSCR
- —
- Eligible?
- —
Personal DTI + credit; lowest rate.
DSCR
20% down · 8.5% · 30yr
- Down + closing
- —
- Monthly P&I
- —
- Monthly cashflow
- —
- DSCR
- —
- Eligible?
- —
No personal income docs; deal must DSCR.
Hard money
10% down · 12.0% · 12mo
- Down + closing
- —
- Monthly P&I
- —
- Monthly cashflow
- —
- DSCR
- —
- Eligible?
- —
Short-term bridge; refi at stabilization.
Rent comps 40 comps
| Address | Beds | Baths | Sqft | Rent | $/sqft | DOM | Units | Dist |
|---|---|---|---|---|---|---|---|---|
| 9925 Ulmerton Rd #74 Largo, FL | 2.0 | 1.5 | 1140 | $1,800 | $1.58 | 20d | 1 | 0.18mi |
| 13225 101st St #116 Largo, FL | 2.0 | 2.0 | 1152 | $1,600 | $1.39 | 6d | 1 | 0.22mi |
| 12651 Seminole Blvd #44 Largo, FL | 2.0 | 1.5 | 1000 | $1,450 | $1.45 | 26d | 1 | 0.62mi |
| 12293 Sailwinds Dr #203 Largo, FL | 3.0 | 2.0 | 1155 | $2,050 | $1.77 | 16d | 1 | 0.68mi |
| 12261 Sailwinds Dr #203 Largo, FL | 3.0 | 2.0 | 1139 | $1,800 | $1.58 | 6d | 1 | 0.70mi |
| 10100 Sailwinds Blvd N #206 Largo, FL | 3.0 | 2.0 | 1155 | $1,850 | $1.60 | 5d | 1 | 0.71mi |
| 10155 Sailwinds Blvd S #204 Largo, FL | 2.0 | 2.0 | 1018 | $1,695 | $1.67 | 0d | 1 | 0.90mi |
| 10160 Sailwinds Blvd S Largo, FL | 2.0 | 2.0 | 901 | $1,950 | $2.16 | 26d | 2 | 0.91mi |
| 2098 Seminole Blvd Largo, FL | 1.0–3.0 | 1.0–2.0 | 1018 | $2,395 | $2.35 | 4d | 23 | 0.92mi |
| 1201 Seminole Blvd Largo, FL | 1.0–3.0 | 1.0–2.0 | 1067 | $1,870 | $1.75 | 4d | 1 | 0.94mi |
| 253 Sago Palm St Largo, FL | 2.0 | 2.0 | 1000 | $1,295 | $1.29 | 26d | 1 | 1.01mi |
| 8775 Christie Dr Largo, FL | 2.0 | 3.0 | 1300 | $2,198 | $1.69 | 20d | 1 | 1.05mi |
| 10495 118th Ave Largo, FL | 3.0 | 2.0 | 1169 | $2,250 | $1.92 | 6d | 1 | 1.06mi |
| 2131 Ridge Rd S #105 Largo, FL | 2.0 | 1.5 | 1035 | $1,850 | $1.79 | 26d | 1 | 1.07mi |
| 667 Sugar Palm St Largo, FL | 2.0 | 2.0 | 1296 | $2,500 | $1.93 | 5d | 1 | 1.08mi |
| 1200 Country Club Dr #1502 Largo, FL | 2.0 | 2.0 | 1320 | $2,350 | $1.78 | 6d | 1 | 1.11mi |
| 1200 Country Club Dr #4102 Largo, FL | 2.0 | 2.0 | 1324 | $2,100 | $1.59 | 6d | 1 | 1.11mi |
| 1200 Country Club Dr #3302 Largo, FL | 2.0 | 2.0 | 1320 | $2,200 | $1.67 | 6d | 1 | 1.11mi |
| 310 15th Ave SW Largo, FL | 3.0 | 2.0 | 1284 | $2,800 | $2.18 | 26d | 1 | 1.14mi |
| 960 Starkey Rd #8402 Largo, FL | 2.0 | 2.0 | 1324 | $2,200 | $1.66 | 26d | 1 | 1.14mi |
| 705 Redbud LN Largo, FL | 1.0–2.0 | 1.0–2.0 | 986 | $2,615 | $2.65 | 0d | 185 | 1.15mi |
| 775 Royal Palm Cir Largo, FL | 2.0 | 2.0 | 1008 | $1,700 | $1.69 | 6d | 1 | 1.15mi |
| 10568 117th Dr Largo, FL | 3.0 | 2.0 | 1118 | $2,400 | $2.15 | 0d | 1 | 1.16mi |
| 960 Starkey Rd #10305 Largo, FL | 2.0 | 2.0 | 1324 | $2,200 | $1.66 | 17d | 1 | 1.17mi |
| 960 Starkey Rd #5105 Largo, FL | 2.0 | 2.0 | 1324 | $2,295 | $1.73 | 26d | 1 | 1.18mi |
| 2820 S Pines Dr #132 Largo, FL | 2.0 | 1.5 | 1048 | $1,800 | $1.72 | 0d | 1 | 1.22mi |
| 12100 Seminole Blvd Largo, FL | 2.0 | 2.0 | 1050 | $1,750 | $1.67 | 26d | 1 | 1.22mi |
| 11707 108th St Unit 1018171P Largo, FL | 3.0 | 2.0 | 1259 | $3,050 | $2.42 | 0d | 1 | 1.24mi |
| 2871 S Pines Dr #24 Largo, FL | 2.0 | 1.5 | 1048 | $1,800 | $1.72 | 26d | 1 | 1.24mi |
| 3030 Whispering Dr N Largo, FL | 3.0 | 2.0 | 1348 | $3,600 | $2.67 | 26d | 1 | 1.31mi |
| 11201 122nd Ave Largo, FL | 1.0–2.0 | 1.0–2.0 | 867 | $2,150 | $2.48 | 0d | 2 | 1.31mi |
| 13333 Ridge Rd Largo, FL | 1.0–2.0 | 1.0–1.5 | 860 | $1,765 | $2.05 | 9d | 1 | 1.31mi |
| 10560 114th Ter Largo, FL | 3.0 | 1.0 | 1232 | $3,000 | $2.44 | 6d | 1 | 1.31mi |
| 600 6th Ave SE Largo, FL | 3.0 | 2.0 | 1364 | $2,400 | $1.76 | 26d | 1 | 1.32mi |
| 504 7th St SE Largo, FL | 2.0 | 1.0 | 888 | $2,250 | $2.53 | 0d | 1 | 1.32mi |
| 44 Countryclub Dr #44 Largo, FL | 2.0 | 2.0 | 1278 | $2,300 | $1.80 | 26d | 1 | 1.35mi |
| 68 Country Club Dr Largo, FL | 2.0 | 2.0 | 1396 | $2,100 | $1.50 | 26d | 1 | 1.39mi |
| 69 Country Club Dr Largo, FL | 2.0 | 2.0 | 1278 | $2,000 | $1.56 | 26d | 1 | 1.39mi |
| 46 Palm Forest Dr Largo, FL | 2.0 | 2.0 | 1296 | $2,200 | $1.70 | 6d | 1 | 1.41mi |
| 10580 112th Ave Largo, FL | 3.0 | 1.0 | 925 | $1,995 | $2.16 | 6d | 1 | 1.42mi |
HOA detail
- Monthly dues
- $201 · $2,412/yr
- Likely covers
- poolgym
Listing history 24 events
-
2026-06-22days on market $160,000 Active 67 DOM
-
2026-06-18days on market $160,000 Active 64 DOM
-
2026-06-17days on market $160,000 Active 63 DOM
-
2026-06-16days on market $160,000 Active 62 DOM
-
2026-06-15days on market $160,000 Active 61 DOM
-
2026-06-13days on market $160,000 Active 59 DOM
-
2026-06-09days on market $160,000 Active 55 DOM
-
2026-06-08days on market $160,000 Active 54 DOM
-
2026-06-07days on market $160,000 Active 53 DOM
-
2026-06-04days on market $160,000 Active 50 DOM
-
2026-06-03days on market $160,000 Active 49 DOM
-
2026-06-01days on market $160,000 Active 47 DOM
-
2026-05-31days on market $160,000 Active 46 DOM
-
2026-04-15$160,000 Active
-
2026-02-12historical
-
2025-12-10status Active
-
2025-12-06status Pending
-
2025-11-12$170,000 Active
-
2025-06-02historical
-
2025-04-30price $180,000
-
2025-04-10price $185,000
-
2025-02-21$189,000 Active
-
2008-01-01soldstatus $74,600
-
2002-10-01soldstatus $24,000
ⓘ Source: listings_history table (triggers on properties + properties_extension) + one-shot
backfill from property_details.listing_events for pre-trigger history.
Tax reassessment forecast FL · Resets to sale price
- Current annual tax
- $490 · $41/mo
- Projected year-2 tax
- $1,328 · $111/mo
- Expected delta
- +$838/yr (+$70/mo · 171.0%)
ⓘ Screening estimate from a state-policy table — verify with the county assessor before closing.
Climate risk First Street
- Flood 9/10 Extreme FEMA zone AE · 99% chance over 30 yrs
- Wildfire 1/10 Low
- Heat 10/10 Extreme 6 d/yr ≥107°F today · 18 d/yr by 30 yrs out
- Wind 10/10 Extreme 99% chance of damaging wind over 30 yrs
- Air quality 3/10 Moderate 2 unhealthy d/yr today · 3 by 30 yrs out
Nearby sold comps map
Loading sold comps map…
Walkable amenities ~0.75 mi
Loading nearby amenities…
Taxation est. · year 1
- Rental income
- $23,298
- − Mortgage interest
- −$8,962
- − Property taxes
- −$490
- − Insurance
- −$5,918
- − Repairs & maintenance
- −$1,864
- − Management
- −$1,864
- − HOA
- −$2,412
- − Depreciation
- −$4,655
- Taxable loss
- −$2,867
- Est. tax savings @ 24.0%
- +$688
- After-tax cash flow
- $204/yr
For passive investors: Depreciation is non-cash, so a rental often shows a tax loss while cash-flowing — sheltering income. Rental losses are passive: they offset passive income freely, and up to $25,000/yr can offset ordinary (W-2) income if you actively participate and your MAGI is under $100k (phasing out to $0 by $150k); unused losses carry forward. On sale, claimed depreciation is recaptured at up to 25%, and gains may owe capital-gains tax (a 1031 exchange can defer both). Figures are a year-1 estimate at your 24.0% rate — not tax advice; consult a CPA.
Schools (NCES district)
- District
- Pinellas
- NCES district ID
- 1201560
- Math proficiency
- 51% ▼ -5.00%
- Reading proficiency
- 51% ▼ -3.00%
- Median HH income
- $46,270
- Composite
- 43.27/100
- National rank
- #3046
- State rank
- #31 of 73 in FL
Livability — Largo
- Score
- 82/100
- State rank
- #82
- US rank
- #1240
Category grades
Schools grade is shown separately in the Schools card above.
Census & demographics
- Census place
- Largo, FL
- County
- Pinellas County · 939,478 people
- City population
- 106,311
- Metro
- Tampa-St. Petersburg-Clearwater, FL
- Population (ZIP)
- 27,596
- Household income
- $59,993
- Rent vs Own
- Severe rent burden
- 1243.0
Population outlook (Pinellas County) Hauer SSP2
- Today (2025)
- 1,027,532 people
- By 2030
- 1,063,586 · +3.5%
- By 2040
- 1,125,020 · +9.5%
- By 2050
- 1,168,637 · +13.7%
- By 2075
- 1,265,188 · +23.1%
- By 2100
- 1,260,357 · +22.7%
Race, ethnicity, and origin ACS 2023
- Neighborhood character
- Predominantly White (74%)
- Race & ethnicity
- White 74% Hispanic / Latino 14% Two or more races 9% Black 4% Asian 3%
- Hispanic origin (detail)
- Mexican 3% Puerto Rican 6% Dominican 2%
- Common ancestry
- Romanian 4% Lithuanian 3% Slovak 2%
- Foreign-born
- 13% · Canada, Jamaica, Guatemala
- Languages at home
- 82% English-only · Spanish 12% Other Indo-European 2% Russian/Polish/Slavic 2%
Political lean MEDSL · Pinellas
- 2024 margin
- Lean R (+5.2) · D 46.9% · R 52.1%
- 2008→2024 swing
- -13.5pp toward R · 2008: 8.3pp · 2024: -5.2pp
- All cycles
- 2024: R+5.2 2020: D+0.2 2016: R+1.1 2012: D+5.6 2008: D+8.3
Not yet ingested
- Civics
- —
Market trends
- HPI YoY
- ▼ -135.36%
- Current HPI
- 313.5044
- Rent YoY
- ▼ -1.06%
- Metro
- Tampa-St. Petersburg-Clearwater, FL
- State GDP YoY
- ▲ 3.28%
- F500 in state
- 36
Industry mix (Fortune 500 HQ in FL)
| Industry | F500 HQs | Revenue |
|---|---|---|
| Industrial Technology | 2 | $29B |
|
||
| Insurance | 2 | $17B |
|
||
| Retail | 1 | $60B |
|
||
| Technology Distribution | 1 | $58B |
|
||
| Homebuilding | 1 | $35B |
|
||
| Technology Manufacturing | 1 | $35B |
|
||
Price history
+566.7% since first listed11 events — show timeline
- 2026-04-15 Listed $160,000 Stellar MLS as Distributed by MLS Grid
- 2026-02-12 Listing Removed — Stellar MLS as Distributed by MLS Grid
- 2025-12-10 Relisted — Stellar MLS as Distributed by MLS Grid
- 2025-12-06 Pending — Stellar MLS as Distributed by MLS Grid
- 2025-11-12 Listed $170,000 Stellar MLS as Distributed by MLS Grid
- 2025-06-02 Listing Removed — Stellar MLS as Distributed by MLS Grid
- 2025-04-30 Price Changed $180,000 Stellar MLS as Distributed by MLS Grid
- 2025-04-10 Price Changed $185,000 Stellar MLS as Distributed by MLS Grid
- 2025-02-21 Listed $189,000 Stellar MLS as Distributed by MLS Grid
- 2008-01-01 Sold (Public Records) $74,600 Public Records
- 2002-10-01 Sold (Public Records) $24,000 Public Records
Property tax history
-4.0%/yrLatest (2025): $490 · +4.2% YoY. Source: county tax records.
Cash-flow waterfall
monthlySold comps — $/sqft
last 12 mo · ≤1 miLoading sold comps…