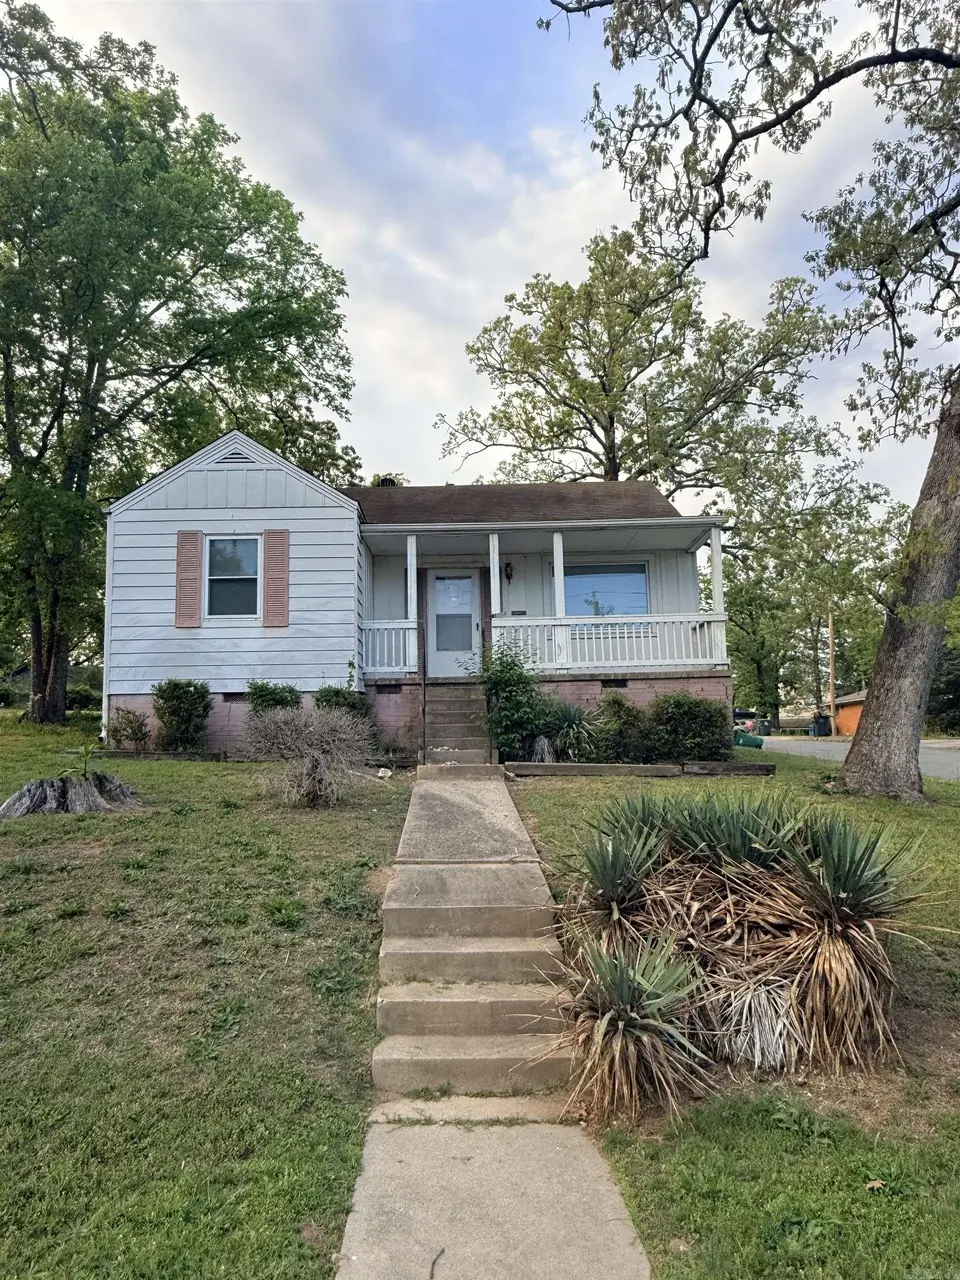
4300 W 9th St · Little Rock, AR
Flood risk No data
- FEMA flood zone
- —
- Chance of flooding over 30 yrs
- —
- Est. flood insurance / yr
- —
Fire risk No data
- Est. fire insurance / yr
- —
Heat risk No data
- Hot days now (above threshold)
- —
- Hot days in 30 yrs
- —
Wind risk No data
- Chance of severe wind over 30 yrs
- —
Air-quality risk No data
- Unhealthy air days now
- —
- Unhealthy air days in 30 yrs
- —
Risk factors via First Street. Map © Google.
Why this score? — see what drove the C grade
The composite is a weighted blend of 9 inputs, each scored 0–100. Each bar is that input's sub-score; the figure is the points it added to the 100-point composite (weight × sub-score).
- Cash flow +18.8/30.0
- ARV discount +14.4/15.0
- DSCR +5.9/10.0
- 1% rule +5.0/10.0
- Condition / age +3.8/5.0
- Rent growth +3.7/5.0
- Livability +3.7/5.0
- Schools +2.1/10.0
- Appreciation +0.0/10.0
$135,000
🖨 Deal sheet (PDF) 📄 Offer letter ✓ Due diligence
Listing remarks MLS
Great opportunity in Little Rock featuring 2 bedrooms and 2 bathrooms with a flexible bonus room that could easily be converted into a primary suite, as the second bathroom is attached. This home offers two separate living areas and a dedicated dining room, providing plenty of space for everyday living and entertaining. Refrigerator conveys with the sale. For GPS purposes, use 4300 Maryland Ave, Little Rock, AR 72204 to navigate to the home.
Key facts
- Flexible bonus room
- 5,227 sq ft lot
- 2 parking spots
Tags
Neighborhood map
What this means for you Summary
Snapshot
- This is a 2-bed/2.0-bath single-family listed at $135k. Condition is rated good.
Deal economics
- At list price, monthly cash flow is $135 ($2k/yr) — positive.
- The deal already cash-flows at list — no discount required.
- Meets the 1% rule at list price ($1k rent vs $135k).
- Recommended offer: $127k (6.0% below list) — sets the bar for market timing.
- Cap rate 7.5% vs local median 4.1% in Little Rock — top-decile yield for the area; either an underpriced asset or a hidden risk that comps aren't pricing in. Stress-test before assuming the spread holds.
Location & tenants
- Location reads 73/100 on livability (#22 in AR) — a middle-class / working-renter tenant base. Strengths: commute A+, cost of living A+, housing A+; Watch: crime F.
- Little Rock School District (urban): math 23% / reading 26% proficiency, ranked #183 of 238 in AR (top 77%) — low school quality limits family demand, transient renter base, plan for 1-2y turnover; 69% free/reduced lunch — lower-income household profile, screen leases tightly.
- Market conditions: Rents rising fast (+4.9%/yr); 187 active listings in the ZIP; 19 comparable units currently listed for rent nearby; rentals at typical pace (median 25d on market — plan ~3-4 weeks tenant-placement turnaround); 47% of comp listings sitting > 30 days — soft ceiling on asking rent; lower-income renter base — watch delinquency; 1,006 units permitted in Pulaski County in 2024 (0 in 5+ unit buildings).
- This rent runs 40% of the median local income ($41k/yr) — at the standard rent-burdened threshold; future hikes will face affordability resistance.
Forward outlook
- Local home prices are declining (-3.0%/yr); year-one equity from $933 of loan paydown is wiped out by about $4k of value loss. Plan a longer hold.
- Pulaski County population projected at +6% by 2050 — modest demand growth; plan on rents tracking national, not racing it.
Negotiation context
- It's been on market 70 days — a 6% lower offer ($127k) is reasonable based on typical stale-listing flexibility.
Questions for the listing agent
- It's been on market 70 days. Have you received any prior offers? Is the seller open to a 6% concession, seller financing, or rate buy-down credit?
- Why hasn't it sold? Are there any deal-killer items the seller is aware of (foundation, flood, title, zoning, code violations)?
- Is there a deadline driving the sale (1031 exchange, divorce, estate, relocation)? That informs how much negotiation room exists.
- Crime grade is F in this area — have there been break-ins, vandalism, or insurance claims at this property in the last 3 years? What carrier currently insures it and at what premium?
- What's the average days-on-market for RENTAL listings here right now (not sales)? A rising rental-DOM trend means longer vacancies and softer asking-rent achievability than the comps imply.
- What's the recent tenant-quality profile in this submarket — average credit score on applications, eviction rate, late-payment / NSF rate, and stable-employment percentage? A property-management company in the area should have these aggregated.
- How much new for-sale + rental construction is in the pipeline within 1–3 miles? Heavy new supply typically softens prices + rents 12–24 months out; constrained supply supports both.
Investment metrics
- 1% rule
- 1.00% ✓
- Cap rate
- 7.50%
- Cash-on-cash
- 4.30%
- DSCR
- 1.19
- GRM
- 8.3
CMA / ARV
- ARV (median comp)
- $159,455
- List price
- $135,000
- Delta
- -15.34%
- Verdict
- UNDERPRICED
- Comps
- 20 within 1.0 mi
Show comp detail 12 sales within ~0.75 mi
| Address | Dist | Beds/Ba | Sqft | Sold | Price | $/sf | Match |
|---|---|---|---|---|---|---|---|
| 3703 Stonehedge Dr | 0.17mi | 3/2.0 (+1) | 1,300 (-2%) | 8mo | $158,000 | $122 | 78 |
| 4500 Weldon Ave | 0.33mi | 2/2.0 | 1,248 (-6%) | 2mo | $176,000 | $141 | 74 |
| 4018 Elam St | 0.31mi | 3/1.0 (+1) | 1,337 (+1%) | 9mo | $90,000 | $67 | 67 |
| 4418 Holt St | 0.39mi | 3/2.0 (+1) | 1,243 (-6%) | 2mo | $182,000 | $146 | 66 |
| 3800 Elam St | 0.32mi | 2/1.0 | 1,236 (-6%) | 6mo | $92,500 | $75 | 65 |
| 4422 Holt St | 0.40mi | 3/2.0 (+1) | 1,243 (-6%) | 5mo | $182,000 | $146 | 63 |
| 9505 Dartmouth Dr | 0.51mi | 3/2.0 (+1) | 1,355 (+2%) | 6mo | $178,000 | $131 | 62 |
| 3709 Foster St | 0.22mi | 3/1.0 (+1) | 1,175 (-11%) | 1mo | $118,000 | $100 | 62 |
| 4407 Bowers St | 0.36mi | 3/2.0 (+1) | 1,243 (-6%) | 12mo | $183,500 | $148 | 58 |
| 4500 Ludwig | 0.54mi | 3/2.0 (+1) | 1,148 (-13%) | 6mo | $145,000 | $126 | 43 |
| 9115 W 32nd St | 0.55mi | 3/2.0 (+1) | 1,200 (-9%) | 15mo | $179,000 | $149 | 41 |
| 2807 Dorset Dr | 0.69mi | 3/2.0 (+1) | 1,493 (+13%) | 1mo | $175,000 | $117 | 40 |
Match score weights: distance 35% · size 25% · config 20% · recency 20%. Top-matched comps best support the ARV.
Projected returns pro-forma
-3.0% appreciation · 4.91% rent growth · sell at horizon
- IRR
- -7.4%
- Equity multiple
- 0.72×
- Total profit
- $-10,583
- Equity at exit
- $20,129
- IRR
- 4.4%
- Equity multiple
- 1.35×
- Total profit
- $13,272
- Equity at exit
- $11,672
Cash invested: $37,800 (down + closing). Projections, not guarantees.
Landlord ↔ Tenant lean methodology
- Overall (STATE)
- 92 Strongly Landlord-Friendly
- State Arkansas
- 92 Strongly Landlord-Friendly · R+14
- County
- — inherits STATE
- City
- — inherits STATE
ZIP-level market 72204
- Home prices YoY
- -21.5%
- Rents YoY
- 4.9%
- Active inventory
- 187
- Price-to-rent
- 8.3×
Monthly cashflow live
- Estimated rent
- $1,352 high interval (Pro) →
- Mortgage (P&I)
- −$708
- Tax est. 1.5%
- −$169 /mo · $2,025/yr
- Insurance
- −$56
- HOA
- −$0
- Vacancy / Maint / Mgmt
- −$284
- Net cashflow
- $135
Break-even live
Sensitivity live
| Price | -10% $229 | -5% $182 | +0% $135 | +5% $89 | +10% $42 |
|---|---|---|---|---|---|
| Rent | -10% $29 | -5% $82 | +0% $135 | +5% $189 | +10% $242 |
| Rate | -1.0pp $203 | -0.5pp $170 | base $135 | +0.5pp $100 | +1.0pp $65 |
UW: 25.0% down · 7.5% · 30yr · 1.5% tax · 5.0% vac · 8.0% maint · 8.0% mgmt
Financing live
Cash to close
- Down payment
- $33,750
- Closing costs
- $4,050
- Reserves months
- —
- Total cash needed
- —
Loan-product check · same deal, 3 products live
Conventional
25% down · 7.5% · 30yr
- Down + closing
- —
- Monthly P&I
- —
- Monthly cashflow
- —
- DSCR
- —
- Eligible?
- —
Personal DTI + credit; lowest rate.
DSCR
20% down · 8.5% · 30yr
- Down + closing
- —
- Monthly P&I
- —
- Monthly cashflow
- —
- DSCR
- —
- Eligible?
- —
No personal income docs; deal must DSCR.
Hard money
10% down · 12.0% · 12mo
- Down + closing
- —
- Monthly P&I
- —
- Monthly cashflow
- —
- DSCR
- —
- Eligible?
- —
Short-term bridge; refi at stabilization.
Rent comps 19 comps
| Address | Beds | Baths | Sqft | Rent | $/sqft | DOM | Units | Dist |
|---|---|---|---|---|---|---|---|---|
| 3724 Holt St Little Rock, AR | 3.0 | 2.0 | 1200 | $1,300 | $1.08 | 25d | 1 | 0.29mi |
| 4112 Elam St Little Rock, AR | 3.0 | 1.0 | 1188 | $1,145 | $0.96 | 25d | 1 | 0.31mi |
| 9105 W 36th St Little Rock, AR | 3.0 | 2.0 | 1200 | $1,295 | $1.08 | 16d | 1 | 0.40mi |
| 4421 Malloy St Unit B Little Rock, AR | 3.0 | 1.5 | 1250 | $1,300 | $1.04 | 25d | 1 | 0.48mi |
| 9401 Courtney Cv Little Rock, AR | 3.0 | 2.0 | 1500 | $2,029 | $1.35 | 25d | 1 | 0.66mi |
| 2823 Covenant Cv Little Rock, AR | 3.0 | 2.0 | 1500 | $2,029 | $1.35 | 25d | 1 | 0.69mi |
| 8700 Colonel Glenn Rd #5 Little Rock, AR | 1.0 | 1.0 | 950 | $1,300 | $1.37 | 45d | 1 | 0.69mi |
| 2900 Lehigh Dr Unit 2900 Little Rock, AR | 3.0 | 2.0 | 1600 | $2,029 | $1.27 | 25d | 1 | 0.74mi |
| 9416 Covenant Ln Little Rock, AR | 3.0 | 2.0 | 1550 | $2,029 | $1.31 | 25d | 1 | 0.76mi |
| 2706 Longcoy St Little Rock, AR | 3.0 | 2.0 | 1200 | $1,250 | $1.04 | 45d | 1 | 0.98mi |
| 3219 Potter St Little Rock, AR | 3.0 | 1.0 | 976 | $895 | $0.92 | 45d | 1 | 1.11mi |
| 9012 Tanya Dr Little Rock, AR | 2.0 | 1.5 | 1036 | $1,045 | $1.01 | 25d | 1 | 1.12mi |
| 8 Utica Ln Little Rock, AR | 3.0 | 1.5 | 1006 | $850 | $0.84 | 45d | 1 | 1.22mi |
| 10005 W 20th St Unit a Little Rock, AR | 3.0 | 2.5 | 1545 | $1,565 | $1.01 | 45d | 1 | 1.30mi |
| 10101 W 20th St Unit B Little Rock, AR | 3.0 | 2.0 | 1104 | $1,395 | $1.26 | 45d | 1 | 1.30mi |
| 10103 W 20th St Unit A Little Rock, AR | 3.0 | 2.0 | 1600 | $1,575 | $0.98 | 45d | 1 | 1.31mi |
| 1801 Labette Manor Dr Unit 7 Little Rock, AR | 3.0 | 1.5 | 991 | $995 | $1.00 | 45d | 1 | 1.40mi |
| 1801 Labette Manor Dr Unit 1 Little Rock, AR | 3.0 | 1.5 | 1000 | $995 | $0.99 | 16d | 1 | 1.40mi |
| 2412 Vancouver Dr Little Rock, AR | 3.0 | 1.5 | 1104 | $1,200 | $1.09 | 45d | 1 | 1.42mi |
Listing history 17 events
-
2026-06-21days on market $135,000 Active 70 DOM
-
2026-06-18days on market $135,000 Active 67 DOM
-
2026-06-17days on market $135,000 Active 66 DOM
-
2026-06-16days on market $135,000 Active 65 DOM
-
2026-06-15days on market $135,000 Active 64 DOM
-
2026-06-14days on market $135,000 Active 62 DOM
-
2026-06-13days on market $135,000 Active 61 DOM
-
2026-06-10days on market $135,000 Active 59 DOM
-
2026-06-09days on market $135,000 Active 58 DOM
-
2026-06-08days on market $135,000 Active 57 DOM
-
2026-06-05statusdays on market $135,000 Active 53 DOM
-
2026-06-03days on market $135,000 Price Change 52 DOM
-
2026-06-02days on market $135,000 Price Change 51 DOM
-
2026-06-01days on market $135,000 Price Change 50 DOM
-
2026-05-31days on market $135,000 Price Change 49 DOM
-
2026-05-31days on market $135,000 Price Change 48 DOM
-
2026-04-12$155,500 New Listing 445-char remark
Show marketing remark (445 chars)
Great opportunity in Little Rock featuring 2 bedrooms and 2 bathrooms with a flexible bonus room that could easily be converted into a primary suite, as the second bathroom is attached. This home offers two separate living areas and a dedicated dining room, providing plenty of space for everyday living and entertaining. Refrigerator conveys with the sale. For GPS purposes, use 4300 Maryland Ave, Little Rock, AR 72204 to navigate to the home.
ⓘ Source: listings_history table (triggers on properties + properties_extension) + one-shot
backfill from property_details.listing_events for pre-trigger history.
Nearby sold comps map
Loading sold comps map…
Walkable amenities ~0.75 mi
Loading nearby amenities…
Taxation est. · year 1
- Rental income
- $16,228
- − Mortgage interest
- −$7,562
- − Property taxes
- −$2,025
- − Insurance
- −$675
- − Repairs & maintenance
- −$1,298
- − Management
- −$1,298
- − Depreciation
- −$3,927
- Taxable loss
- −$558
- Est. tax savings @ 24.0%
- +$134
- After-tax cash flow
- $1,759/yr
For passive investors: Depreciation is non-cash, so a rental often shows a tax loss while cash-flowing — sheltering income. Rental losses are passive: they offset passive income freely, and up to $25,000/yr can offset ordinary (W-2) income if you actively participate and your MAGI is under $100k (phasing out to $0 by $150k); unused losses carry forward. On sale, claimed depreciation is recaptured at up to 25%, and gains may owe capital-gains tax (a 1031 exchange can defer both). Figures are a year-1 estimate at your 24.0% rate — not tax advice; consult a CPA.
Condition & rehab AI · 6 photos
This home is in good condition with cosmetic updates needed for a fresh look. It offers a good investment opportunity with potential for both resale and rental value.
Value-add opportunities
- Both Paint exterior trim — Enhances curb appeal and value
- Both Replace or clean gutters — Improves drainage and prevents water damage
Renovation cost estimate screening
Value-add ROI direction
- Both Paint exterior trim — Enhances curb appeal and value ↑
- Both Replace or clean gutters — Improves drainage and prevents water damage ↑
ⓘ Cost ranges are severity-bucket heuristics (US national rule-of-thumb). Get contractor quotes + a written scope before underwriting a rehab budget.
Schools (NCES district)
- District
- Little Rock School District
- NCES district ID
- 0509000
- Math proficiency
- 23% ▼ -12.00%
- Reading proficiency
- 26% ▼ -8.00%
- Median HH income
- $43,346
- Composite
- 21.0/100
- National rank
- #8457
- State rank
- #183 of 238 in AR
Livability — Little Rock
- Score
- 73/100
- State rank
- #22
- US rank
- #5295
Category grades
Schools grade is shown separately in the Schools card above.
Census & demographics
- Census place
- Little Rock, AR
- County
- Pulaski County · 372,764 people
- City population
- 218,896
- Metro
- Little Rock-North Little Rock-Conway, AR
- Population (ZIP)
- 30,525
- Household income
- $40,882
- Rent vs Own
- Severe rent burden
- 1553.0
Population outlook (Pulaski County) Hauer SSP2
- Today (2025)
- 415,378 people
- By 2030
- 423,720 · +2.0%
- By 2040
- 435,182 · +4.8%
- By 2050
- 440,904 · +6.1%
- By 2075
- 445,521 · +7.3%
- By 2100
- 419,173 · +0.9%
Race, ethnicity, and origin ACS 2023
- Neighborhood character
- Predominantly Black (66%)
- Race & ethnicity
- Black 66% White 18% Hispanic / Latino 12% Two or more races 6%
- Hispanic origin (detail)
- Mexican 9%
- Common ancestry
- Slovak 1%
- Foreign-born
- 7% · Canada, Vietnam
- Languages at home
- 89% English-only · Spanish 9% Vietnamese 1%
Political lean MEDSL · Pulaski
- 2024 margin
- Strong D (+22.1) · D 59.8% · R 37.7% · Other 2.5%
- 2008→2024 swing
- +10.6pp toward D · 2008: 11.6pp · 2024: 22.1pp
- All cycles
- 2024: D+22.1 2020: D+22.5 2016: D+17.9 2012: D+11.4 2008: D+11.6
Not yet ingested
- Civics
- —
Market trends
- HPI YoY
- ▼ -47.17%
- Current HPI
- 172.3977
- Rent YoY
- ▲ 4.91%
- Metro
- Little Rock-North Little Rock-Conway, AR
- State GDP YoY
- ▲ 3.80%
- F500 in state
- 10
Industry mix (Fortune 500 HQ in AR)
| Industry | F500 HQs | Revenue |
|---|---|---|
| Retail | 1 | $681B |
|
||
| Food / Agriculture | 1 | $53B |
|
||
| Retail / Energy | 1 | $22B |
|
||
| Transportation / Logistics | 1 | $12B |
|
||
| Energy | 1 | $4B |
|
||
Price history
1 event — show timeline
- 2026-04-12 Listed $155,500 CARMLS
Cash-flow waterfall
monthlySold comps — $/sqft
last 12 mo · ≤1 miLoading sold comps…