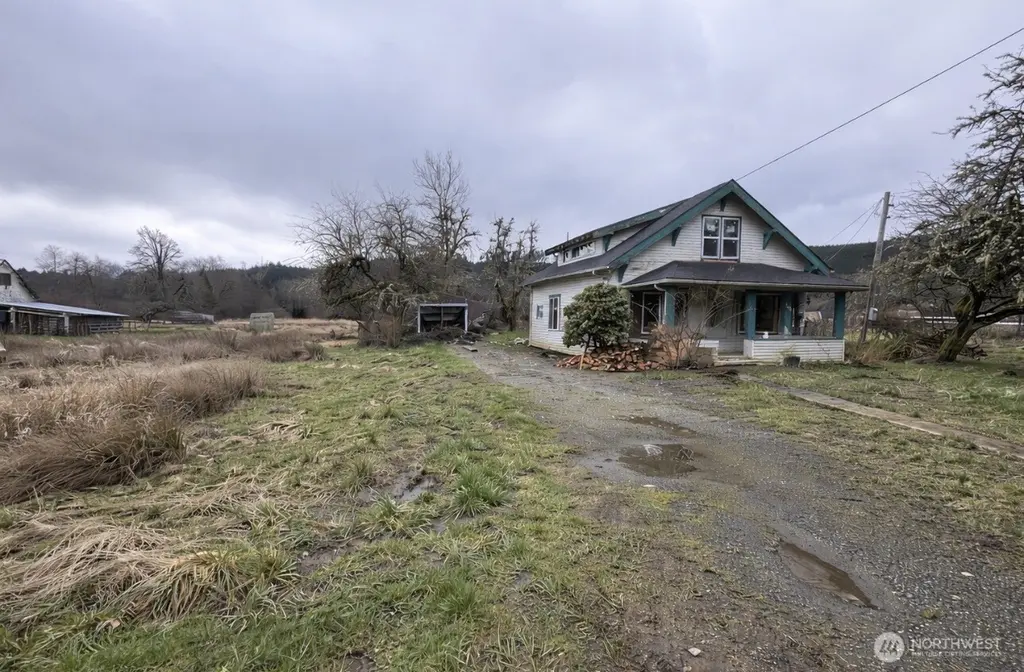
1391 W Skokomish Valley Rd · Skokomish, WA
Flood risk 8/10 · Major
- FEMA flood zone
- X (shaded)
- Chance of flooding over 30 yrs
- 0.99%
- Est. flood insurance / yr
- $507 – $1,088
Fire risk 4/10 · Minor
- Est. fire insurance / yr
- $604 – $1,122
Heat risk 3/10 · Minor
- Hot days now (above 88°F)
- 8 days/yr
- Hot days in 30 yrs
- 15 days/yr
Wind risk 1/10 · Minimal
- Chance of severe wind over 30 yrs
- —
Air-quality risk 5/10 · Moderate
- Unhealthy air days now
- 6 days/yr
- Unhealthy air days in 30 yrs
- 6 days/yr
Risk factors via First Street. Map © Google.
Why this score? — see what drove the D grade
The composite is a weighted blend of 9 inputs, each scored 0–100. Each bar is that input's sub-score; the figure is the points it added to the 100-point composite (weight × sub-score).
- Cash flow +22.3/30.0
- DSCR +7.2/10.0
- 1% rule +4.6/10.0
- Livability +3.0/5.0
- Schools +2.9/10.0
- Rent growth +2.5/5.0
- Condition / age +2.5/5.0
- ARV discount +0.0/15.0
- Appreciation +0.0/10.0
$240,000
🖨 Deal sheet 📄 Offer letter ✓ Due diligence
Listing remarks
ATTENTION INVESTORS! Opportunity awaits on this spacious . 95-acre property in a quiet rural setting. This 4-bedroom home is a true fixer with major improvements already started, including a newer roof, updated windows and doors, and partial plumbing and framing completed—giving you a strong head start on your vision. The home offers a functional layout with solid potential for renovation, expansion, or customization to your liking. The large lot provides plenty of room for outdoor living, additional structures, or future improvements, all while enjoying the privacy and open space of country living. Whether you’re an investor, builder, or buyer looking for a project, this proper
Key facts
- Quiet rural setting
- Newer roof
- Updated windows
Tags
Neighborhood map
What this means for you Summary
Snapshot
- This is a 4-bed/1.0-bath single-family listed at $240k.
Deal economics
- At list price, monthly cash flow is $330 ($4k/yr) — positive.
- The deal already cash-flows at list — no discount required.
- To meet the 1% rule (rent ≥ 1% of price), the offer needs to be $230k (4.2% below list).
- Recommended offer: $226k (6.0% below list) — sets the bar for market timing.
Location & tenants
- Location reads 60/100 on livability (#454 in WA) — a middle-class / working-renter tenant base. Strengths: cost of living A+, housing A+; Watch: health & safety C-, schools F, crime F.
- Hood Canal School District (rural): math 25% / reading 36% proficiency, ranked #267 of 291 in WA (top 92%) — families likely to look elsewhere, expect single-tenant / working-renter base with shorter leases; 72% free/reduced lunch — lower-income household profile, screen leases tightly.
- Market conditions: 439 active listings in the ZIP; solid renter incomes; 299 units permitted in Mason County in 2024 (0 in 5+ unit buildings).
- This rent runs 35% of the median local income ($79k/yr) — at the standard rent-burdened threshold; future hikes will face affordability resistance.
Forward outlook
- Local home prices are declining (-3.0%/yr); year-one equity from $2k of loan paydown is wiped out by about $7k of value loss. Plan a longer hold.
- Mason County population projected at -14% by 2050 — secular population decline; favor cash flow + early exit over multi-decade hold.
Negotiation context
- It's been on market 77 days — a 6% lower offer ($226k) is reasonable based on typical stale-listing flexibility.
- 2 sale attempts with the ask held roughly flat each time — persistent listings suggest the price (not the market) is what's stuck; bring a comps-based counter.
- Current owner paid $188k; 28% above their basis — modest negotiation headroom, anchor on the comps not their cost.
Risks & watch-outs
- Watch-outs: flood insurance adds $66/mo; built in 1925 — expect roof / HVAC / electrical / plumbing capex.
- Climate carrying-cost: severe flood risk — expect insurance premiums to compound above CPI over the hold.
Questions for the listing agent
- It's been on market 77 days. Have you received any prior offers? Is the seller open to a 6% concession, seller financing, or rate buy-down credit?
- Built in 1925 — when were the roof, HVAC, electrical panel, plumbing, and water heater last replaced?
- What's the actual annual flood-insurance premium (NFIP or private), and is the property in a SFHA with mandatory coverage?
- Why hasn't it sold? Are there any deal-killer items the seller is aware of (foundation, flood, title, zoning, code violations)?
- Is there a deadline driving the sale (1031 exchange, divorce, estate, relocation)? That informs how much negotiation room exists.
- Schools are F-rated, which usually means shorter tenancies and higher turnover. Who's the typical renter profile here, and what's been the actual vacancy rate?
- Crime grade is F in this area — have there been break-ins, vandalism, or insurance claims at this property in the last 3 years? What carrier currently insures it and at what premium?
- The area grade is low — what's the realistic commute time and amenity access for the typical tenant pool here? Any planned neighborhood developments (good or bad) we should know about?
- What's the average days-on-market for RENTAL listings here right now (not sales)? A rising rental-DOM trend means longer vacancies and softer asking-rent achievability than the comps imply.
- What's the recent tenant-quality profile in this submarket — average credit score on applications, eviction rate, late-payment / NSF rate, and stable-employment percentage? A property-management company in the area should have these aggregated.
- How much new for-sale + rental construction is in the pipeline within 1–3 miles? Heavy new supply typically softens prices + rents 12–24 months out; constrained supply supports both.
Investment metrics
- 1% rule
- 0.96% ✗
- Cap rate
- 8.28%
- Cash-on-cash
- 7.09%
- DSCR
- 1.32
- GRM
- 8.7
CMA / ARV
- ARV (median comp)
- $179,245
- List price
- $240,000
- Delta
- 33.90%
- Verdict
- OVERPRICED
- Comps
- 1 within 2.0 mi
Show comp detail 1 sale within ~0.75 mi
| Address | Dist | Beds/Ba | Sqft | Sold | Price | $/sf | Match |
|---|---|---|---|---|---|---|---|
| 191 W Deyette Rd | 0.40mi | 3/1.0 (-1) | 1,344 (-14%) | 20mo | $179,000 | $133 | 37 |
Match score weights: distance 35% · size 25% · config 20% · recency 20%. Top-matched comps best support the ARV.
Projected returns pro-forma
-3.0% appreciation · 3.0% rent growth · sell at horizon
- IRR
- -7.2%
- Equity multiple
- 0.73×
- Total profit
- $-17,916
- Equity at exit
- $35,785
- IRR
- 2.3%
- Equity multiple
- 1.17×
- Total profit
- $11,206
- Equity at exit
- $20,751
Cash invested: $67,200 (down + closing). Projections, not guarantees.
Landlord ↔ Tenant lean methodology
- Overall (STATE)
- 28 Tenant-Leaning
- State Washington
- 28 Tenant-Leaning · D+8
- County
- — inherits STATE
- City
- — inherits STATE
ZIP-level market 98584
- Active inventory
- 439
- Price-to-rent
- 8.7×
Monthly cashflow live
- Estimated rent
- $2,298 medium interval (Pro) →
- Mortgage (P&I)
- −$1,259
- Tax from tax record
- −$60 /mo · $721/yr
- Insurance
- −$100
- Flood insurance flood zone
- −$66 /mo · $798/yr
- HOA
- −$0
- Vacancy / Maint / Mgmt
- −$483
- Net cashflow
- $330
Break-even live
UW: 25.0% down · 7.5% · 30yr · 1.5% tax · 5.0% vac · 8.0% maint · 8.0% mgmt
Financing live
Cash to close
- Down payment
- $60,000
- Closing costs
- $7,200
- Reserves months
- —
- Total cash needed
- —
Loan-product check · same deal, 3 products live
Conventional
25% down · 7.5% · 30yr
- Down + closing
- —
- Monthly P&I
- —
- Monthly cashflow
- —
- DSCR
- —
- Eligible?
- —
Personal DTI + credit; lowest rate.
DSCR
20% down · 8.5% · 30yr
- Down + closing
- —
- Monthly P&I
- —
- Monthly cashflow
- —
- DSCR
- —
- Eligible?
- —
No personal income docs; deal must DSCR.
Hard money
10% down · 12.0% · 12mo
- Down + closing
- —
- Monthly P&I
- —
- Monthly cashflow
- —
- DSCR
- —
- Eligible?
- —
Short-term bridge; refi at stabilization.
Listing history 19 events
-
2026-06-19days on market $240,000 Active 77 DOM
-
2026-06-18days on market $240,000 Active 76 DOM
-
2026-06-17days on market $240,000 Active 75 DOM
-
2026-06-16days on market $240,000 Active 74 DOM
-
2026-06-15days on market $240,000 Active 73 DOM
-
2026-06-14days on market $240,000 Active 71 DOM
-
2026-06-12days on market $240,000 Active 70 DOM
-
2026-06-09days on market $240,000 Active 67 DOM
-
2026-06-08days on market $240,000 Active 66 DOM
-
2026-06-07days on market $240,000 Active 65 DOM
-
2026-06-05days on market $240,000 Active 62 DOM
-
2026-06-02days on market $240,000 Active 60 DOM
-
2026-06-01days on market $240,000 Active 59 DOM
-
2026-05-31days on market $240,000 Active 58 DOM
-
2026-05-30days on market $240,000 Active 57 DOM
-
2026-04-03$240,000 Active
-
2025-06-12soldstatus $188,000 Closed
-
2025-05-05status Pending
-
2025-04-29$240,000 Active
ⓘ Source: listings_history table (triggers on properties + properties_extension) + one-shot
backfill from property_details.listing_events for pre-trigger history.
Tax reassessment forecast WA · Resets to sale price
- Current annual tax
- $721 · $60/mo
- Projected year-2 tax
- $2,352 · $196/mo
- Expected delta
- +$1,631/yr (+$136/mo · 226.1%)
ⓘ Screening estimate from a state-policy table — verify with the county assessor before closing.
Climate risk First Street
- Flood 8/10 Severe FEMA zone X (shaded) · 99% chance over 30 yrs
- Wildfire 4/10 Moderate
- Heat 3/10 Moderate 8 d/yr ≥88°F today · 15 d/yr by 30 yrs out
- Wind 1/10 Low
- Air quality 5/10 Major 6 unhealthy d/yr today · 6 by 30 yrs out
Nearby sold comps map
Loading sold comps map…
Walkable amenities ~0.75 mi
Loading nearby amenities…
Taxation est. · year 1
- Rental income
- $27,578
- − Mortgage interest
- −$13,444
- − Property taxes
- −$721
- − Insurance
- −$1,997
- − Repairs & maintenance
- −$2,206
- − Management
- −$2,206
- − Depreciation
- −$6,982
- Taxable income
- $22
- Est. tax owed @ 24.0%
- −$5
- After-tax cash flow
- $3,960/yr
For passive investors: Depreciation is non-cash, so a rental often shows a tax loss while cash-flowing — sheltering income. Rental losses are passive: they offset passive income freely, and up to $25,000/yr can offset ordinary (W-2) income if you actively participate and your MAGI is under $100k (phasing out to $0 by $150k); unused losses carry forward. On sale, claimed depreciation is recaptured at up to 25%, and gains may owe capital-gains tax (a 1031 exchange can defer both). Figures are a year-1 estimate at your 24.0% rate — not tax advice; consult a CPA.
Schools (NCES district)
- District
- Hood Canal School District
- NCES district ID
- 5303600
- Math proficiency
- 25% ▼ -10.00%
- Reading proficiency
- 36% ▲ 4.00%
- Median HH income
- $43,135
- Composite
- 28.76/100
- National rank
- #11998
- State rank
- #267 of 291 in WA
Livability — Skokomish
- Score
- 60/100
- State rank
- #454
- US rank
- #18653
Category grades
Schools grade is shown separately in the Schools card above.
Census & demographics
- County
- Mason County · 40,606 people
- Metro
- Shelton, WA
- Population (ZIP)
- 40,606
- Household income
- $78,610
- Rent vs Own
- Severe rent burden
- 687.0
Population outlook (Mason County) Hauer SSP2
- Today (2025)
- 60,005 people
- By 2030
- 58,567 · -2.4%
- By 2040
- 54,735 · -8.8%
- By 2050
- 51,470 · -14.2%
- By 2075
- 46,276 · -22.9%
- By 2100
- 39,883 · -33.5%
Race, ethnicity, and origin ACS 2023
- Neighborhood character
- Predominantly White (72%)
- Race & ethnicity
- White 72% Hispanic / Latino 15% Two or more races 11% Native American 3%
- Hispanic origin (detail)
- Mexican 8%
- Common ancestry
- Portuguese 4% Slovak 3% Italian 2%
- Foreign-born
- 8% · Canada
- Languages at home
- 88% English-only · Spanish 10%
Political lean MEDSL · Mason
- 2024 margin
- Toss-up / Even · D 47.2% · R 49.7% · Other 3.2%
- 2008→2024 swing
- -11.2pp toward R · 2008: 8.7pp · 2024: -2.5pp
- All cycles
- 2024: R+2.5 2020: R+3.9 2016: R+6.0 2012: D+6.9 2008: D+8.7
Not yet ingested
- Civics
- —
Market trends
- HPI YoY
- ▼ -232.42%
- Current HPI
- 199.0698
- Rent YoY
- —
- Metro
- Shelton, WA
- State GDP YoY
- ▲ 4.65%
- F500 in state
- 22
Industry mix (Fortune 500 HQ in WA)
| Industry | F500 HQs | Revenue |
|---|---|---|
| Retail | 2 | $269B |
|
||
| Technology / Retail | 1 | $638B |
|
||
| Technology | 1 | $245B |
|
||
| Telecommunications | 1 | $38B |
|
||
| Food / Beverage | 1 | $36B |
|
||
| Automotive / Trucks | 1 | $34B |
|
||
Price history
+0.0% since first listed4 events — show timeline
- 2026-04-03 Listed $240,000 NWMLS as Distributed by MLS Grid
- 2025-06-12 Sold (MLS) $188,000 NWMLS as Distributed by MLS Grid
- 2025-05-05 Pending — NWMLS as Distributed by MLS Grid
- 2025-04-29 Listed $240,000 NWMLS as Distributed by MLS Grid
Property tax history
+34.0%/yrLatest (2026): $721 · +28.5% YoY. Source: county tax records.
Cash-flow waterfall
monthlySold comps — $/sqft
last 12 mo · ≤1 miLoading sold comps…