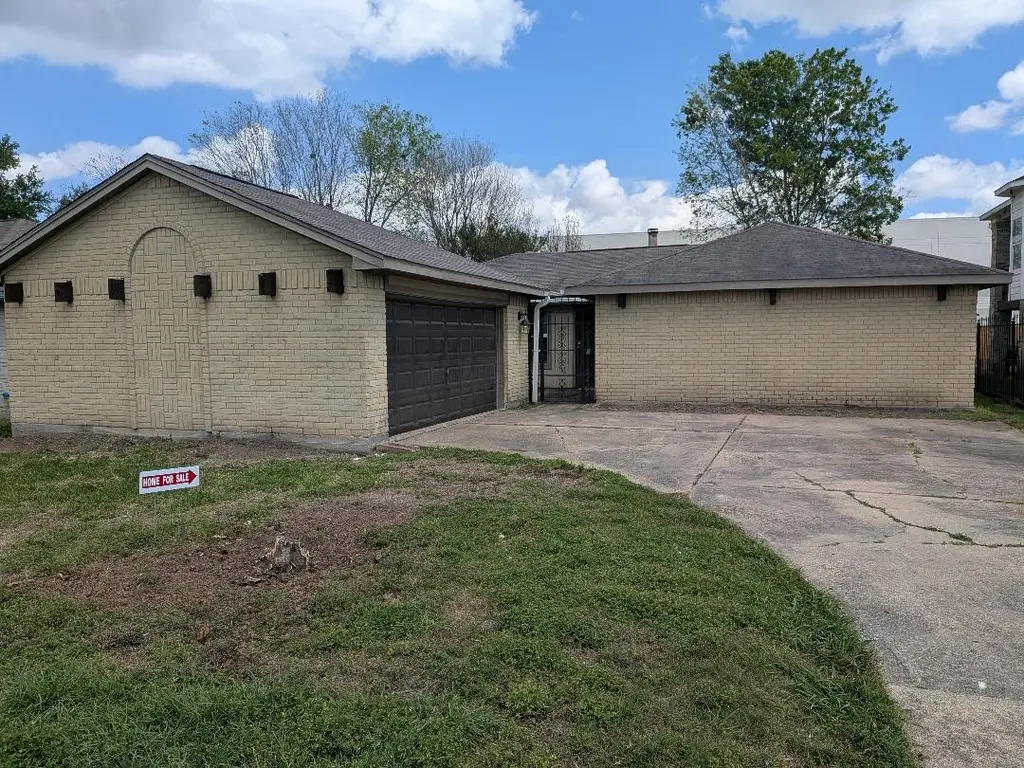
16723 Lone Quail Ct · Houston, TX
Flood risk 5/10 · Moderate
- FEMA flood zone
- X (unshaded)
- Chance of flooding over 30 yrs
- 0.47%
- Est. flood insurance / yr
- $507 – $1,088
Fire risk 4/10 · Minor
- Est. fire insurance / yr
- $1,222 – $2,270
Heat risk 9/10 · Severe
- Hot days now (above 110°F)
- 7 days/yr
- Hot days in 30 yrs
- 23 days/yr
Wind risk 9/10 · Severe
- Chance of severe wind over 30 yrs
- 99.0%
Air-quality risk 3/10 · Minor
- Unhealthy air days now
- 2 days/yr
- Unhealthy air days in 30 yrs
- 3 days/yr
Risk factors via First Street. Map © Google.
Why this score? — see what drove the D grade
The composite is a weighted blend of 9 inputs, each scored 0–100. Each bar is that input's sub-score; the figure is the points it added to the 100-point composite (weight × sub-score).
- Cash flow +11.6/30.0
- ARV discount +6.7/15.0
- Appreciation +4.7/10.0
- Schools +4.5/10.0
- Livability +3.7/5.0
- 1% rule +3.5/10.0
- DSCR +3.4/10.0
- Rent growth +2.6/5.0
- Condition / age +2.5/5.0
$234,000
🖨 Deal sheet (PDF) 📄 Offer letter ✓ Due diligence
Listing remarks MLS
Situated in a charming neighborhood, this lovely residence features 3 bedrooms, 2 bathrooms, and a generous open layout. The kitchen is updated with stainless steel appliances, a new microwave installed 4_19 and granite countertops. Relax in the tranquil backyard with a patio, ideal for outdoor gatherings. The master suite includes a walk-in closet and a private bathroom. With contemporary touches throughout, this home is ready for new occupants. Conveniently located near schools, parks, and shopping, this property offers a comfortable and stylish living space for those in search of a new home.
Key facts
- Tranquil backyard
- Walk-in closet
- Updated kitchen
Tags
Neighborhood map
What this means for you Summary
Snapshot
- This is a 3-bed/2.0-bath single-family listed at $234k.
Deal economics
- At list price, monthly cash flow is $-72 ($-869/yr) — negative.
- To cash-flow at today's rent, offer at most $221k (5.5% below list).
- To meet the 1% rule (rent ≥ 1% of price), the offer needs to be $200k (14.6% below list).
- Recommended offer: $200k (14.6% below list) — sets the bar for 1% rule.
- Cap rate 5.9% vs local median 3.2% in Houston — top-decile yield for the area; either an underpriced asset or a hidden risk that comps aren't pricing in. Stress-test before assuming the spread holds.
Location & tenants
- Location reads 74/100 on livability (#184 in TX, #4,771 nationally) — a middle-class / working-renter tenant base. Strengths: amenities A+, cost of living A+, housing A+; Watch: crime F.
- Fort Bend ISD (suburban): math 44% / reading 53% proficiency, ranked #140 of 826 in TX (top 17%) — families likely to look elsewhere, expect single-tenant / working-renter base with shorter leases.
- Zoned schools: Edgar Glover Jr El (math 42% / reading 37%, grade F, #1,545 of 4,322 statewide, top 38%, 380 students, 87% FRL); Missouri City Middle (math 19% / reading 35%, grade F, #1,177 of 1,662 statewide, top 72%, 963 students, 88% FRL); Fort Bend Co Alter (26 students, 0% FRL) — zoned schools average 58% FRL vs 35% district-wide (24 pts higher); higher-poverty schools than district average — tighter screening recommended.
- Zoned-school proficiency averages 33% at this address vs 48% district-wide (-15 pts) — the specific schools serving this property underperform the Fort Bend ISD average; the district grade overstates school quality for this exact location.
- Market conditions: Rents flat; 188 active listings in the ZIP; 8 comparable units currently listed for rent nearby; rentals at typical pace (median 23d on market — plan ~3-4 weeks tenant-placement turnaround); 12,093 units permitted in Fort Bend County in 2024 (815 in 5+ unit buildings).
- This rent runs 32% of the median local income ($75k/yr) — at the standard rent-burdened threshold; future hikes will face affordability resistance.
Forward outlook
- In year one you build about $328 of equity ($2k loan paydown + $-1k appreciation (-0.6% local appreciation)).
- Fort Bend County population projected at +75% by 2050 — long-run rental-demand tailwind backs the buy-and-hold thesis.
Negotiation context
- It's been on market 82 days — a 6% lower offer ($220k) is reasonable based on typical stale-listing flexibility.
Risks & watch-outs
- Climate carrying-cost: moderate flood risk; severe wind risk, 99% chance of damaging wind over 30y; extreme-heat days projected 7→23/yr by 2055 (HVAC capex compounding) — expect insurance premiums to compound above CPI over the hold.
Questions for the listing agent
- What do current leases actually rent for vs. the listed asking? Can we see a recent rent roll and the last 12 months of T-12 income?
- It's been on market 82 days. Have you received any prior offers? Is the seller open to a 15% concession, seller financing, or rate buy-down credit?
- What does the HOA fee cover, when was the last increase, and are there any pending special assessments or reserve-fund shortfalls?
- Why hasn't it sold? Are there any deal-killer items the seller is aware of (foundation, flood, title, zoning, code violations)?
- Is there a deadline driving the sale (1031 exchange, divorce, estate, relocation)? That informs how much negotiation room exists.
- Schools are D-rated, which usually means shorter tenancies and higher turnover. Who's the typical renter profile here, and what's been the actual vacancy rate?
- Crime grade is F in this area — have there been break-ins, vandalism, or insurance claims at this property in the last 3 years? What carrier currently insures it and at what premium?
- The area grade is low — what's the realistic commute time and amenity access for the typical tenant pool here? Any planned neighborhood developments (good or bad) we should know about?
- What's the average days-on-market for RENTAL listings here right now (not sales)? A rising rental-DOM trend means longer vacancies and softer asking-rent achievability than the comps imply.
- What's the recent tenant-quality profile in this submarket — average credit score on applications, eviction rate, late-payment / NSF rate, and stable-employment percentage? A property-management company in the area should have these aggregated.
- How much new for-sale + rental construction is in the pipeline within 1–3 miles? Heavy new supply typically softens prices + rents 12–24 months out; constrained supply supports both.
Investment metrics
- 1% rule
- 0.85% ✗
- Cap rate
- 5.92%
- Cash-on-cash
- -1.33%
- DSCR
- 0.94
- GRM
- 9.8
CMA / ARV
- ARV (median comp)
- $230,088
- List price
- $234,000
- Delta
- 1.70%
- Verdict
- FAIR
- Comps
- 20 within 1.0 mi
Show comp detail 12 sales within ~0.75 mi
| Address | Dist | Beds/Ba | Sqft | Sold | Price | $/sf | Match |
|---|---|---|---|---|---|---|---|
| 16610 Quail Prairie Dr | 0.22mi | 3/2.0 | 1,644 (-1%) | 4mo | $239,500 | $146 | 85 |
| 16626 Quail Run Dr | 0.22mi | 3/2.0 | 1,644 (-1%) | 6mo | $210,000 | $128 | 82 |
| 16718 Running Quail Ct | 0.42mi | 3/2.0 | 1,686 (+1%) | 1mo | $235,000 | $139 | 77 |
| 8434 Quail Crest Dr | 0.23mi | 3/2.0 | 1,560 (-6%) | 3mo | $239,500 | $154 | 76 |
| 8402 Bird Meadow Ln | 0.44mi | 3/2.0 | 1,664 (+0%) | 6mo | $249,900 | $150 | 74 |
| 16331 Hunting Dog Ct | 0.53mi | 3/2.0 | 1,649 (-1%) | 7mo | $265,000 | $161 | 68 |
| 16614 Quiet Quail Dr | 0.18mi | 4/2.0 (+1) | 1,505 (-9%) | 6mo | $199,999 | $133 | 66 |
| 16711 Running Quail Ct | 0.39mi | 4/2.0 (+1) | 1,500 (-10%) | 3mo | $210,000 | $140 | 58 |
| 8403 Blossom Bell Ln | 0.57mi | 3/2.0 | 1,547 (-7%) | 6mo | $245,000 | $158 | 57 |
| 2507 Rittenmore Dr | 0.69mi | 4/2.0 (+1) | 1,568 (-6%) | 1mo | $235,000 | $150 | 52 |
| 2518 Edgedale Dr | 0.60mi | 3/2.0 | 1,502 (-10%) | 9mo | $209,000 | $139 | 49 |
| 2422 Doverglen Dr | 0.68mi | 4/2.5 (+1) | 1,848 (+11%) | 1mo | $249,000 | $135 | 42 |
Match score weights: distance 35% · size 25% · config 20% · recency 20%. Top-matched comps best support the ARV.
Projected returns pro-forma
-0.55% appreciation · 0.34% rent growth · sell at horizon
- IRR
- -7.8%
- Equity multiple
- 0.65×
- Total profit
- $-22,611
- Equity at exit
- $61,569
- IRR
- -3.6%
- Equity multiple
- 0.67×
- Total profit
- $-21,597
- Equity at exit
- $69,094
Cash invested: $65,520 (down + closing). Projections, not guarantees.
Landlord ↔ Tenant lean methodology
- Overall (STATE)
- 87 Strongly Landlord-Friendly
- State Texas
- 87 Strongly Landlord-Friendly · R+5
- County
- — inherits STATE
- City
- — inherits STATE
ZIP-level market 77489
- Home prices YoY
- -0.2%
- Rents YoY
- 0.3%
- Active inventory
- 188
- Price-to-rent
- 9.8×
Monthly cashflow live
- Estimated rent
- $1,998 high interval (Pro) →
- Mortgage (P&I)
- −$1,227
- Tax from tax record
- −$292 /mo · $3,507/yr
- Insurance
- −$98
- HOA
- −$34
- Vacancy / Maint / Mgmt
- −$420
- Net cashflow
- $-72
Break-even live
Sensitivity live
| Price | -10% $60 | -5% $-6 | +0% $-72 | +5% $-139 | +10% $-205 |
|---|---|---|---|---|---|
| Rent | -10% $-230 | -5% $-151 | +0% $-72 | +5% $6 | +10% $85 |
| Rate | -1.0pp $45 | -0.5pp $-13 | base $-72 | +0.5pp $-133 | +1.0pp $-195 |
UW: 25.0% down · 7.5% · 30yr · 1.5% tax · 5.0% vac · 8.0% maint · 8.0% mgmt
Financing live
Cash to close
- Down payment
- $58,500
- Closing costs
- $7,020
- Reserves months
- —
- Total cash needed
- —
Loan-product check · same deal, 3 products live
Conventional
25% down · 7.5% · 30yr
- Down + closing
- —
- Monthly P&I
- —
- Monthly cashflow
- —
- DSCR
- —
- Eligible?
- —
Personal DTI + credit; lowest rate.
DSCR
20% down · 8.5% · 30yr
- Down + closing
- —
- Monthly P&I
- —
- Monthly cashflow
- —
- DSCR
- —
- Eligible?
- —
No personal income docs; deal must DSCR.
Hard money
10% down · 12.0% · 12mo
- Down + closing
- —
- Monthly P&I
- —
- Monthly cashflow
- —
- DSCR
- —
- Eligible?
- —
Short-term bridge; refi at stabilization.
Rent comps 8 comps
| Address | Beds | Baths | Sqft | Rent | $/sqft | DOM | Units | Dist |
|---|---|---|---|---|---|---|---|---|
| 16310 Setter Ct Missouri City, TX | 3.0 | 2.0 | 1672 | $1,700 | $1.02 | 45d | 1 | 0.51mi |
| 17318 Edgehaven Dr Missouri City, TX | 3.0 | 2.0 | 1448 | $1,695 | $1.17 | 22d | 1 | 0.80mi |
| 712 Beechbend Dr Missouri City, TX | 4.0 | 2.5 | 2245 | $2,250 | $1.00 | 22d | 1 | 0.95mi |
| 15823 Baybriar Dr Missouri City, TX | 3.0 | 2.0 | 1335 | $1,641 | $1.23 | 7d | 1 | 1.06mi |
| 1215 New Tree Ln Missouri City, TX | 3.0 | 2.0 | 1323 | $1,725 | $1.30 | 14d | 1 | 1.09mi |
| 1919 Doliver Cir Missouri City, TX | 3.0 | 2.0 | 1515 | $2,000 | $1.32 | 45d | 1 | 1.18mi |
| 15703 Baybriar Dr Missouri City, TX | 3.0 | 2.0 | 1252 | $1,615 | $1.29 | 21d | 1 | 1.22mi |
| 1806 Courtside Place Dr Missouri City, TX | 4.0 | 2.5 | 1974 | $1,915 | $0.97 | 14d | 1 | 1.38mi |
HOA detail
- Monthly dues
- $34 · $408/yr
Listing history 16 events
-
2026-06-21days on market $234,000 Active 82 DOM
-
2026-06-18days on market $234,000 Active 79 DOM
-
2026-06-17days on market $234,000 Active 78 DOM
-
2026-06-16days on market $234,000 Active 77 DOM
-
2026-06-15days on market $234,000 Active 76 DOM
-
2026-06-13days on market $234,000 Active 74 DOM
-
2026-06-09days on market $234,000 Active 70 DOM
-
2026-06-07days on market $234,000 Active 68 DOM
-
2026-06-04days on market $234,000 Active 65 DOM
-
2026-06-03days on market $234,000 Active 64 DOM
-
2026-06-02days on market $234,000 Active 63 DOM
-
2026-06-01days on market $234,000 Active 62 DOM
-
2026-05-31days on market $234,000 Active 61 DOM
-
2026-04-25price $234,000 601-char remark
Show marketing remark (601 chars)
Situated in a charming neighborhood, this lovely residence features 3 bedrooms, 2 bathrooms, and a generous open layout. The kitchen is updated with stainless steel appliances, a new microwave installed 4_19 and granite countertops. Relax in the tranquil backyard with a patio, ideal for outdoor gatherings. The master suite includes a walk-in closet and a private bathroom. With contemporary touches throughout, this home is ready for new occupants. Conveniently located near schools, parks, and shopping, this property offers a comfortable and stylish living space for those in search of a new home.
-
2026-03-31$239,900 Active 601-char remark
Show marketing remark (601 chars)
Situated in a charming neighborhood, this lovely residence features 3 bedrooms, 2 bathrooms, and a generous open layout. The kitchen is updated with stainless steel appliances, a new microwave installed 4_19 and granite countertops. Relax in the tranquil backyard with a patio, ideal for outdoor gatherings. The master suite includes a walk-in closet and a private bathroom. With contemporary touches throughout, this home is ready for new occupants. Conveniently located near schools, parks, and shopping, this property offers a comfortable and stylish living space for those in search of a new home.
-
2000-07-07soldstatus
ⓘ Source: listings_history table (triggers on properties + properties_extension) + one-shot
backfill from property_details.listing_events for pre-trigger history.
Tax reassessment forecast TX · Resets to sale price
- Current annual tax
- $3,507 · $292/mo
- Projected year-2 tax
- $4,282 · $357/mo
- Expected delta
- +$776/yr (+$65/mo · 22.1%)
ⓘ Screening estimate from a state-policy table — verify with the county assessor before closing.
Climate risk First Street
- Flood 5/10 Major FEMA zone X (unshaded) · 47% chance over 30 yrs
- Wildfire 4/10 Moderate
- Heat 9/10 Extreme 7 d/yr ≥110°F today · 23 d/yr by 30 yrs out
- Wind 9/10 Extreme 99% chance of damaging wind over 30 yrs
- Air quality 3/10 Moderate 2 unhealthy d/yr today · 3 by 30 yrs out
Nearby sold comps map
Loading sold comps map…
Walkable amenities ~0.75 mi
Loading nearby amenities…
Taxation est. · year 1
- Rental income
- $23,976
- − Mortgage interest
- −$13,108
- − Property taxes
- −$3,507
- − Insurance
- −$1,170
- − Repairs & maintenance
- −$1,918
- − Management
- −$1,918
- − HOA
- −$408
- − Depreciation
- −$6,807
- Taxable loss
- −$4,860
- Est. tax savings @ 24.0%
- +$1,166
- After-tax cash flow
- $297/yr
For passive investors: Depreciation is non-cash, so a rental often shows a tax loss while cash-flowing — sheltering income. Rental losses are passive: they offset passive income freely, and up to $25,000/yr can offset ordinary (W-2) income if you actively participate and your MAGI is under $100k (phasing out to $0 by $150k); unused losses carry forward. On sale, claimed depreciation is recaptured at up to 25%, and gains may owe capital-gains tax (a 1031 exchange can defer both). Figures are a year-1 estimate at your 24.0% rate — not tax advice; consult a CPA.
Schools (NCES district)
- District
- Fort Bend ISD
- NCES district ID
- 4819650
- Math proficiency
- 44% ▼ -15.00%
- Reading proficiency
- 53% ▼ -4.00%
- Median HH income
- $82,360
- Composite
- 44.61/100
- National rank
- #2779
- State rank
- #140 of 826 in TX
Livability — Houston
- Score
- 74/100
- State rank
- #184
- US rank
- #4771
Category grades
Schools grade is shown separately in the Schools card above.
Census & demographics
- Census place
- Houston, TX
- County
- Fort Bend County · 836,777 people
- City population
- 3,226,434
- Metro
- Houston-The Woodlands-Sugar Land, TX
- Population (ZIP)
- 39,292
- Household income
- $74,689
- Rent vs Own
- Severe rent burden
- 1121.0
Population outlook (Fort Bend County) Hauer SSP2
- Today (2025)
- 1,004,526 people
- By 2030
- 1,153,104 · +14.8%
- By 2040
- 1,453,718 · +44.7%
- By 2050
- 1,753,781 · +74.6%
- By 2075
- 2,455,772 · +144.5%
- By 2100
- 2,930,528 · +191.7%
Race, ethnicity, and origin ACS 2023
- Neighborhood character
- Majority Black (60%)
- Race & ethnicity
- Black 60% Hispanic / Latino 29% Two or more races 13% White 4% Asian 3%
- Hispanic origin (detail)
- Mexican 17%
- Foreign-born
- 16% · Canada, Vietnam
- Languages at home
- 73% English-only · Spanish 22% Vietnamese 1% Other Asian/Pacific 1%
Political lean MEDSL · Fort Bend
- 2024 margin
- Toss-up / Even · D 49.5% · R 47.9% · Other 2.6%
- 2008→2024 swing
- +4.0pp toward D · 2008: -2.4pp · 2024: 1.6pp
- All cycles
- 2024: D+1.6 2020: D+10.6 2016: D+6.6 2012: R+6.8 2008: R+2.4
Not yet ingested
- Civics
- —
Market trends
- HPI YoY
- ▼ -0.55%
- Current HPI
- 288.1306
- Rent YoY
- ▲ 0.34%
- Metro
- Houston-The Woodlands-Sugar Land, TX
- State GDP YoY
- ▲ 3.95%
- F500 in state
- 110
Industry mix (Fortune 500 HQ in TX)
| Industry | F500 HQs | Revenue |
|---|---|---|
| Energy | 16 | $1,198B |
|
||
| Technology | 5 | $198B |
|
||
| Engineering / Construction | 4 | $72B |
|
||
| Energy Services | 3 | $60B |
|
||
| Utilities | 3 | $41B |
|
||
| Healthcare | 2 | $330B |
|
||
Price history
-2.5% since first listed3 events — show timeline
- 2026-04-25 Price Changed $234,000 HARMLS
- 2026-03-31 Listed $239,900 HARMLS
- 2000-07-07 Sold (Public Records) — Public Records
Property tax history
+2.4%/yrLatest (2025): $3,507 · +14.0% YoY. Source: county tax records.
Cash-flow waterfall
monthlySold comps — $/sqft
last 12 mo · ≤1 miLoading sold comps…