 Multi-family
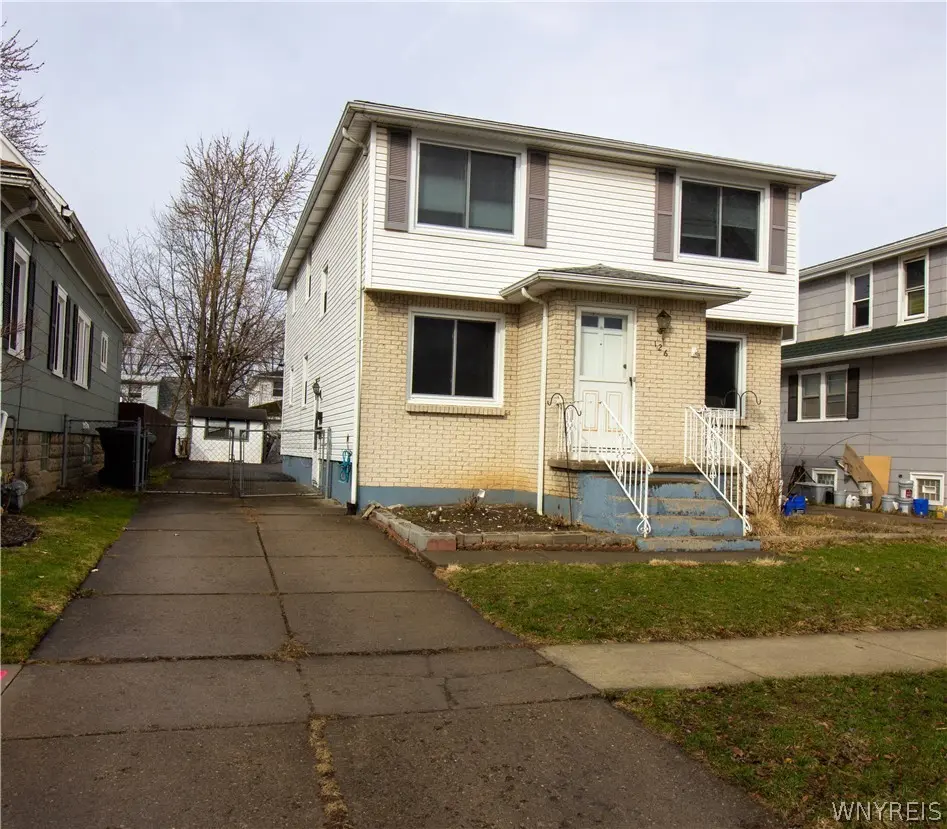
126 Grandview Ave · Tonawanda Town, NY
Flood risk 1/10 · Minimal
- FEMA flood zone
- X (unshaded)
- Chance of flooding over 30 yrs
- 0.0%
- Est. flood insurance / yr
- $473 – $860
Fire risk 1/10 · Minimal
- Est. fire insurance / yr
- $691 – $1,283
Heat risk 3/10 · Minor
- Hot days now (above 92°F)
- 7 days/yr
- Hot days in 30 yrs
- 15 days/yr
Wind risk 1/10 · Minimal
- Chance of severe wind over 30 yrs
- —
Air-quality risk 3/10 · Minor
- Unhealthy air days now
- 2 days/yr
- Unhealthy air days in 30 yrs
- 3 days/yr
Risk factors via First Street. Map © Google.
Why this score? — see what drove the C grade
The composite is a weighted blend of 9 inputs, each scored 0–100. Each bar is that input's sub-score; the figure is the points it added to the 100-point composite (weight × sub-score).
- Cash flow +21.2/30.0
- ARV discount +12.7/15.0
- 1% rule +6.9/10.0
- DSCR +6.8/10.0
- Schools +3.9/10.0
- Rent growth +2.5/5.0
- Livability +2.5/5.0
- Condition / age +2.5/5.0
- Appreciation +0.0/10.0
$279,999
🖨 Deal sheet (PDF) 📄 Offer letter ✓ Due diligence
Multi-family units
County records classify this as Multi-Family (2-4 Unit). Listing-text estimate: 1 unit. estimate disagrees with records
Listing remarks MLS
Beautiful 3/3 double! Features hardwood floors thru-out, upstairs with open floor plan, LR / DR combos, newer light fixtures, lower updated bath w/ pedestal sink, fully applianced, vinyl sided, good closet space, good size rooms, poured basement walls, both furnaces updated 1-12/2018 and other approx 6 years old, circuit breakers, copper plumbing, 1 semi finished room in basement. .. perfect for the owner occupied 1 great house!
Key facts
- Open floor plan
- Kitchen appliances
- Updated furnaces
Tags
Neighborhood map
What this means for you Summary
Snapshot
- This is a 6-bed/2.0-bath multifamily listed at $280k.
Deal economics
- At list price, monthly cash flow is $406 ($5k/yr) — positive.
- The deal already cash-flows at list — no discount required.
- Meets the 1% rule at list price ($3k rent vs $280k).
- Cap rate 8.0% vs local median 4.1% in Tonawanda Town — top-decile yield for the area; either an underpriced asset or a hidden risk that comps aren't pricing in. Stress-test before assuming the spread holds.
Location & tenants
- Location reads: area grade C — affects rentability + tenant quality, not the cash-flow math above.
- Kenmore-Tonawanda Union Free School District (suburban): math 44% / reading 47% proficiency, ranked #453 of 590 in NY (top 77%) — families likely to look elsewhere, expect single-tenant / working-renter base with shorter leases.
- Market conditions: 119 active listings in the ZIP; 11 comparable units currently listed for rent nearby; rentals at typical pace (median 15d on market — plan ~3-4 weeks tenant-placement turnaround); solid renter incomes; 1,244 units permitted in Erie County in 2024 (563 in 5+ unit buildings).
- At $3,320/mo this rent would consume 47% of the median local household income ($84k/yr) (locally 368% of renters already pay >50% of income on rent) — very limited rent-growth headroom before tenants either downsize or default.
Forward outlook
- Local home prices are declining (-3.0%/yr); year-one equity from $2k of loan paydown is wiped out by about $8k of value loss. Plan a longer hold.
Negotiation context
- Only 8 days on market — expect competitive offers; lowballing is unlikely to land.
- 2 sale attempts since 7y ago with the ask held roughly flat each time — persistent listings suggest the price (not the market) is what's stuck; bring a comps-based counter.
- Current owner paid $193k; 45% above their basis — modest negotiation headroom, anchor on the comps not their cost.
Risks & watch-outs
- Watch-outs: property tax is 2.7% of price.
Questions for the listing agent
- Built in 1964 — when were the roof, HVAC, electrical panel, plumbing, and water heater last replaced?
- Property tax is high relative to price — has the assessment been appealed recently, and will the sale trigger a re-assessment?
- Is there a deadline driving the sale (1031 exchange, divorce, estate, relocation)? That informs how much negotiation room exists.
- What's the average days-on-market for RENTAL listings here right now (not sales)? A rising rental-DOM trend means longer vacancies and softer asking-rent achievability than the comps imply.
- What's the recent tenant-quality profile in this submarket — average credit score on applications, eviction rate, late-payment / NSF rate, and stable-employment percentage? A property-management company in the area should have these aggregated.
- How much new apartment / multifamily construction is in the pipeline within 1–3 miles? Heavy new supply (>2% of stock underway) typically softens rents 12–24 months out; light construction supports rent growth.
Investment metrics
- 1% rule
- 1.19% ✓
- Cap rate
- 8.03%
- Cash-on-cash
- 6.21%
- DSCR
- 1.28
- GRM
- 7.0
CMA / ARV
- ARV (on-the-fly)
- $316,968
- Comps found
- 7
Show comp detail 7 sales within ~0.75 mi
| Address | Dist | Beds/Ba | Sqft | Sold | Price | $/sf | Match |
|---|---|---|---|---|---|---|---|
| 20 Hawthorne Ave | 0.21mi | 6/2.0 | 2,208 (-2%) | 11mo | $312,000 | $141 | 78 |
| 300 Windermere Blvd | 0.36mi | 6/2.0 | 2,325 (+3%) | 2mo | $355,000 | $153 | 76 |
| 150 Englewood Ave | 0.50mi | 6/2.0 | 2,239 (-0%) | 5mo | $338,000 | $151 | 71 |
| 157 Springville Ave | 0.49mi | 5/2.0 (-1) | 2,292 (+2%) | 13mo | $300,000 | $131 | 58 |
| 235 Heath St | 0.57mi | 6/2.0 | 2,058 (-8%) | 10mo | $303,000 | $147 | 50 |
| 1 Emsworth Ave | 0.22mi | 5/3.0 (-1) | 2,482 (+10%) | 17mo | $250,000 | $101 | 49 |
| 116 Nicholson St | 0.62mi | 6/2.0 | 2,464 (+10%) | 13mo | $151,000 | $61 | 45 |
Match score weights: distance 35% · size 25% · config 20% · recency 20%. Top-matched comps best support the ARV.
Projected returns pro-forma
-3.0% appreciation · 3.0% rent growth · sell at horizon
- IRR
- -6.6%
- Equity multiple
- 0.75×
- Total profit
- $-19,301
- Equity at exit
- $41,749
- IRR
- 3.1%
- Equity multiple
- 1.22×
- Total profit
- $17,383
- Equity at exit
- $24,209
Cash invested: $78,400 (down + closing). Projections, not guarantees.
Landlord ↔ Tenant lean methodology
- Overall (STATE)
- 15 Strongly Tenant-Friendly
- State New York
- 15 Strongly Tenant-Friendly · D+10
- County
- — inherits STATE
- City
- — inherits STATE
ZIP-level market 14223
- Active inventory
- 119
- Price-to-rent
- 14.1×
Monthly cashflow live
- Estimated rent
- $3,320 high interval (Pro) →
- Mortgage (P&I)
- −$1,468
- Tax from tax record
- −$632 /mo · $7,584/yr
- Insurance
- −$117
- HOA
- −$0
- Vacancy / Maint / Mgmt
- −$697
- Net cashflow
- $406
Break-even live
Sensitivity live
| Price | -10% $564 | -5% $485 | +0% $406 | +5% $327 | +10% $247 |
|---|---|---|---|---|---|
| Rent | -10% $144 | -5% $275 | +0% $406 | +5% $537 | +10% $668 |
| Rate | -1.0pp $547 | -0.5pp $477 | base $406 | +0.5pp $333 | +1.0pp $259 |
2-unit breakdown (identical units grouped — click to expand)
| Units | Beds | Baths | Est. rent |
|---|---|---|---|
| 2× units | 3 | 1.5 | $3,320 |
| #1 | 3 | 1.5 | $1,660 |
| #2 | 3 | 1.5 | $1,660 |
| Total (2 units) | $3,320 | ||
UW: 25.0% down · 7.5% · 30yr · 1.5% tax · 5.0% vac · 8.0% maint · 8.0% mgmt
Financing live
Cash to close
- Down payment
- $70,000
- Closing costs
- $8,400
- Reserves months
- —
- Total cash needed
- —
Loan-product check · same deal, 3 products live
Conventional
25% down · 7.5% · 30yr
- Down + closing
- —
- Monthly P&I
- —
- Monthly cashflow
- —
- DSCR
- —
- Eligible?
- —
Personal DTI + credit; lowest rate.
DSCR
20% down · 8.5% · 30yr
- Down + closing
- —
- Monthly P&I
- —
- Monthly cashflow
- —
- DSCR
- —
- Eligible?
- —
No personal income docs; deal must DSCR.
Hard money
10% down · 12.0% · 12mo
- Down + closing
- —
- Monthly P&I
- —
- Monthly cashflow
- —
- DSCR
- —
- Eligible?
- —
Short-term bridge; refi at stabilization.
Rent comps 11 comps
| Address | Beds | Baths | Sqft | Rent | $/sqft | DOM | Units | Dist |
|---|---|---|---|---|---|---|---|---|
| 80 Capen Blvd Buffalo, NY | 5.0 | 2.5 | 2591 | $2,800 | $1.08 | 2d | 1 | 0.31mi |
| 64 Montrose Ave Buffalo, NY | 7.0 | 1.5 | 1512 | $2,700 | $1.79 | 44d | 1 | 0.45mi |
| 64 Montrose Ave Buffalo, NY | 7.0 | 1.5 | 1512 | $2,500 | $1.65 | 2d | 1 | 0.45mi |
| 196 Englewood Ave Buffalo, NY | 5.0 | 1.5 | 2560 | $2,000 | $0.78 | 2d | 1 | 0.50mi |
| 133 Merrimac St Buffalo, NY | 7.0 | 2.0 | 2327 | $4,450 | $1.91 | 15d | 1 | 0.60mi |
| 4098 Bailey Ave Buffalo, NY | 5.0 | 2.5 | 2108 | $2,200 | $1.04 | 44d | 1 | 0.64mi |
| 24 Custer St Buffalo, NY | 5.0 | 2.0 | 2500 | $3,000 | $1.20 | 15d | 1 | 0.85mi |
| 65 Northrup Pl Buffalo, NY | 5.0 | 2.0 | 1467 | $2,500 | $1.70 | 15d | 1 | 0.85mi |
| 85 Highgate Ave Buffalo, NY | 5.0 | 2.0 | 2193 | $3,750 | $1.71 | 15d | 1 | 0.91mi |
| 175 Lisbon Ave Buffalo, NY | 5.0 | 2.0 | 2000 | $2,500 | $1.25 | 15d | 1 | 1.01mi |
| 145 Minnesota Ave Buffalo, NY | 7.0 | 2.0 | 2551 | $4,900 | $1.92 | 15d | 1 | 1.07mi |
Listing history 7 events
-
2026-04-02status Pending
-
2026-03-25$279,999 Active
-
2019-06-10soldstatus $193,000 Closed Sale or Rented 432-char remark
Show marketing remark (432 chars)
Beautiful 3/3 double! Features hardwood floors thru-out, upstairs with open floor plan, LR / DR combos, newer light fixtures, lower updated bath w/ pedestal sink, fully applianced, vinyl sided, good closet space, good size rooms, poured basement walls, both furnaces updated 1-12/2018 and other approx 6 years old, circuit breakers, copper plumbing, 1 semi finished room in basement. .. perfect for the owner occupied 1 great house!
-
2019-05-31soldstatus $193,000
-
2019-03-29status Pending Sale 432-char remark
Show marketing remark (432 chars)
Beautiful 3/3 double! Features hardwood floors thru-out, upstairs with open floor plan, LR / DR combos, newer light fixtures, lower updated bath w/ pedestal sink, fully applianced, vinyl sided, good closet space, good size rooms, poured basement walls, both furnaces updated 1-12/2018 and other approx 6 years old, circuit breakers, copper plumbing, 1 semi finished room in basement. .. perfect for the owner occupied 1 great house!
-
2019-03-06$179,900 Active 432-char remark
Show marketing remark (432 chars)
Beautiful 3/3 double! Features hardwood floors thru-out, upstairs with open floor plan, LR / DR combos, newer light fixtures, lower updated bath w/ pedestal sink, fully applianced, vinyl sided, good closet space, good size rooms, poured basement walls, both furnaces updated 1-12/2018 and other approx 6 years old, circuit breakers, copper plumbing, 1 semi finished room in basement. .. perfect for the owner occupied 1 great house!
-
2005-09-30soldstatus $105,000
ⓘ Source: listings_history table (triggers on properties + properties_extension) + one-shot
backfill from property_details.listing_events for pre-trigger history.
Tax reassessment forecast NY · Partial reset (capped growth)
- Current annual tax
- $7,584 · $632/mo
- Projected year-2 tax
- $7,584 · $632/mo
- Expected delta
- $0/yr ($0/mo · 0.0%)
ⓘ Screening estimate from a state-policy table — verify with the county assessor before closing.
Climate risk First Street
- Flood 1/10 Low FEMA zone X (unshaded) · 0% chance over 30 yrs
- Wildfire 1/10 Low
- Heat 3/10 Moderate 7 d/yr ≥92°F today · 15 d/yr by 30 yrs out
- Wind 1/10 Low
- Air quality 3/10 Moderate 2 unhealthy d/yr today · 3 by 30 yrs out
Nearby sold comps map
Loading sold comps map…
Walkable amenities ~0.75 mi
Loading nearby amenities…
Taxation est. · year 1
- Rental income
- $39,840
- − Mortgage interest
- −$15,684
- − Property taxes
- −$7,584
- − Insurance
- −$1,400
- − Repairs & maintenance
- −$3,187
- − Management
- −$3,187
- − Depreciation
- −$8,145
- Taxable income
- $652
- Est. tax owed @ 24.0%
- −$157
- After-tax cash flow
- $4,713/yr
For passive investors: Depreciation is non-cash, so a rental often shows a tax loss while cash-flowing — sheltering income. Rental losses are passive: they offset passive income freely, and up to $25,000/yr can offset ordinary (W-2) income if you actively participate and your MAGI is under $100k (phasing out to $0 by $150k); unused losses carry forward. On sale, claimed depreciation is recaptured at up to 25%, and gains may owe capital-gains tax (a 1031 exchange can defer both). Figures are a year-1 estimate at your 24.0% rate — not tax advice; consult a CPA.
Schools (NCES district)
- District
- Kenmore-Tonawanda Union Free School District
- NCES district ID
- 3616230
- Math proficiency
- 44% ▼ -12.00%
- Reading proficiency
- 47% ▼ -1.00%
- Median HH income
- $51,433
- Composite
- 39.18/100
- National rank
- #4024
- State rank
- #453 of 590 in NY
Livability — Tonawanda Town
No livability data for this city. (Only ~50 U.S. cities are tracked.)
Census & demographics
- Census place
- Tonawanda Town, NY
- County
- Erie County · 714,559 people
- City population
- 63,948
- Metro
- Buffalo-Cheektowaga, NY
- Population (ZIP)
- 22,611
- Household income
- $84,161
- Rent vs Own
- Severe rent burden
- 368.0
Population outlook (Erie County) Hauer SSP2
- Today (2025)
- 933,037 people
- By 2030
- 935,181 · +0.2%
- By 2040
- 928,531 · -0.5%
- By 2050
- 905,725 · -2.9%
- By 2075
- 834,037 · -10.6%
- By 2100
- 708,033 · -24.1%
Race, ethnicity, and origin ACS 2023
- Neighborhood character
- Predominantly White (84%)
- Race & ethnicity
- White 84% Asian 5% Two or more races 4% Black 4% Hispanic / Latino 3%
- Common ancestry
- Romanian 12% Slovak 2% Lithuanian 2%
- Foreign-born
- 7% · Canada, Vietnam, India
- Languages at home
- 92% English-only · Other Indo-European 3% French/Haitian/Cajun 1% Arabic 1%
Political lean MEDSL · Erie
- 2024 margin
- Lean D (+9.7) · D 54.8% · R 45.2%
- 2008→2024 swing
- -7.9pp toward R · 2008: 17.5pp · 2024: 9.7pp
- All cycles
- 2024: D+9.7 2020: D+14.7 2016: D+4.8 2012: D+15.6 2008: D+17.5
Not yet ingested
- Civics
- —
Market trends
- HPI YoY
- ▼ -245.18%
- Current HPI
- 320.9379
- Rent YoY
- —
- Metro
- Buffalo-Cheektowaga, NY
- State GDP YoY
- ▲ 2.60%
- F500 in state
- 92
Industry mix (Fortune 500 HQ in NY)
| Industry | F500 HQs | Revenue |
|---|---|---|
| Financial Services | 10 | $950B |
|
||
| Consumer Goods | 9 | $162B |
|
||
| Insurance | 4 | $225B |
|
||
| Telecommunications | 2 | $144B |
|
||
| Pharmaceuticals | 2 | $112B |
|
||
| Media / Entertainment | 2 | $69B |
|
||
Price history
+166.7% since first listed7 events — show timeline
- 2026-04-02 Pending — WNYREIS
- 2026-03-25 Listed $279,999 WNYREIS
- 2019-06-10 Sold (MLS) $193,000 WNYREIS
- 2019-05-31 Sold (Public Records) $193,000 Public Records
- 2019-03-29 Pending — WNYREIS
- 2019-03-06 Listed $179,900 WNYREIS
- 2005-09-30 Sold (Public Records) $105,000 Public Records
Property tax history
+3.8%/yrLatest (2025): $7,584 · +1.1% YoY. Source: county tax records.
Cash-flow waterfall
monthlySold comps — $/sqft
last 12 mo · ≤1 miLoading sold comps…