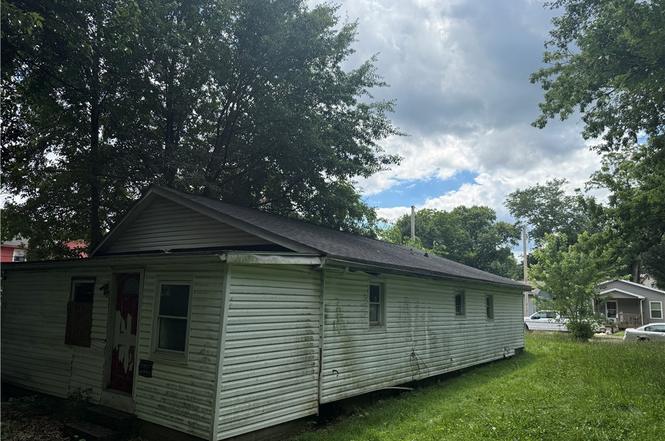
326 Mead St · Zanesville, OH
Flood risk 1/10 · Minimal
- FEMA flood zone
- X (unshaded)
- Chance of flooding over 30 yrs
- 0.0%
- Est. flood insurance / yr
- $473 – $860
Fire risk 1/10 · Minimal
- Est. fire insurance / yr
- $713 – $1,323
Heat risk 4/10 · Minor
- Hot days now (above 98°F)
- 7 days/yr
- Hot days in 30 yrs
- 18 days/yr
Wind risk 2/10 · Minimal
- Chance of severe wind over 30 yrs
- 0.0%
Air-quality risk 2/10 · Minimal
- Unhealthy air days now
- 0 days/yr
- Unhealthy air days in 30 yrs
- 1 days/yr
Risk factors via First Street. Map © Google.
Why this score? — see what drove the B- grade
The composite is a weighted blend of 9 inputs, each scored 0–100. Each bar is that input's sub-score; the figure is the points it added to the 100-point composite (weight × sub-score).
- Cash flow +30.0/30.0
- 1% rule +10.0/10.0
- DSCR +10.0/10.0
- ARV discount +7.5/15.0
- Livability +3.7/5.0
- Rent growth +3.6/5.0
- Schools +2.7/10.0
- Condition / age +2.5/5.0
- Appreciation +0.0/10.0
$39,900
🖨 Deal sheet 📄 Offer letter ✓ Due diligence
Listing remarks MLS
Investor Opportunity! This approximately 1,300 sq. ft. home offers tremendous potential for the savvy investor. Currently configured as a 2-bedroom property, the layout lends itself well to a conversion into a desirable 3-bedroom, 2-bath home. Whether you're looking for your next fix-and-flip project or a long-term rental investment, this property provides an excellent opportunity to add value and maximize returns. Bring your vision and transform this property into its full potential!
Key facts
- 0.29 acre lot
- Built 1901
Property features AI
Exterior
- Parking: On-street parking
- Utilities: Public water; Public sewer
- Home design: Single-story home; Shingle roof; Vinyl siding
- Construction: Built per public records; Block foundation
- Exterior features: Lot approximately 0.294 acres
Interior
- Bedrooms: 2 bedrooms on the main level
- Bathrooms: 1 full bathroom (on the main level)
- Heating & cooling: Forced air heating; Gas heating
- Interior features: 5 total rooms; Basement with storage space
Neighborhood map
What this means for you Summary
Snapshot
- This is a 2-bed/1.0-bath single-family listed at $40k.
Deal economics
- At list price, monthly cash flow is $583 ($7k/yr) — positive.
- The deal already cash-flows at list — no discount required.
- Meets the 1% rule at list price ($1k rent vs $40k).
- Cap rate 23.8% vs local median 3.3% in Zanesville — top-decile yield for the area; either an underpriced asset or a hidden risk that comps aren't pricing in. Stress-test before assuming the spread holds.
Location & tenants
- Location reads 74/100 on livability (#290 in OH, #4,764 nationally) — a middle-class / working-renter tenant base. Strengths: cost of living A+, housing A+, health & safety A+; Watch: schools C-, crime D, commute F.
- Zanesville City (town): math 29% / reading 38% proficiency, ranked #570 of 656 in OH (top 87%) — families likely to look elsewhere, expect single-tenant / working-renter base with shorter leases; 73% free/reduced lunch — lower-income household profile, screen leases tightly.
- Market conditions: Rents rising fast (+4.2%/yr); 299 active listings in the ZIP; 140 units permitted in Muskingum County in 2024 (100 in 5+ unit buildings).
Forward outlook
- Local home prices are declining (-3.0%/yr); year-one equity from $276 of loan paydown is wiped out by about $1k of value loss. Plan a longer hold.
- Muskingum County population projected at -10% by 2050 — secular population decline; favor cash flow + early exit over multi-decade hold.
- At projected returns (-3.0% appreciation + 4.2% rent growth), your $11k cash investment doubles in ~2 years — after that, you're playing with house money.
Negotiation context
- Only 2 days on market — expect competitive offers; lowballing is unlikely to land.
- 3 sale attempts since 10y ago with the ask held roughly flat each time — persistent listings suggest the price (not the market) is what's stuck; bring a comps-based counter.
Risks & watch-outs
- Watch-outs: property tax is 2.5% of price; built in 1901 — expect roof / HVAC / electrical / plumbing capex.
Questions for the listing agent
- Built in 1901 — when were the roof, HVAC, electrical panel, plumbing, and water heater last replaced?
- Property tax is high relative to price — has the assessment been appealed recently, and will the sale trigger a re-assessment?
- Is there a deadline driving the sale (1031 exchange, divorce, estate, relocation)? That informs how much negotiation room exists.
- Crime grade is D in this area — have there been break-ins, vandalism, or insurance claims at this property in the last 3 years? What carrier currently insures it and at what premium?
- What's the average days-on-market for RENTAL listings here right now (not sales)? A rising rental-DOM trend means longer vacancies and softer asking-rent achievability than the comps imply.
- What's the recent tenant-quality profile in this submarket — average credit score on applications, eviction rate, late-payment / NSF rate, and stable-employment percentage? A property-management company in the area should have these aggregated.
- How much new for-sale + rental construction is in the pipeline within 1–3 miles? Heavy new supply typically softens prices + rents 12–24 months out; constrained supply supports both.
Investment metrics
- 1% rule
- 2.83% ✓
- Cap rate
- 23.82%
- Cash-on-cash
- 62.60%
- DSCR
- 3.79
- GRM
- 2.9
CMA / ARV
- ARV (on-the-fly)
- $155,714
- Comps found
- 12
Show comp detail 12 sales within ~0.75 mi
| Address | Dist | Beds/Ba | Sqft | Sold | Price | $/sf | Match |
|---|---|---|---|---|---|---|---|
| 349 Schaum Ave | 0.35mi | 2/1.0 | 1,408 (+2%) | 3mo | $35,000 | $25 | 77 |
| 1305 Ridge Ave | 0.10mi | 3/1.0 (+1) | 1,466 (+6%) | 4mo | $119,000 | $81 | 76 |
| 384 Stewart St | 0.40mi | 3/1.0 (+1) | 1,370 (-1%) | 7mo | $136,900 | $100 | 69 |
| 338 Luck Ave | 0.29mi | 3/2.0 (+1) | 1,456 (+6%) | 3mo | $195,000 | $134 | 66 |
| 428 Gray St | 0.22mi | 2/1.0 | 1,202 (-13%) | 7mo | $24,000 | $20 | 62 |
| 736 Homewood Ave | 0.52mi | 3/2.0 (+1) | 1,400 (+2%) | 6mo | $156,000 | $111 | 59 |
| 607 Larzelere Ave | 0.42mi | 3/— (+1) | 1,232 (-11%) | 10mo | $202,700 | $165 | 50 |
| 752 Larzelere Ave | 0.56mi | 3/1.5 (+1) | 1,240 (-10%) | 1mo | $181,000 | $146 | 49 |
| 730 Homewood Ave | 0.51mi | 3/1.5 (+1) | 1,536 (+12%) | 2mo | $190,000 | $124 | 48 |
| 1621 State St | 0.41mi | 3/1.5 (+1) | 1,200 (-13%) | 8mo | $135,000 | $113 | 46 |
| 16 Beech Rock Dr | 0.58mi | 3/2.0 (+1) | 1,491 (+8%) | 7mo | $196,000 | $131 | 44 |
| 215 Gant St | 0.67mi | 3/1.0 (+1) | 1,516 (+10%) | 9mo | $155,000 | $102 | 39 |
Match score weights: distance 35% · size 25% · config 20% · recency 20%. Top-matched comps best support the ARV.
Projected returns pro-forma
-3.0% appreciation · 4.23% rent growth · sell at horizon
- IRR
- 63.0%
- Equity multiple
- 3.87×
- Total profit
- $32,109
- Equity at exit
- $5,949
- IRR
- 68.0%
- Equity multiple
- 8.33×
- Total profit
- $81,875
- Equity at exit
- $3,450
Cash invested: $11,172 (down + closing). Projections, not guarantees.
Landlord ↔ Tenant lean methodology
- Overall (STATE)
- 73 Landlord-Friendly
- State Ohio
- 73 Landlord-Friendly · R+6
- County
- — inherits STATE
- City
- — inherits STATE
ZIP-level market 43701
- Home prices YoY
- -23.2%
- Rents YoY
- 4.2%
- Active inventory
- 299
- Price-to-rent
- 2.9×
Monthly cashflow live
- Estimated rent
- $1,131 medium interval (Pro) →
- Mortgage (P&I)
- −$209
- Tax from tax record
- −$85 /mo · $1,017/yr
- Insurance
- −$17
- HOA
- −$0
- Vacancy / Maint / Mgmt
- −$237
- Net cashflow
- $583
Break-even live
UW: 25.0% down · 7.5% · 30yr · 1.5% tax · 5.0% vac · 8.0% maint · 8.0% mgmt
Financing live
Cash to close
- Down payment
- $9,975
- Closing costs
- $1,197
- Reserves months
- —
- Total cash needed
- —
Loan-product check · same deal, 3 products live
Conventional
25% down · 7.5% · 30yr
- Down + closing
- —
- Monthly P&I
- —
- Monthly cashflow
- —
- DSCR
- —
- Eligible?
- —
Personal DTI + credit; lowest rate.
DSCR
20% down · 8.5% · 30yr
- Down + closing
- —
- Monthly P&I
- —
- Monthly cashflow
- —
- DSCR
- —
- Eligible?
- —
No personal income docs; deal must DSCR.
Hard money
10% down · 12.0% · 12mo
- Down + closing
- —
- Monthly P&I
- —
- Monthly cashflow
- —
- DSCR
- —
- Eligible?
- —
Short-term bridge; refi at stabilization.
Listing history 4 events
-
2026-06-19days on market $39,900 Active 2 DOM
-
2026-06-17$39,900 Active 1 DOM
-
2026-06-17remarks 489-char remark
-
2026-06-17$39,900 Active 1 DOM
ⓘ Source: listings_history table (triggers on properties + properties_extension) + one-shot
backfill from property_details.listing_events for pre-trigger history.
Tax reassessment forecast OH · Partial reset (capped growth)
- Current annual tax
- $1,017 · $85/mo
- Projected year-2 tax
- $1,017 · $85/mo
- Expected delta
- $0/yr ($0/mo · 0.0%)
ⓘ Screening estimate from a state-policy table — verify with the county assessor before closing.
Climate risk First Street
- Flood 1/10 Low FEMA zone X (unshaded) · 0% chance over 30 yrs
- Wildfire 1/10 Low
- Heat 4/10 Moderate 7 d/yr ≥98°F today · 18 d/yr by 30 yrs out
- Wind 2/10 Low 0% chance of damaging wind over 30 yrs
- Air quality 2/10 Low 0 unhealthy d/yr today · 1 by 30 yrs out
Nearby sold comps map
Loading sold comps map…
Walkable amenities ~0.75 mi
Loading nearby amenities…
Taxation est. · year 1
- Rental income
- $13,571
- − Mortgage interest
- −$2,235
- − Property taxes
- −$1,017
- − Insurance
- −$200
- − Repairs & maintenance
- −$1,086
- − Management
- −$1,086
- − Depreciation
- −$1,161
- Taxable income
- $6,787
- Est. tax owed @ 24.0%
- −$1,629
- After-tax cash flow
- $5,365/yr
For passive investors: Depreciation is non-cash, so a rental often shows a tax loss while cash-flowing — sheltering income. Rental losses are passive: they offset passive income freely, and up to $25,000/yr can offset ordinary (W-2) income if you actively participate and your MAGI is under $100k (phasing out to $0 by $150k); unused losses carry forward. On sale, claimed depreciation is recaptured at up to 25%, and gains may owe capital-gains tax (a 1031 exchange can defer both). Figures are a year-1 estimate at your 24.0% rate — not tax advice; consult a CPA.
Schools (NCES district)
- District
- Zanesville City
- NCES district ID
- 3904517
- Math proficiency
- 29% ▼ -19.00%
- Reading proficiency
- 38% ▼ -11.00%
- Median HH income
- $29,695
- Composite
- 27.13/100
- National rank
- #7035
- State rank
- #570 of 656 in OH
Livability — Zanesville
- Score
- 74/100
- State rank
- #290
- US rank
- #4764
Category grades
Schools grade is shown separately in the Schools card above.
Census & demographics
- Census place
- Zanesville, OH
- County
- Muskingum County · 56,402 people
- City population
- 56,402
- Metro
- Zanesville, OH
- Population (ZIP)
- 56,402
- Household income
- $57,565
- Rent vs Own
- Severe rent burden
- 1619.0
Population outlook (Muskingum County) Hauer SSP2
- Today (2025)
- 85,625 people
- By 2030
- 84,592 · -1.2%
- By 2040
- 81,288 · -5.1%
- By 2050
- 76,751 · -10.4%
- By 2075
- 64,143 · -25.1%
- By 2100
- 47,598 · -44.4%
Race, ethnicity, and origin ACS 2023
- Neighborhood character
- Predominantly White (88%)
- Race & ethnicity
- White 88% Two or more races 6% Black 4% Hispanic / Latino 2%
- Common ancestry
- Slovak 2% Iranian 1% Italian 1%
- Foreign-born
- 1% · Canada
- Languages at home
- 98% English-only · Spanish 1%
Political lean MEDSL · Muskingum
- 2024 margin
- Solid R (+43.9) · D 27.6% · R 71.6%
- 2008→2024 swing
- -36.7pp toward R · 2008: -7.2pp · 2024: -43.9pp
- All cycles
- 2024: R+43.9 2020: R+39.3 2016: R+35.0 2012: R+7.0 2008: R+7.2
Not yet ingested
- Civics
- —
Market trends
- HPI YoY
- ▼ -90.41%
- Current HPI
- 298.9994
- Rent YoY
- ▲ 4.23%
- Metro
- Zanesville, OH
- State GDP YoY
- ▲ 1.98%
- F500 in state
- 48
Industry mix (Fortune 500 HQ in OH)
| Industry | F500 HQs | Revenue |
|---|---|---|
| Insurance | 3 | $145B |
|
||
| Industrial Machinery | 3 | $49B |
|
||
| Financial Services | 3 | $24B |
|
||
| Consumer Goods | 2 | $93B |
|
||
| Aerospace / Defense | 2 | $47B |
|
||
| Utilities | 2 | $33B |
|
||
Price history
+94.6% since first listed7 events — show timeline
- 2026-06-15 Listed $39,900 CBRMLS
- 2026-06-15 Listed $39,900 MLSNOW
- 2016-09-22 Listing Removed — MLSNOW
- 2016-07-28 Listed $9,200 MLSNOW
- 2006-06-23 Sold (Public Records) $59,000 Public Records
- 2001-05-01 Sold (Public Records) $10,000 Public Records
- 1994-09-09 Sold (Public Records) $20,500 Public Records
Property tax history
+9.3%/yrLatest (2025): $1,017 · +37.4% YoY. Source: county tax records.
Cash-flow waterfall
monthlySold comps — $/sqft
last 12 mo · ≤1 miLoading sold comps…