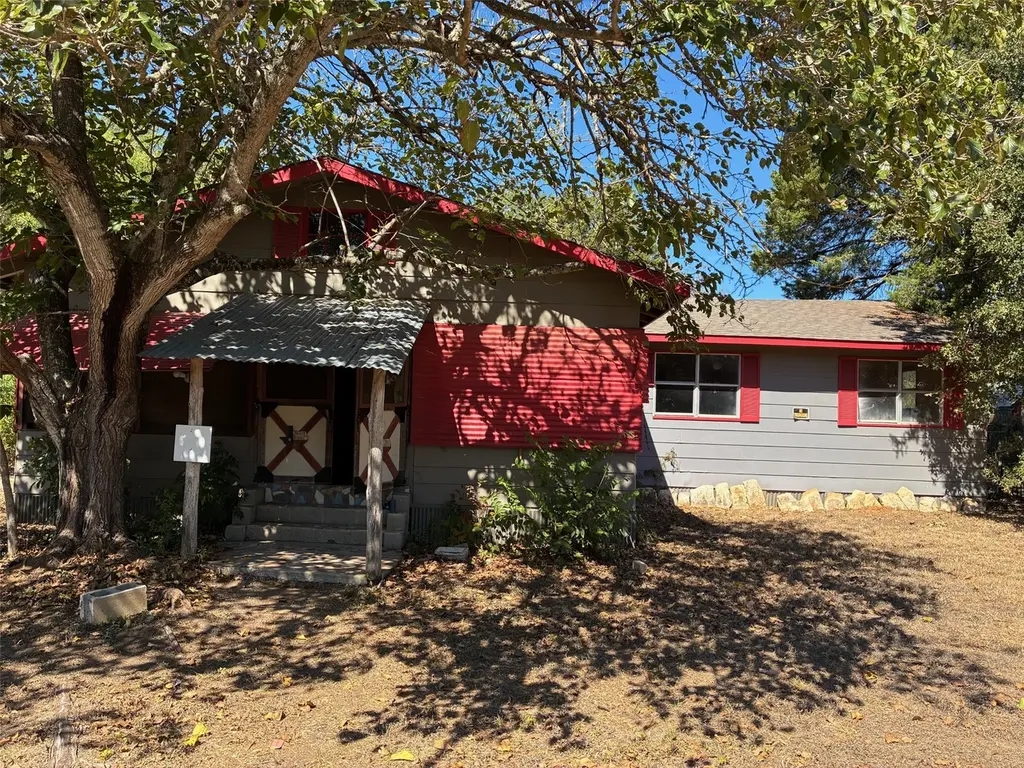
116 Flaming Oak Dr · Camp Swift, TX
Flood risk 1/10 · Minimal
- FEMA flood zone
- X (unshaded)
- Chance of flooding over 30 yrs
- 0.0%
- Est. flood insurance / yr
- $507 – $1,088
Fire risk 5/10 · Moderate
- Est. fire insurance / yr
- $1,222 – $2,270
Heat risk 8/10 · Major
- Hot days now (above 109°F)
- 7 days/yr
- Hot days in 30 yrs
- 23 days/yr
Wind risk 8/10 · Major
- Chance of severe wind over 30 yrs
- 80.0%
Air-quality risk 1/10 · Minimal
- Unhealthy air days now
- 0 days/yr
- Unhealthy air days in 30 yrs
- 0 days/yr
Risk factors via First Street. Map © Google.
Why this score? — see what drove the B grade
The composite is a weighted blend of 9 inputs, each scored 0–100. Each bar is that input's sub-score; the figure is the points it added to the 100-point composite (weight × sub-score).
- Cash flow +30.0/30.0
- ARV discount +15.0/15.0
- DSCR +10.0/10.0
- 1% rule +8.7/10.0
- Livability +2.9/5.0
- Condition / age +2.5/5.0
- Schools +2.4/10.0
- Rent growth +2.0/5.0
- Appreciation +0.0/10.0
$159,000
🖨 Deal sheet (PDF) 📄 Offer letter ✓ Due diligence
Listing remarks MLS
4 bedroom, 2 bath home on . 34-acre lot with mature trees. The home needs a great deal of work but could be a very nice property with a large front yard in a quiet neighborhood. Halfway between Bastrop and Elgin.
Key facts
- Large front yard
- Quiet neighborhood
- 0.34 acre lot
Tags
Neighborhood map
What this means for you Summary
Snapshot
- This is a 4-bed/2.0-bath single-family listed at $159k.
Deal economics
- At list price, monthly cash flow is $616 ($7k/yr) — positive.
- The deal already cash-flows at list — no discount required.
- Meets the 1% rule at list price ($2k rent vs $159k).
- Recommended offer: $140k (12.0% below list) — sets the bar for market timing.
- Cap rate 10.9% vs local median 4.1% in Camp Swift — top-decile yield for the area; either an underpriced asset or a hidden risk that comps aren't pricing in. Stress-test before assuming the spread holds.
Location & tenants
- Location reads 58/100 on livability (#1,213 in TX) — a working-class tenant base; expect higher turnover. Strengths: cost of living A+, housing A+; Watch: crime D+, amenities F, commute F.
- Bastrop ISD (rural): math 25% / reading 28% proficiency, ranked #670 of 826 in TX (top 81%) — low school quality limits family demand, transient renter base, plan for 1-2y turnover; 62% free/reduced lunch — lower-income household profile, screen leases tightly.
- Zoned schools: Lost Pines El (math 19% / reading 15%, grade F, #3,836 of 4,322 statewide, top 91%, 696 students, 88% FRL); Bastrop Middle (math 28% / reading 36%, grade F, #971 of 1,662 statewide, top 60%, 929 students, 80% FRL); Bastrop H S (math 23% / reading 33%, grade F, #1,170 of 1,632 statewide, top 72%, 1,621 students, 62% FRL) — zoned schools average 77% FRL vs 62% district-wide (15 pts higher); higher-poverty schools than district average — tighter screening recommended.
- Market conditions: Rents soft (-2.0%/yr); 1072 active listings in the ZIP; solid renter incomes; 1,841 units permitted in Bastrop County in 2024 (150 in 5+ unit buildings).
Forward outlook
- Local home prices are declining (-3.0%/yr); year-one equity from $1k of loan paydown is wiped out by about $5k of value loss. Plan a longer hold.
- Bastrop County population projected at +37% by 2050 — long-run rental-demand tailwind backs the buy-and-hold thesis.
Negotiation context
- It's been on market 242 days — a 12% lower offer ($140k) is reasonable based on typical stale-listing flexibility.
- 2 sale attempts; this cycle's ask has dropped $23k (13%) from the opening price — seller is motivated, your offer sets the floor, not the list.
Risks & watch-outs
- Climate carrying-cost: severe wind risk, 80% chance of damaging wind over 30y; moderate wildfire risk; extreme-heat days projected 7→23/yr by 2055 (HVAC capex compounding) — expect insurance premiums to compound above CPI over the hold.
Questions for the listing agent
- It's been on market 242 days. Have you received any prior offers? Is the seller open to a 12% concession, seller financing, or rate buy-down credit?
- Why hasn't it sold? Are there any deal-killer items the seller is aware of (foundation, flood, title, zoning, code violations)?
- Is there a deadline driving the sale (1031 exchange, divorce, estate, relocation)? That informs how much negotiation room exists.
- Schools are F-rated, which usually means shorter tenancies and higher turnover. Who's the typical renter profile here, and what's been the actual vacancy rate?
- Crime grade is D in this area — have there been break-ins, vandalism, or insurance claims at this property in the last 3 years? What carrier currently insures it and at what premium?
- What's the average days-on-market for RENTAL listings here right now (not sales)? A rising rental-DOM trend means longer vacancies and softer asking-rent achievability than the comps imply.
- What's the recent tenant-quality profile in this submarket — average credit score on applications, eviction rate, late-payment / NSF rate, and stable-employment percentage? A property-management company in the area should have these aggregated.
- How much new for-sale + rental construction is in the pipeline within 1–3 miles? Heavy new supply typically softens prices + rents 12–24 months out; constrained supply supports both.
Investment metrics
- 1% rule
- 1.37% ✓
- Cap rate
- 10.94%
- Cash-on-cash
- 16.60%
- DSCR
- 1.74
- GRM
- 6.1
CMA / ARV
- ARV (median comp)
- $242,079
- List price
- $159,000
- Delta
- -34.32%
- Verdict
- UNDERPRICED
- Comps
- 3 within 1.0 mi
Show comp detail 1 sale within ~0.75 mi
| Address | Dist | Beds/Ba | Sqft | Sold | Price | $/sf | Match |
|---|---|---|---|---|---|---|---|
| 118 Flaming Oak Dr | 0.02mi | 3/2.0 (-1) | 1,292 (-11%) | 22mo | $219,000 | $170 | 57 |
Match score weights: distance 35% · size 25% · config 20% · recency 20%. Top-matched comps best support the ARV.
Projected returns pro-forma
-3.0% appreciation · 0.0% rent growth · sell at horizon
- IRR
- 4.3%
- Equity multiple
- 1.16×
- Total profit
- $7,103
- Equity at exit
- $23,707
- IRR
- 10.7%
- Equity multiple
- 1.72×
- Total profit
- $32,136
- Equity at exit
- $13,747
Cash invested: $44,520 (down + closing). Projections, not guarantees.
Landlord ↔ Tenant lean methodology
- Overall (STATE)
- 87 Strongly Landlord-Friendly
- State Texas
- 87 Strongly Landlord-Friendly · R+5
- County
- — inherits STATE
- City
- — inherits STATE
ZIP-level market 78602
- Home prices YoY
- -23.0%
- Rents YoY
- -2.0%
- Active inventory
- 1072
- Price-to-rent
- 6.1×
Monthly cashflow live
- Estimated rent
- $2,182 medium interval (Pro) →
- Mortgage (P&I)
- −$834
- Tax from tax record
- −$208 /mo · $2,493/yr
- Insurance
- −$66
- HOA
- −$0
- Vacancy / Maint / Mgmt
- −$458
- Net cashflow
- $616
Break-even live
Sensitivity live
| Price | -10% $706 | -5% $661 | +0% $616 | +5% $571 | +10% $526 |
|---|---|---|---|---|---|
| Rent | -10% $443 | -5% $530 | +0% $616 | +5% $702 | +10% $788 |
| Rate | -1.0pp $696 | -0.5pp $656 | base $616 | +0.5pp $575 | +1.0pp $533 |
UW: 25.0% down · 7.5% · 30yr · 1.5% tax · 5.0% vac · 8.0% maint · 8.0% mgmt
Financing live
Cash to close
- Down payment
- $39,750
- Closing costs
- $4,770
- Reserves months
- —
- Total cash needed
- —
Loan-product check · same deal, 3 products live
Conventional
25% down · 7.5% · 30yr
- Down + closing
- —
- Monthly P&I
- —
- Monthly cashflow
- —
- DSCR
- —
- Eligible?
- —
Personal DTI + credit; lowest rate.
DSCR
20% down · 8.5% · 30yr
- Down + closing
- —
- Monthly P&I
- —
- Monthly cashflow
- —
- DSCR
- —
- Eligible?
- —
No personal income docs; deal must DSCR.
Hard money
10% down · 12.0% · 12mo
- Down + closing
- —
- Monthly P&I
- —
- Monthly cashflow
- —
- DSCR
- —
- Eligible?
- —
Short-term bridge; refi at stabilization.
Listing history 20 events
-
2026-06-21days on market $159,000 Active 242 DOM
-
2026-06-18days on market $159,000 Active 239 DOM
-
2026-06-17days on market $159,000 Active 238 DOM
-
2026-06-16days on market $159,000 Active 237 DOM
-
2026-06-15days on market $159,000 Active 236 DOM
-
2026-06-13days on market $159,000 Active 234 DOM
-
2026-06-09days on market $159,000 Active 230 DOM
-
2026-06-08days on market $159,000 Active 229 DOM
-
2026-06-07days on market $159,000 Active 228 DOM
-
2026-06-04days on market $159,000 Active 225 DOM
-
2026-06-03days on market $159,000 Active 224 DOM
-
2026-06-02days on market $159,000 Active 223 DOM
-
2026-06-01days on market $159,000 Active 222 DOM
-
2026-05-31days on market $159,000 Active 221 DOM
-
2026-04-07status Active 212-char remark
Show marketing remark (212 chars)
4 bedroom, 2 bath home on . 34-acre lot with mature trees. The home needs a great deal of work but could be a very nice property with a large front yard in a quiet neighborhood. Halfway between Bastrop and Elgin.
-
2026-02-17price $159,000 212-char remark
Show marketing remark (212 chars)
4 bedroom, 2 bath home on . 34-acre lot with mature trees. The home needs a great deal of work but could be a very nice property with a large front yard in a quiet neighborhood. Halfway between Bastrop and Elgin.
-
2025-10-15$182,000 Active 212-char remark
Show marketing remark (212 chars)
4 bedroom, 2 bath home on . 34-acre lot with mature trees. The home needs a great deal of work but could be a very nice property with a large front yard in a quiet neighborhood. Halfway between Bastrop and Elgin.
-
2025-06-18soldstatus
-
2025-06-18soldstatus
-
2025-06-18soldstatus
ⓘ Source: listings_history table (triggers on properties + properties_extension) + one-shot
backfill from property_details.listing_events for pre-trigger history.
Tax reassessment forecast TX · Resets to sale price
- Current annual tax
- $2,493 · $208/mo
- Projected year-2 tax
- $2,910 · $242/mo
- Expected delta
- +$417/yr (+$35/mo · 16.7%)
ⓘ Screening estimate from a state-policy table — verify with the county assessor before closing.
Climate risk First Street
- Flood 1/10 Low FEMA zone X (unshaded) · 0% chance over 30 yrs
- Wildfire 5/10 Major
- Heat 8/10 Severe 7 d/yr ≥109°F today · 23 d/yr by 30 yrs out
- Wind 8/10 Severe 80% chance of damaging wind over 30 yrs
- Air quality 1/10 Low 0 unhealthy d/yr today · 0 by 30 yrs out
Nearby sold comps map
Loading sold comps map…
Walkable amenities ~0.75 mi
Loading nearby amenities…
Taxation est. · year 1
- Rental income
- $26,182
- − Mortgage interest
- −$8,906
- − Property taxes
- −$2,493
- − Insurance
- −$795
- − Repairs & maintenance
- −$2,095
- − Management
- −$2,095
- − Depreciation
- −$4,625
- Taxable income
- $5,173
- Est. tax owed @ 24.0%
- −$1,242
- After-tax cash flow
- $6,149/yr
For passive investors: Depreciation is non-cash, so a rental often shows a tax loss while cash-flowing — sheltering income. Rental losses are passive: they offset passive income freely, and up to $25,000/yr can offset ordinary (W-2) income if you actively participate and your MAGI is under $100k (phasing out to $0 by $150k); unused losses carry forward. On sale, claimed depreciation is recaptured at up to 25%, and gains may owe capital-gains tax (a 1031 exchange can defer both). Figures are a year-1 estimate at your 24.0% rate — not tax advice; consult a CPA.
Schools (NCES district)
- District
- Bastrop ISD
- NCES district ID
- 4809570
- Math proficiency
- 25% ▼ -13.00%
- Reading proficiency
- 28% ▼ -4.00%
- Median HH income
- $56,010
- Composite
- 23.87/100
- National rank
- #7799
- State rank
- #670 of 826 in TX
Livability — Camp Swift
- Score
- 58/100
- State rank
- #1213
- US rank
- #21179
Category grades
Schools grade is shown separately in the Schools card above.
Census & demographics
- Census place
- Camp Swift, TX
- County
- Bastrop County · 68,601 people
- Metro
- Austin-Round Rock-Georgetown, TX
- Population (ZIP)
- 38,190
- Household income
- $89,968
- Rent vs Own
- Severe rent burden
- 775.0
Population outlook (Bastrop County) Hauer SSP2
- Today (2025)
- 94,260 people
- By 2030
- 101,355 · +7.5%
- By 2040
- 115,578 · +22.6%
- By 2050
- 129,464 · +37.3%
- By 2075
- 168,068 · +78.3%
- By 2100
- 194,857 · +106.7%
Race, ethnicity, and origin ACS 2023
- Neighborhood character
- Diverse neighborhood (Simpson 0.57)
- Race & ethnicity
- White 54% Hispanic / Latino 36% Two or more races 17% Black 6% Native American 1%
- Hispanic origin (detail)
- Mexican 28% Puerto Rican 2%
- Common ancestry
- Italian 3% Serbian 2% Lithuanian 2%
- Foreign-born
- 8% · Canada, Vietnam
- Languages at home
- 75% English-only · Spanish 23% German/W. Germanic 1%
Political lean MEDSL · Bastrop
- 2024 margin
- R (+18.4) · D 40.2% · R 58.6% · Other 1.2%
- 2008→2024 swing
- -10.2pp toward R · 2008: -8.2pp · 2024: -18.4pp
- All cycles
- 2024: R+18.4 2020: R+13.8 2016: R+20.4 2012: R+17.0 2008: R+8.2
Not yet ingested
- Civics
- —
Market trends
- HPI YoY
- ▼ -73.68%
- Current HPI
- 247.1145
- Rent YoY
- ▼ -2.04%
- Metro
- Austin-Round Rock-Georgetown, TX
- State GDP YoY
- ▲ 3.95%
- F500 in state
- 110
Industry mix (Fortune 500 HQ in TX)
| Industry | F500 HQs | Revenue |
|---|---|---|
| Energy | 16 | $1,198B |
|
||
| Technology | 5 | $198B |
|
||
| Engineering / Construction | 4 | $72B |
|
||
| Energy Services | 3 | $60B |
|
||
| Utilities | 3 | $41B |
|
||
| Healthcare | 2 | $330B |
|
||
Price history
-12.6% since first listed6 events — show timeline
- 2026-04-07 Relisted — Unlock MLS
- 2026-02-17 Price Changed $159,000 Unlock MLS
- 2025-10-15 Listed $182,000 Unlock MLS
- 2025-06-18 Sold (Public Records) — Public Records
- 2025-06-18 Sold (Public Records) — Public Records
- 2025-06-18 Sold (Public Records) — Public Records
Property tax history
+7.1%/yrLatest (2025): $2,493 · +36.5% YoY. Source: county tax records.
Cash-flow waterfall
monthlySold comps — $/sqft
last 12 mo · ≤1 miLoading sold comps…