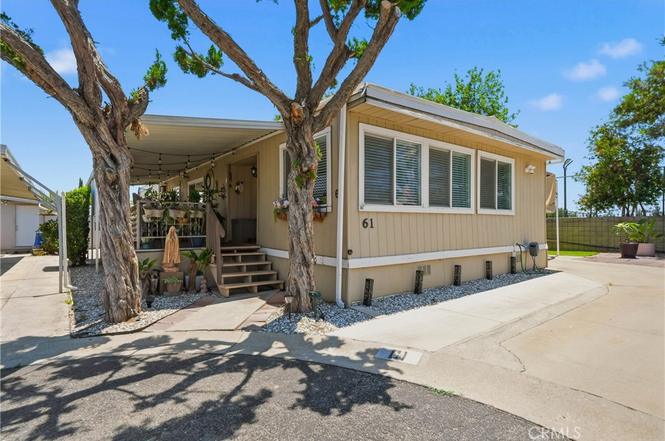
9999 Foothill #61 · Rancho Cucamonga, CA
Flood risk 4/10 · Minor
- FEMA flood zone
- X (unshaded)
- Chance of flooding over 30 yrs
- 0.22%
- Est. flood insurance / yr
- $507 – $1,088
Fire risk 1/10 · Minimal
- Est. fire insurance / yr
- $659 – $1,223
Heat risk 7/10 · Major
- Hot days now (above 101°F)
- 7 days/yr
- Hot days in 30 yrs
- 18 days/yr
Wind risk 1/10 · Minimal
- Chance of severe wind over 30 yrs
- —
Air-quality risk 9/10 · Severe
- Unhealthy air days now
- 23 days/yr
- Unhealthy air days in 30 yrs
- 28 days/yr
Risk factors via First Street. Map © Google.
Why this score? — see what drove the B- grade
The composite is a weighted blend of 9 inputs, each scored 0–100. Each bar is that input's sub-score; the figure is the points it added to the 100-point composite (weight × sub-score).
- Cash flow +30.0/30.0
- 1% rule +10.0/10.0
- DSCR +10.0/10.0
- ARV discount +8.8/15.0
- Livability +3.5/5.0
- Rent growth +2.7/5.0
- Condition / age +2.5/5.0
- Schools +2.3/10.0
- Appreciation +0.0/10.0
$185,000
🖨 Deal sheet 📄 Offer letter ✓ Due diligence
Listing remarks
Welcome to The Pines Mobile Home Park in Rancho Cucamonga! This spacious 1,440 sq. ft. double-wide home features 3 bedrooms, 2 bathrooms, and sits on one of the largest lots in the community. Enjoy rare parking for up to 6 vehicles, a low-maintenance backyard with artificial turf, and covered front and rear patios perfect for outdoor living. Inside, you'll find a newly remodeled guest bathroom with a large walk-in shower, central A/C and heating plus additional wall A/C units in every bedroom and the living room for year-round comfort. The kitchen offers upgraded flooring, a large stainless steel sink, and a stainless steel 5-burner stove. Additional features include two storage sheds, a fr
Key facts
- Double-wide home
- Largest lots
- Rare parking
Tags
Property features AI
Finance
- Other: Lot described as 0-1 Unit/Acre; Elevation reported in feet; Property latitude 34.104558, longitude -117.587917
- HOA & community: Located in The Pines park; Monthly land lease $1,475 (park)
Exterior
- Parking: Two parking spaces; Two carport spaces
- Utilities: Public sewer; District/public water
- Home design: Single-story mobile home; Mobile home remains on site; Assessor and public records used as data sources
- Construction: Mobile home (24 ft by 63 ft); One story
- Exterior features: Community pool; Sidewalks
Interior
- Bathrooms: Two full bathrooms
- Heating & cooling: Central furnace heating
- Interior features: Entry on the main level; Inside laundry
- Laundry & utility: Laundry located inside the home
Neighborhood map
What this means for you Summary
Snapshot
- This is a 3-bed/2.0-bath manufactured listed at $185k.
Deal economics
- At list price, monthly cash flow is $1k ($17k/yr) — positive.
- The deal already cash-flows at list — no discount required.
- Meets the 1% rule at list price ($3k rent vs $185k).
- Cap rate 15.5% vs local median 2.7% in Rancho Cucamonga — top-decile yield for the area; either an underpriced asset or a hidden risk that comps aren't pricing in. Stress-test before assuming the spread holds.
Location & tenants
- Location reads 70/100 on livability (#237 in CA) — a middle-class / working-renter tenant base. Strengths: employment A+, commute A, housing A-; Watch: amenities D+, health & safety D, cost of living F.
- Central Elementary (suburban): math 25% / reading 25% proficiency, ranked #379 of 517 in CA (top 73%) — low school quality limits family demand, transient renter base, plan for 1-2y turnover.
- Market conditions: Rents flat; 146 active listings in the ZIP; 24 comparable units currently listed for rent nearby; rentals leasing fast (median 2d on market — plan ~1-2 weeks tenant-placement turnaround); solid renter incomes; 5,458 units permitted in San Bernardino County in 2024 (1,500 in 5+ unit buildings).
- This rent runs 44% of the median local income ($92k/yr) — at the standard rent-burdened threshold; future hikes will face affordability resistance.
Forward outlook
- Local home prices are declining (-3.0%/yr); year-one equity from $1k of loan paydown is wiped out by about $6k of value loss. Plan a longer hold.
- San Bernardino County population projected at +15% by 2050 — modest demand growth; plan on rents tracking national, not racing it.
- At projected returns (-3.0% appreciation + 0.8% rent growth), your $52k cash investment doubles in ~4 years — after that, you're playing with house money.
Negotiation context
- Only 8 days on market — expect competitive offers; lowballing is unlikely to land.
Risks & watch-outs
- Climate carrying-cost: extreme-heat days projected 7→18/yr by 2055 (HVAC capex compounding) — expect insurance premiums to compound above CPI over the hold.
Questions for the listing agent
- Built in 1971 — when were the roof, HVAC, electrical panel, plumbing, and water heater last replaced?
- Is there a deadline driving the sale (1031 exchange, divorce, estate, relocation)? That informs how much negotiation room exists.
- Schools are B-rated — typically a magnet for longer-tenancy family renters. What's the average tenant stay here, and is there a school-zone premium baked into asking?
- What's the average days-on-market for RENTAL listings here right now (not sales)? A rising rental-DOM trend means longer vacancies and softer asking-rent achievability than the comps imply.
- What's the recent tenant-quality profile in this submarket — average credit score on applications, eviction rate, late-payment / NSF rate, and stable-employment percentage? A property-management company in the area should have these aggregated.
- How much new for-sale + rental construction is in the pipeline within 1–3 miles? Heavy new supply typically softens prices + rents 12–24 months out; constrained supply supports both.
Investment metrics
- 1% rule
- 1.84% ✓
- Cap rate
- 15.48%
- Cash-on-cash
- 32.83%
- DSCR
- 2.46
- GRM
- 4.5
CMA / ARV
- ARV (on-the-fly)
- $190,512
- Comps found
- 4
Show comp detail 4 sales within ~0.75 mi
| Address | Dist | Beds/Ba | Sqft | Sold | Price | $/sf | Match |
|---|---|---|---|---|---|---|---|
| 9999 Foothill Blvd #48 | 0.00mi | 3/2.0 | 1,440 (-5%) | 2mo | $185,000 | $128 | 90 |
| 9999 Foothill Blvd #111 | 0.00mi | 3/2.0 | 1,344 (-11%) | 1mo | $170,000 | $126 | 81 |
| 9999 Foothill Blvd #90 | 0.00mi | 3/2.0 | 1,456 (-4%) | 21mo | $165,000 | $113 | 76 |
| 9999 Foothill Blvd #72 | 0.00mi | 2/2.0 (-1) | 1,440 (-5%) | 20mo | $123,600 | $86 | 70 |
Match score weights: distance 35% · size 25% · config 20% · recency 20%. Top-matched comps best support the ARV.
Projected returns pro-forma
-3.0% appreciation · 0.84% rent growth · sell at horizon
- IRR
- 25.5%
- Equity multiple
- 2.02×
- Total profit
- $53,068
- Equity at exit
- $27,584
- IRR
- 31.9%
- Equity multiple
- 3.59×
- Total profit
- $134,111
- Equity at exit
- $15,995
Cash invested: $51,800 (down + closing). Projections, not guarantees.
Landlord ↔ Tenant lean methodology
- Overall (STATE)
- 18 Strongly Tenant-Friendly
- State California
- 18 Strongly Tenant-Friendly · D+13
- County
- — inherits STATE
- City
- — inherits STATE
ZIP-level market 91730
- Rents YoY
- 0.8%
- Active inventory
- 146
- Price-to-rent
- 4.5×
Monthly cashflow live
- Estimated rent
- $3,412 high interval (Pro) →
- Mortgage (P&I)
- −$970
- Tax est. 1.5%
- −$231 /mo · $2,775/yr
- Insurance
- −$77
- HOA
- −$0
- Vacancy / Maint / Mgmt
- −$717
- Net cashflow
- $1,417
Break-even live
UW: 25.0% down · 7.5% · 30yr · 1.5% tax · 5.0% vac · 8.0% maint · 8.0% mgmt
Financing live
Cash to close
- Down payment
- $46,250
- Closing costs
- $5,550
- Reserves months
- —
- Total cash needed
- —
Loan-product check · same deal, 3 products live
Conventional
25% down · 7.5% · 30yr
- Down + closing
- —
- Monthly P&I
- —
- Monthly cashflow
- —
- DSCR
- —
- Eligible?
- —
Personal DTI + credit; lowest rate.
DSCR
20% down · 8.5% · 30yr
- Down + closing
- —
- Monthly P&I
- —
- Monthly cashflow
- —
- DSCR
- —
- Eligible?
- —
No personal income docs; deal must DSCR.
Hard money
10% down · 12.0% · 12mo
- Down + closing
- —
- Monthly P&I
- —
- Monthly cashflow
- —
- DSCR
- —
- Eligible?
- —
Short-term bridge; refi at stabilization.
Rent comps 24 comps
| Address | Beds | Baths | Sqft | Rent | $/sqft | DOM | Units | Dist |
|---|---|---|---|---|---|---|---|---|
| 9882 Hampshire St Rancho Cucamonga, CA | 4.0 | 2.0 | 1440 | $3,700 | $2.57 | 2d | 1 | 0.10mi |
| 9860 Galena Ct Rancho Cucamonga, CA | 3.0 | 2.5 | 1288 | $3,000 | $2.33 | 24d | 1 | 0.26mi |
| 9882 Arrow Rte Rancho Cucamonga, CA | 3.0 | 2.0 | 1208 | $2,995 | $2.48 | 1d | 1 | 0.36mi |
| 8396 Sunset Trail Pl Unit A Rancho Cucamonga, CA | 3.0 | 2.5 | 1339 | $3,100 | $2.32 | 1d | 1 | 0.45mi |
| 9775 El Paseo Dr Rancho Cucamonga, CA | 2.0 | 2.5 | 1166 | $2,650 | $2.27 | 1d | 1 | 0.45mi |
| 10187 Indian Summer Dr Unit A Rancho Cucamonga, CA | 3.0 | 2.5 | 1339 | $2,850 | $2.13 | 1d | 1 | 0.54mi |
| 8200 Haven Ave Rancho Cucamonga, CA | 1.0–3.0 | 1.0–2.5 | 1055 | $3,139 | $2.98 | 1d | 33 | 0.56mi |
| 8397 Tapia Way Rancho Cucamonga, CA | 4.0 | 3.5 | 1808 | $4,000 | $2.21 | 5d | 1 | 0.66mi |
| 7689 Cornel Ct Rancho Cucamonga, CA | 3.0 | 2.0 | 1454 | $3,600 | $2.48 | 1d | 1 | 0.75mi |
| 10375 Church St Rancho Cucamonga, CA | 2.0 | 2.0 | 1264 | $2,800 | $2.22 | 10d | 1 | 0.76mi |
| 8731 Pine Crest Pl Rancho Cucamonga, CA | 2.0 | 1.5 | 1179 | $2,995 | $2.54 | 2d | 1 | 0.78mi |
| 8739 Pine Crest Pl Rancho Cucamonga, CA | 2.0 | 1.5 | 1179 | $2,700 | $2.29 | 1d | 1 | 0.80mi |
| 8500 Haven Ave Rancho Cucamonga, CA | 2.0 | 1.0–2.0 | 1057 | $5,150 | $4.87 | 1d | 41 | 0.84mi |
| 10554 Cannon Dr Rancho Cucamonga, CA | 3.0 | 2.5 | 1794 | $3,895 | $2.17 | 15d | 1 | 0.96mi |
| 7619 Haven Ave Unit B Rancho Cucamonga, CA | 3.0 | 3.0 | 1403 | $2,700 | $1.92 | 24d | 1 | 1.04mi |
| 10730 Church St Rancho Cucamonga, CA | 1.0–3.0 | 1.0–2.5 | 893 | $3,316 | $3.71 | 1d | 8 | 1.14mi |
| 10855 Church St Rancho Cucamonga, CA | 1.0–3.0 | 1.5–3.5 | 1306 | $3,739 | $2.86 | 1d | 6 | 1.17mi |
| 10850 Church St Rancho Cucamonga, CA | 1.0–3.0 | 1.0–2.0 | 1091 | $3,740 | $3.43 | 1d | 9 | 1.21mi |
| 7325 Layton St Rancho Cucamonga, CA | 3.0 | 2.0 | 1471 | $3,450 | $2.35 | 2d | 1 | 1.22mi |
| 8167 Vineyard Ave #61 Rancho Cucamonga, CA | 3.0 | 2.5 | 1221 | $2,750 | $2.25 | 24d | 1 | 1.30mi |
| 10950 Church St Rancho Cucamonga, CA | 2.0–3.0 | 2.0–2.5 | 1355 | $3,659 | $2.70 | 1d | 21 | 1.38mi |
| 9934 La Vine St Rancho Cucamonga, CA | 4.0 | 3.0 | 2012 | $3,600 | $1.79 | 1d | 1 | 1.40mi |
| 8250 Vineyard Ave Rancho Cucamonga, CA | 2.0–3.0 | 2.0 | 1059 | $3,250 | $3.07 | 1d | 14 | 1.41mi |
| 7296 Parkside Pl Rancho Cucamonga, CA | 3.0 | 2.0 | 1272 | $3,390 | $2.67 | 12d | 1 | 1.45mi |
Listing history 7 events
-
2026-06-18days on market $185,000 Active 8 DOM
-
2026-06-17days on market $185,000 Active 7 DOM
-
2026-06-16days on market $185,000 Active 6 DOM
-
2026-06-15days on market $185,000 Active 5 DOM
-
2026-06-13days on market $185,000 Active 3 DOM
-
2026-06-13remarks 699-char remark
-
2026-06-13$185,000 Active 2 DOM
ⓘ Source: listings_history table (triggers on properties + properties_extension) + one-shot
backfill from property_details.listing_events for pre-trigger history.
Climate risk First Street
- Flood 4/10 Moderate FEMA zone X (unshaded) · 22% chance over 30 yrs
- Wildfire 1/10 Low
- Heat 7/10 Severe 7 d/yr ≥101°F today · 18 d/yr by 30 yrs out
- Wind 1/10 Low
- Air quality 9/10 Extreme 23 unhealthy d/yr today · 28 by 30 yrs out
Nearby sold comps map
Loading sold comps map…
Walkable amenities ~0.75 mi
Loading nearby amenities…
Taxation est. · year 1
- Rental income
- $40,945
- − Mortgage interest
- −$10,363
- − Property taxes
- −$2,775
- − Insurance
- −$925
- − Repairs & maintenance
- −$3,276
- − Management
- −$3,276
- − Depreciation
- −$5,382
- Taxable income
- $14,949
- Est. tax owed @ 24.0%
- −$3,588
- After-tax cash flow
- $13,417/yr
For passive investors: Depreciation is non-cash, so a rental often shows a tax loss while cash-flowing — sheltering income. Rental losses are passive: they offset passive income freely, and up to $25,000/yr can offset ordinary (W-2) income if you actively participate and your MAGI is under $100k (phasing out to $0 by $150k); unused losses carry forward. On sale, claimed depreciation is recaptured at up to 25%, and gains may owe capital-gains tax (a 1031 exchange can defer both). Figures are a year-1 estimate at your 24.0% rate — not tax advice; consult a CPA.
Schools (NCES district)
- District
- Central Elementary
- NCES district ID
- 0607950
- Math proficiency
- 25% ▼ -18.00%
- Reading proficiency
- 25% ▼ -31.00%
- Median HH income
- $64,090
- Composite
- 23.41/100
- National rank
- #7895
- State rank
- #379 of 517 in CA
Livability — Rancho Cucamonga
- Score
- 70/100
- State rank
- #237
- US rank
- #7808
Category grades
Schools grade is shown separately in the Schools card above.
Census & demographics
- Census place
- Rancho Cucamonga, CA
- County
- San Bernardino County · 2,030,291 people
- City population
- 175,531
- Metro
- Riverside-San Bernardino-Ontario, CA
- Population (ZIP)
- 71,613
- Household income
- $92,237
- Rent vs Own
- Severe rent burden
- 4013.0
Population outlook (San Bernardino County) Hauer SSP2
- Today (2025)
- 2,300,329 people
- By 2030
- 2,378,907 · +3.4%
- By 2040
- 2,523,137 · +9.7%
- By 2050
- 2,642,388 · +14.9%
- By 2075
- 2,880,769 · +25.2%
- By 2100
- 2,909,436 · +26.5%
Race, ethnicity, and origin ACS 2023
- Neighborhood character
- Highly diverse neighborhood (Simpson 0.71)
- Race & ethnicity
- Hispanic / Latino 43% White 28% Two or more races 16% Asian 14% Black 10% Native American 2%
- Hispanic origin (detail)
- Mexican 33% Salvadoran 1%
- Common ancestry
- Lithuanian 1% Italian 1% Slovak 1%
- Foreign-born
- 23% · Canada, China, South Korea
- Languages at home
- 61% English-only · Spanish 22% Chinese 4% Tagalog/Filipino 4%
Political lean MEDSL · San Bernardino
- 2024 margin
- Toss-up / Even · D 47.5% · R 49.7% · Other 2.8%
- 2008→2024 swing
- -8.5pp toward R · 2008: 6.3pp · 2024: -2.1pp
- All cycles
- 2024: R+2.1 2020: D+10.7 2016: D+9.8 2012: D+5.4 2008: D+6.3
Not yet ingested
- Civics
- —
Market trends
- HPI YoY
- ▼ -554.10%
- Current HPI
- 404.3113
- Rent YoY
- ▲ 0.84%
- Metro
- Riverside-San Bernardino-Ontario, CA
- State GDP YoY
- ▲ 3.21%
- F500 in state
- 116
Industry mix (Fortune 500 HQ in CA)
| Industry | F500 HQs | Revenue |
|---|---|---|
| Technology | 27 | $1,492B |
|
||
| Financial Services | 3 | $174B |
|
||
| Retail | 3 | $44B |
|
||
| Insurance | 3 | $26B |
|
||
| Media / Entertainment | 2 | $115B |
|
||
| Pharmaceuticals / Biotech | 2 | $62B |
|
||
Price history
1 event — show timeline
- 2026-06-10 Listed $185,000 CRMLS
Property tax history
-3.1%/yrLatest (2025): $121 · +0.7% YoY. Source: county tax records.
Cash-flow waterfall
monthlySold comps — $/sqft
last 12 mo · ≤1 miLoading sold comps…