6047 Katie Dr · Boody, IL
Flood risk 1/10 · Minimal
- FEMA flood zone
- X (unshaded)
- Chance of flooding over 30 yrs
- 0.0%
- Est. flood insurance / yr
- $473 – $860
Fire risk 1/10 · Minimal
- Est. fire insurance / yr
- $804 – $1,492
Heat risk 3/10 · Minor
- Hot days now (above 105°F)
- 7 days/yr
- Hot days in 30 yrs
- 19 days/yr
Wind risk 2/10 · Minimal
- Chance of severe wind over 30 yrs
- 2.0%
Air-quality risk 2/10 · Minimal
- Unhealthy air days now
- 1 days/yr
- Unhealthy air days in 30 yrs
- 2 days/yr
Risk factors via First Street. Map © Google.
Why this score? — see what drove the B+ grade
The composite is a weighted blend of 9 inputs, each scored 0–100. Each bar is that input's sub-score; the figure is the points it added to the 100-point composite (weight × sub-score).
- Cash flow +30.0/30.0
- ARV discount +15.0/15.0
- DSCR +10.0/10.0
- 1% rule +9.0/10.0
- Appreciation +5.0/10.0
- Livability +3.0/5.0
- Rent growth +2.5/5.0
- Condition / age +2.2/5.0
- Schools +2.1/10.0
$75,000
🖨 Deal sheet (PDF) 📄 Offer letter ✓ Due diligence
Listing remarks
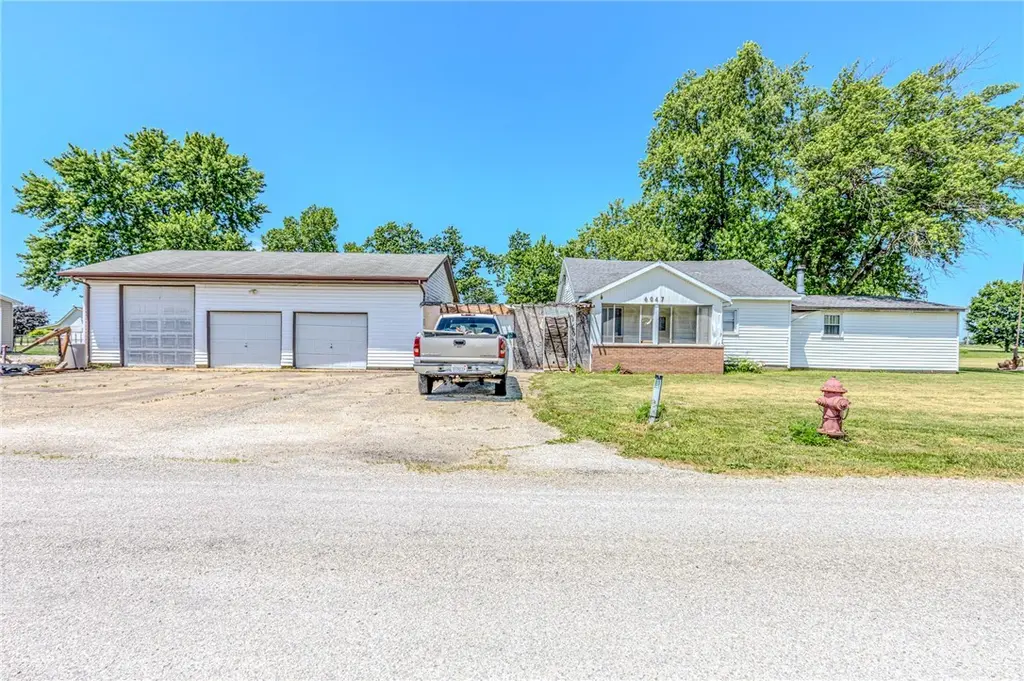
Welcome to 6047 W Katie Drive, Boody, IL! This 2-bedroom, 2-bath home is full of potential and ready for your vision. Offering 1,464 square feet on the main level plus an additional 427 square feet upstairs, there's plenty of room to create the space you've been dreaming of. Situated on a 0.56-acre lot, the property also features an impressive 26' x 40' three-car shop with three overhead doors—perfect for storage, hobbies, projects, or a workshop. Whether you're looking for your next renovation project or an opportunity to build equity, this property is packed with possibilities. Bring your ideas and make it your own!
Key facts
- 0.56 acre lot
- 0.56 acre lot
- Built 1900
Tags
Property features AI
Exterior
- Utilities: Public water; Septic tank
- Home design: Single-family residence; One and one half levels; 1 story
- Construction: Vinyl siding
- Exterior features: Shingle roof; Asphalt road access
Interior
- Kitchen: Oven; Refrigerator
- Bathrooms: 1 full bathroom
- Heating & cooling: Forced air heating; Central air conditioning
- Interior features: Gas water heater; Oven; Refrigerator; Crawl space basement
- Laundry & utility: Laundry on main level
Neighborhood map
What this means for you Summary
Snapshot
- This is a 2-bed/1.0-bath single-family listed at $75k. Condition is rated fair.
Deal economics
- At list price, monthly cash flow is $309 ($4k/yr) — positive.
- The deal already cash-flows at list — no discount required.
- Meets the 1% rule at list price ($1k rent vs $75k).
- Recommended offer: $74k (1.5% below list) — sets the bar for market timing.
Location & tenants
- Location reads 60/100 on livability (#953 in IL) — a middle-class / working-renter tenant base. Strengths: cost of living A+, housing A+; Watch: crime D+, employment D, amenities F.
- Meridian CUSD 15 (rural): math 21% / reading 25% proficiency, ranked #353 of 620 in IL (top 57%) — low school quality limits family demand, transient renter base, plan for 1-2y turnover.
- Zoned schools: Meridian Elem School (math 22% / reading 22%, grade F, #940 of 2,056 statewide, top 49%, 456 students, 0% FRL); Meridian Middle School (math 20% / reading 28%, grade F, #364 of 665 statewide, top 56%, 207 students, 0% FRL); Meridian High School (math 22% / reading 27%, grade F, #256 of 693 statewide, top 44%, 304 students, 0% FRL) — zoned schools average 0% FRL vs 30% district-wide (30 pts lower); this property's tenant base skews higher-income than the district average.
- Market conditions: 1 active listings in the ZIP; 63 units permitted in Macon County in 2024 (0 in 5+ unit buildings).
Forward outlook
- In year one you build about $3k of equity ($519 loan paydown + $2k appreciation (3.0% local appreciation)).
- Macon County population projected at -24% by 2050 — secular population decline; favor cash flow + early exit over multi-decade hold.
- At projected returns (3.0% appreciation + 3.0% rent growth), your $21k cash investment doubles in ~4 years — after that, you're playing with house money.
Negotiation context
- It's been on market 21 days — a 2% lower offer ($74k) is reasonable based on typical stale-listing flexibility.
Risks & watch-outs
- Watch-outs: built in 1900 — expect roof / HVAC / electrical / plumbing capex.
Questions for the listing agent
- Have any recent inspections been done? Can we get a copy of the seller's disclosures and any deferred-maintenance estimates?
- Built in 1900 — when were the roof, HVAC, electrical panel, plumbing, and water heater last replaced?
- Is there a deadline driving the sale (1031 exchange, divorce, estate, relocation)? That informs how much negotiation room exists.
- Schools are F-rated, which usually means shorter tenancies and higher turnover. Who's the typical renter profile here, and what's been the actual vacancy rate?
- Crime grade is D in this area — have there been break-ins, vandalism, or insurance claims at this property in the last 3 years? What carrier currently insures it and at what premium?
- What's the average days-on-market for RENTAL listings here right now (not sales)? A rising rental-DOM trend means longer vacancies and softer asking-rent achievability than the comps imply.
- What's the recent tenant-quality profile in this submarket — average credit score on applications, eviction rate, late-payment / NSF rate, and stable-employment percentage? A property-management company in the area should have these aggregated.
- How much new for-sale + rental construction is in the pipeline within 1–3 miles? Heavy new supply typically softens prices + rents 12–24 months out; constrained supply supports both.
Investment metrics
- 1% rule
- 1.40% ✓
- Cap rate
- 11.24%
- Cash-on-cash
- 17.66%
- DSCR
- 1.79
- GRM
- 6.0
CMA / ARV
- ARV (on-the-fly)
- $128,588
- Comps found
- 1
Show comp detail 1 sale within ~0.75 mi
| Address | Dist | Beds/Ba | Sqft | Sold | Price | $/sf | Match |
|---|---|---|---|---|---|---|---|
| 6178 Public Rd | 0.12mi | 3/2.0 (+1) | 1,728 (-9%) | 2mo | $117,000 | $68 | 70 |
Match score weights: distance 35% · size 25% · config 20% · recency 20%. Top-matched comps best support the ARV.
Projected returns pro-forma
3.0% appreciation · 3.0% rent growth · sell at horizon
- IRR
- 24.1%
- Equity multiple
- 2.37×
- Total profit
- $28,734
- Equity at exit
- $33,723
- IRR
- 24.9%
- Equity multiple
- 4.56×
- Total profit
- $74,738
- Equity at exit
- $51,972
Cash invested: $21,000 (down + closing). Projections, not guarantees.
Landlord ↔ Tenant lean methodology
- Overall (STATE)
- 43 Moderately Tenant-Leaning
- State Illinois
- 43 Moderately Tenant-Leaning · D+7
- County
- — inherits STATE
- City
- — inherits STATE
ZIP-level market 62514
- Active inventory
- 1
- Price-to-rent
- 6.0×
Monthly cashflow live
- Estimated rent
- $1,047 medium interval (Pro) →
- Mortgage (P&I)
- −$393
- Tax est. 1.5%
- −$94 /mo · $1,125/yr
- Insurance
- −$31
- HOA
- −$0
- Lot rent
- −$0
- Vacancy / Maint / Mgmt
- −$220
- Net cashflow
- $309
Break-even live
Sensitivity live
| Price | -10% $361 | -5% $335 | +0% $309 | +5% $283 | +10% $257 |
|---|---|---|---|---|---|
| Rent | -10% $226 | -5% $268 | +0% $309 | +5% $350 | +10% $392 |
| Rate | -1.0pp $347 | -0.5pp $328 | base $309 | +0.5pp $290 | +1.0pp $270 |
UW: 25.0% down · 7.5% · 30yr · 1.5% tax · 5.0% vac · 8.0% maint · 8.0% mgmt
Financing live
Cash to close
- Down payment
- $18,750
- Closing costs
- $2,250
- Reserves months
- —
- Total cash needed
- —
Loan-product check · same deal, 3 products live
Conventional
25% down · 7.5% · 30yr
- Down + closing
- —
- Monthly P&I
- —
- Monthly cashflow
- —
- DSCR
- —
- Eligible?
- —
Personal DTI + credit; lowest rate.
DSCR
20% down · 8.5% · 30yr
- Down + closing
- —
- Monthly P&I
- —
- Monthly cashflow
- —
- DSCR
- —
- Eligible?
- —
No personal income docs; deal must DSCR.
Hard money
10% down · 12.0% · 12mo
- Down + closing
- —
- Monthly P&I
- —
- Monthly cashflow
- —
- DSCR
- —
- Eligible?
- —
Short-term bridge; refi at stabilization.
Listing history 16 events
-
2026-06-23days on market $75,000 Active 21 DOM
-
2026-06-21days on market $75,000 Active 20 DOM
-
2026-06-19days on market $75,000 Active 18 DOM
-
2026-06-18days on market $75,000 Active 17 DOM
-
2026-06-17days on market $75,000 Active 16 DOM
-
2026-06-16days on market $75,000 Active 15 DOM
-
2026-06-15days on market $75,000 Active 14 DOM
-
2026-06-14days on market $75,000 Active 12 DOM
-
2026-06-13days on market $75,000 Active 11 DOM
-
2026-06-10days on market $75,000 Active 9 DOM
-
2026-06-09days on market $75,000 Active 8 DOM
-
2026-06-08days on market $75,000 Active 7 DOM
-
2026-06-07days on market $75,000 Active 6 DOM
-
2026-06-03days on market $75,000 Active 2 DOM
-
2026-06-02remarks 625-char remark
-
2026-06-02$75,000 Active 1 DOM
ⓘ Source: listings_history table (triggers on properties + properties_extension) + one-shot
backfill from property_details.listing_events for pre-trigger history.
Climate risk First Street
- Flood 1/10 Low FEMA zone X (unshaded) · 0% chance over 30 yrs
- Wildfire 1/10 Low
- Heat 3/10 Moderate 7 d/yr ≥105°F today · 19 d/yr by 30 yrs out
- Wind 2/10 Low 2% chance of damaging wind over 30 yrs
- Air quality 2/10 Low 1 unhealthy d/yr today · 2 by 30 yrs out
Nearby sold comps map
Loading sold comps map…
Walkable amenities ~0.75 mi
Loading nearby amenities…
Taxation est. · year 1
- Rental income
- $12,567
- − Mortgage interest
- −$4,201
- − Property taxes
- −$1,125
- − Insurance
- −$375
- − Repairs & maintenance
- −$1,005
- − Management
- −$1,005
- − Depreciation
- −$2,182
- Taxable income
- $2,674
- Est. tax owed @ 24.0%
- −$642
- After-tax cash flow
- $3,067/yr
For passive investors: Depreciation is non-cash, so a rental often shows a tax loss while cash-flowing — sheltering income. Rental losses are passive: they offset passive income freely, and up to $25,000/yr can offset ordinary (W-2) income if you actively participate and your MAGI is under $100k (phasing out to $0 by $150k); unused losses carry forward. On sale, claimed depreciation is recaptured at up to 25%, and gains may owe capital-gains tax (a 1031 exchange can defer both). Figures are a year-1 estimate at your 24.0% rate — not tax advice; consult a CPA.
Condition & rehab AI · 7 photos
This home requires significant repairs and maintenance, including a new roof, painting and siding repair, flooring replacement, and HVAC replacement. These updates will significantly increase its resale value.
Repairs flagged
- Major roof — The roof appears to be in poor condition, with visible wear and tear.
- Major siding — The siding is peeling and the paint is chipping, indicating significant wear.
- Major flooring — The flooring in the garage appears to be in poor condition, with visible wear and tear.
- Major interior walls — The interior walls appear to be in poor condition, with visible wear and tear.
- Major HVAC unit — The HVAC unit appears to be old and may need replacement.
Value-add opportunities
- Resale New roof — A new roof will significantly improve the home's curb appeal and increase its value.
- Resale Painting and siding repair — Painting and repairing the siding will improve the home's appearance and increase its value.
- Resale Flooring replacement — Replacing the flooring in the garage will improve the home's appearance and increase its value.
- Resale HVAC replacement — Replacing the HVAC unit will improve the home's comfort and increase its value.
Renovation cost estimate screening
| Repair item | Severity | Est. cost |
|---|---|---|
| roof · The roof appears to be in poor condition, with visible wear and tear. | Major | $15,000–50,000 |
| siding · The siding is peeling and the paint is chipping, indicating significant wear. | Major | $15,000–50,000 |
| flooring · The flooring in the garage appears to be in poor condition, with visible wear and tear. | Major | $15,000–50,000 |
| interior walls · The interior walls appear to be in poor condition, with visible wear and tear. | Major | $15,000–50,000 |
| HVAC unit · The HVAC unit appears to be old and may need replacement. | Major | $15,000–50,000 |
| Total estimated repair cost · 5 items | $75,000–250,000 |
Value-add ROI direction
- Resale New roof — A new roof will significantly improve the home's curb appeal and increase its value. ↑
- Resale Painting and siding repair — Painting and repairing the siding will improve the home's appearance and increase its value. ↑
- Resale Flooring replacement — Replacing the flooring in the garage will improve the home's appearance and increase its value. ↑
- Resale HVAC replacement — Replacing the HVAC unit will improve the home's comfort and increase its value. ↑
ⓘ Cost ranges are severity-bucket heuristics (US national rule-of-thumb). Get contractor quotes + a written scope before underwriting a rehab budget.
Schools (NCES district)
- District
- Meridian CUSD 15
- NCES district ID
- 1700123
- Math proficiency
- 21% ▼ -6.00%
- Reading proficiency
- 25% ▼ -8.00%
- Median HH income
- $57,708
- Composite
- 21.13/100
- National rank
- #8434
- State rank
- #353 of 620 in IL
Livability — Boody
- Score
- 60/100
- State rank
- #953
- US rank
- #18589
Category grades
Schools grade is shown separately in the Schools card above.
Census & demographics
- Census place
- Boody, IL
- City population
- 372
- Population (ZIP)
- 372
Population outlook (Macon County) Hauer SSP2
- Today (2025)
- 99,568 people
- By 2030
- 94,973 · -4.6%
- By 2040
- 85,250 · -14.4%
- By 2050
- 75,920 · -23.8%
- By 2075
- 55,962 · -43.8%
- By 2100
- 36,468 · -63.4%
Race, ethnicity, and origin ACS 2023
- Neighborhood character
- Predominantly White (97%)
- Race & ethnicity
- White 97% Hispanic / Latino 3% Two or more races 3%
- Common ancestry
- Romanian 2%
Political lean MEDSL · Macon
- 2024 margin
- R (+18.9) · D 39.8% · R 58.7% · Other 1.4%
- 2008→2024 swing
- -20.0pp toward R · 2008: 1.1pp · 2024: -18.9pp
- All cycles
- 2024: R+18.9 2020: R+17.7 2016: R+18.1 2012: R+5.2 2008: D+1.1
Not yet ingested
- Civics
- —
Market trends
- HPI YoY
- —
- Current HPI
- —
- Rent YoY
- —
- Metro
- —
- State GDP YoY
- ▲ 1.59%
- F500 in state
- 60
Industry mix (Fortune 500 HQ in IL)
| Industry | F500 HQs | Revenue |
|---|---|---|
| Insurance | 4 | $201B |
|
||
| Consumer Goods | 4 | $87B |
|
||
| Industrial Machinery | 3 | $64B |
|
||
| Healthcare | 2 | $55B |
|
||
| Retail / Pharmacy | 1 | $148B |
|
||
| Agriculture / Food | 1 | $86B |
|
||
Price history
1 event — show timeline
- 2026-06-01 Listed $75,000 CIBR
Cash-flow waterfall
monthlySold comps — $/sqft
last 12 mo · ≤1 miLoading sold comps…