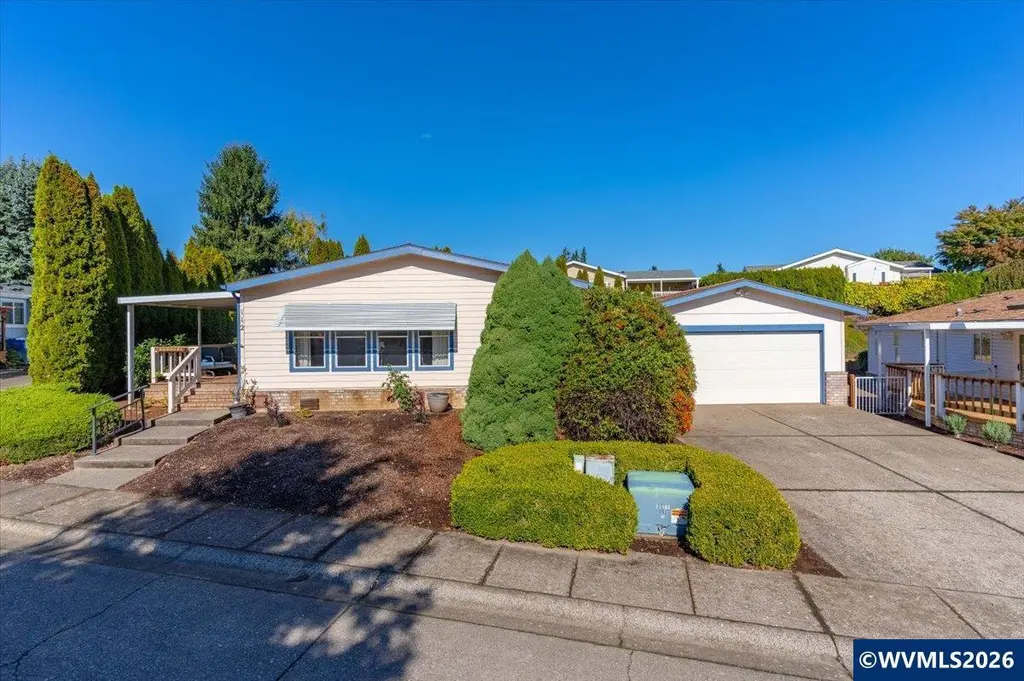
2120 Robins Ln SE #112 · Salem, OR
Flood risk 5/10 · Moderate
- FEMA flood zone
- X
- Chance of flooding over 30 yrs
- 0.24%
- Est. flood insurance / yr
- $507 – $1,088
Fire risk 3/10 · Minor
- Est. fire insurance / yr
- $498 – $926
Heat risk 3/10 · Minor
- Hot days now (above 91°F)
- 7 days/yr
- Hot days in 30 yrs
- 15 days/yr
Wind risk 1/10 · Minimal
- Chance of severe wind over 30 yrs
- —
Air-quality risk 9/10 · Severe
- Unhealthy air days now
- 12 days/yr
- Unhealthy air days in 30 yrs
- 13 days/yr
Risk factors via First Street. Map © Google.
Why this score? — see what drove the C- grade
The composite is a weighted blend of 9 inputs, each scored 0–100. Each bar is that input's sub-score; the figure is the points it added to the 100-point composite (weight × sub-score).
- Cash flow +25.1/30.0
- DSCR +8.2/10.0
- 1% rule +6.3/10.0
- Livability +4.0/5.0
- Schools +3.7/10.0
- Rent growth +2.9/5.0
- Condition / age +2.5/5.0
- ARV discount +0.0/15.0
- Appreciation +0.0/10.0
$175,000
🖨 Deal sheet (PDF) 📄 Offer letter ✓ Due diligence
Listing remarks MLS
Terrace Lake Estates, a gated 55+ community. Offering a 2-car garage, spacious living and dining areas, and a fenced yard with a covered deck. Vaulted ceilings and skylights provide abundant natural light. The kitchen features built-in ovens and a cooktop, while the utility room includes a sink and access to the hall bath. The primary suite offers a walk-in closet and walk-in shower.
Key facts
- Gated community
- Covered deck
- Fenced yard
Tags
Neighborhood map
What this means for you Summary
Snapshot
- This is a 2-bed/2.0-bath manufactured listed at $175k.
Deal economics
- At list price, monthly cash flow is $386 ($5k/yr) — positive.
- The deal already cash-flows at list — no discount required.
- Meets the 1% rule at list price ($2k rent vs $175k).
- Recommended offer: $164k (6.0% below list) — sets the bar for market timing.
- Cap rate 8.9% vs local median 2.9% in Salem — top-decile yield for the area; either an underpriced asset or a hidden risk that comps aren't pricing in. Stress-test before assuming the spread holds.
Location & tenants
- Location reads 79/100 on livability (#59 in OR, #2,084 nationally) — a middle-class / working-renter tenant base. Strengths: amenities A+, commute A+, housing A+; Watch: crime F.
- Salem-Keizer SD 24J (urban): math 34% / reading 47% proficiency, ranked #103 of 183 in OR (top 56%) — families likely to look elsewhere, expect single-tenant / working-renter base with shorter leases.
- Zoned schools: Pringle Elementary School (499 students, 91% FRL); Judson Middle School (810 students, 96% FRL); South Salem High School (2,256 students, 96% FRL) — zoned schools average 94% FRL vs 53% district-wide (42 pts higher); higher-poverty schools than district average — tighter screening recommended.
- Market conditions: Rents rising (+1.6%/yr); 278 active listings in the ZIP; 22 comparable units currently listed for rent nearby; rentals at typical pace (median 24d on market — plan ~3-4 weeks tenant-placement turnaround); solid renter incomes; 1,591 units permitted in Marion County in 2024 (716 in 5+ unit buildings).
Forward outlook
- Local home prices are declining (-3.0%/yr); year-one equity from $1k of loan paydown is wiped out by about $5k of value loss. Plan a longer hold.
- Marion County population projected at +17% by 2050 — long-run rental-demand tailwind backs the buy-and-hold thesis.
Negotiation context
- It's been on market 74 days — a 6% lower offer ($164k) is reasonable based on typical stale-listing flexibility.
- 2 sale attempts since 4y ago; this cycle's ask has dropped $22k (11%) from the opening price — seller is motivated, your offer sets the floor, not the list.
Risks & watch-outs
- Climate carrying-cost: moderate flood risk — expect insurance premiums to compound above CPI over the hold.
Questions for the listing agent
- It's been on market 74 days. Have you received any prior offers? Is the seller open to a 6% concession, seller financing, or rate buy-down credit?
- Why hasn't it sold? Are there any deal-killer items the seller is aware of (foundation, flood, title, zoning, code violations)?
- Is there a deadline driving the sale (1031 exchange, divorce, estate, relocation)? That informs how much negotiation room exists.
- Schools are D-rated, which usually means shorter tenancies and higher turnover. Who's the typical renter profile here, and what's been the actual vacancy rate?
- Crime grade is F in this area — have there been break-ins, vandalism, or insurance claims at this property in the last 3 years? What carrier currently insures it and at what premium?
- What's the average days-on-market for RENTAL listings here right now (not sales)? A rising rental-DOM trend means longer vacancies and softer asking-rent achievability than the comps imply.
- What's the recent tenant-quality profile in this submarket — average credit score on applications, eviction rate, late-payment / NSF rate, and stable-employment percentage? A property-management company in the area should have these aggregated.
- How much new for-sale + rental construction is in the pipeline within 1–3 miles? Heavy new supply typically softens prices + rents 12–24 months out; constrained supply supports both.
Investment metrics
- 1% rule
- 1.13% ✓
- Cap rate
- 8.94%
- Cash-on-cash
- 9.45%
- DSCR
- 1.42
- GRM
- 7.4
CMA / ARV
- ARV (median comp)
- $140,541
- List price
- $175,000
- Delta
- 24.52%
- Verdict
- OVERPRICED
- Comps
- 20 within 1.0 mi
Show comp detail 12 sales within ~0.75 mi
| Address | Dist | Beds/Ba | Sqft | Sold | Price | $/sf | Match |
|---|---|---|---|---|---|---|---|
| 2120 Robins Ln SE #207 | 0.00mi | 2/2.0 | 1,593 (-2%) | 10mo | $225,000 | $141 | 89 |
| 2120 Robins Ln SE #185 | 0.00mi | 2/2.0 | 1,728 (+7%) | 5mo | $224,900 | $130 | 84 |
| 2120 Robins Ln #2 | 0.00mi | 3/2.0 (+1) | 1,536 (-5%) | 8mo | $185,000 | $120 | 79 |
| 2120 Robins Ln SE #180 | 0.00mi | 3/2.0 (+1) | 1,782 (+10%) | 2mo | $243,000 | $136 | 77 |
| 2000 Robins Ln SE #40 | 0.32mi | 3/2.0 (+1) | 1,620 (0%) | 6mo | $81,200 | $50 | 75 |
| 2120 SE Robins Ln #145 | 0.00mi | 3/2.0 (+1) | 1,782 (+10%) | 5mo | $200,000 | $112 | 74 |
| 2000 Robins Ln SE #9 | 0.32mi | 3/2.0 (+1) | 1,586 (-2%) | 4mo | $143,000 | $90 | 73 |
| 2040 Navaho Ct SE | 0.42mi | 2/2.0 | 1,560 (-4%) | 4mo | $94,999 | $61 | 71 |
| 2120 Robins Ln SE #66 | 0.26mi | 3/2.0 (+1) | 1,536 (-5%) | 7mo | $182,000 | $118 | 68 |
| 2000 Robins Ln SE #8 | 0.32mi | 3/2.0 (+1) | 1,512 (-7%) | 5mo | $127,500 | $84 | 65 |
| 6795 Fairway Ave SE #6795 | 0.30mi | 3/2.0 (+1) | 1,440 (-11%) | 4mo | $75,000 | $52 | 59 |
| 2020 Nomad Ct SE | 0.39mi | 2/2.0 | 1,440 (-11%) | 8mo | $50,000 | $35 | 57 |
Match score weights: distance 35% · size 25% · config 20% · recency 20%. Top-matched comps best support the ARV.
Projected returns pro-forma
-3.0% appreciation · 1.64% rent growth · sell at horizon
- IRR
- -3.5%
- Equity multiple
- 0.87×
- Total profit
- $-6,431
- Equity at exit
- $26,093
- IRR
- 4.6%
- Equity multiple
- 1.32×
- Total profit
- $15,451
- Equity at exit
- $15,131
Cash invested: $49,000 (down + closing). Projections, not guarantees.
Landlord ↔ Tenant lean methodology
- Overall (STATE)
- 28 Tenant-Leaning
- State Oregon
- 28 Tenant-Leaning · D+6
- County
- — inherits STATE
- City
- — inherits STATE
ZIP-level market 97306
- Rents YoY
- 1.6%
- Active inventory
- 278
- Price-to-rent
- 7.4×
Monthly cashflow live
- Estimated rent
- $1,972 high interval (Pro) →
- Mortgage (P&I)
- −$918
- Tax from tax record
- −$181 /mo · $2,175/yr
- Insurance
- −$73
- HOA
- −$0
- Vacancy / Maint / Mgmt
- −$414
- Net cashflow
- $386
Break-even live
Sensitivity live
| Price | -10% $485 | -5% $435 | +0% $386 | +5% $336 | +10% $287 |
|---|---|---|---|---|---|
| Rent | -10% $230 | -5% $308 | +0% $386 | +5% $464 | +10% $542 |
| Rate | -1.0pp $474 | -0.5pp $430 | base $386 | +0.5pp $341 | +1.0pp $294 |
UW: 25.0% down · 7.5% · 30yr · 1.5% tax · 5.0% vac · 8.0% maint · 8.0% mgmt
Financing live
Cash to close
- Down payment
- $43,750
- Closing costs
- $5,250
- Reserves months
- —
- Total cash needed
- —
Loan-product check · same deal, 3 products live
Conventional
25% down · 7.5% · 30yr
- Down + closing
- —
- Monthly P&I
- —
- Monthly cashflow
- —
- DSCR
- —
- Eligible?
- —
Personal DTI + credit; lowest rate.
DSCR
20% down · 8.5% · 30yr
- Down + closing
- —
- Monthly P&I
- —
- Monthly cashflow
- —
- DSCR
- —
- Eligible?
- —
No personal income docs; deal must DSCR.
Hard money
10% down · 12.0% · 12mo
- Down + closing
- —
- Monthly P&I
- —
- Monthly cashflow
- —
- DSCR
- —
- Eligible?
- —
Short-term bridge; refi at stabilization.
Rent comps 22 comps
| Address | Beds | Baths | Sqft | Rent | $/sqft | DOM | Units | Dist |
|---|---|---|---|---|---|---|---|---|
| 2116 Nomad Ct SE Unit 2120 Salem, OR | 2.0 | 1.0 | 1050 | $1,425 | $1.36 | 16d | 1 | 0.35mi |
| 1900 Madras St SE Salem, OR | 1.0–3.0 | 1.0–2.0 | 895 | $1,615 | $1.80 | 16d | 10 | 0.56mi |
| 6127 Blue River Dr SE Salem, OR | 3.0 | 2.5 | 1531 | $2,450 | $1.60 | 46d | 1 | 0.64mi |
| 1951 Madras St SE Salem, OR | 2.0 | 2.5 | 1465 | $1,975 | $1.35 | 23d | 1 | 0.67mi |
| 1691 Waln Dr SE Salem, OR | 1.0–2.0 | 1.0–2.0 | 955 | $1,725 | $1.81 | 16d | 6 | 0.69mi |
| 6953 Talloc Ave SE Unit 6955 Salem, OR | 3.0 | 2.5 | 1418 | $2,295 | $1.62 | 16d | 1 | 0.73mi |
| 5943 Blue River Dr SE Salem, OR | 3.0 | 3.0 | 1472 | $2,395 | $1.63 | 46d | 1 | 0.76mi |
| 6150 Fircrest St SE Unit 6160 Salem, OR | 3.0 | 1.5 | 1140 | $2,050 | $1.80 | 16d | 1 | 0.82mi |
| 6150 Fircrest St SE Salem, OR | 3.0 | 1.5 | 1140 | $2,050 | $1.80 | 16d | 1 | 0.82mi |
| 5823 Reed Ln SE Unit 112 Salem, OR | 2.0 | 2.5 | 1198 | $1,995 | $1.67 | 25d | 1 | 0.87mi |
| 5815 Reed Ln SE Unit 133 Salem, OR | 2.0 | 2.5 | 1198 | $1,995 | $1.67 | 25d | 1 | 0.89mi |
| 1544 Fircrest Ct SE Salem, OR | 2.0 | 1.5 | 1296 | $1,850 | $1.43 | 25d | 1 | 0.90mi |
| 1410 Jonmart Ave SE Salem, OR | 3.0 | 2.0 | 1096 | $1,995 | $1.82 | 16d | 1 | 0.97mi |
| 1543 Wiltsey Rd SE Salem, OR | 2.0 | 1.0–2.0 | 1043 | $1,475 | $1.41 | 16d | 4 | 1.02mi |
| 2772 Bastille Ave SE Salem, OR | 3.0 | 2.0 | 1614 | $2,495 | $1.55 | 23d | 1 | 1.16mi |
| 5512 Murray St SE Salem, OR | 3.0 | 2.0 | 1275 | $2,645 | $2.07 | 23d | 1 | 1.19mi |
| 5442 Monterey Dr SE Unit 5442 Salem, OR | 2.0 | 2.0 | 1112 | $1,995 | $1.79 | 25d | 1 | 1.23mi |
| 5423 Monterey Dr SE Salem, OR | 3.0 | 2.0 | 1457 | $2,295 | $1.58 | 25d | 1 | 1.24mi |
| 2846 Vintage Ave SE Unit 2846 Salem, OR | 2.0 | 2.0 | 1105 | $1,895 | $1.71 | 46d | 1 | 1.34mi |
| 5787 Sunstone St SE Unit 5787 Salem, OR | 3.0 | 1.5 | 1192 | $1,645 | $1.38 | 25d | 1 | 1.41mi |
| 6755 Devon Ave SE Salem, OR | 3.0 | 2.0 | 2213 | $3,100 | $1.40 | 46d | 1 | 1.42mi |
| 1250 Baxter Rd SE Unit 1276 Salem, OR | 3.0 | 2.5 | 1289 | $2,395 | $1.86 | 16d | 1 | 1.49mi |
Listing history 24 events
-
2026-06-21days on market $175,000 Active 74 DOM
-
2026-06-18days on market $175,000 Active 71 DOM
-
2026-06-17days on market $175,000 Active 70 DOM
-
2026-06-16days on market $175,000 Active 69 DOM
-
2026-06-15days on market $175,000 Active 68 DOM
-
2026-06-14days on market $175,000 Active 66 DOM
-
2026-06-10days on market $175,000 Active 63 DOM
-
2026-06-09days on market $175,000 Active 62 DOM
-
2026-06-08days on market $175,000 Active 61 DOM
-
2026-06-07days on market $175,000 Active 60 DOM
-
2026-06-03days on market $175,000 Active 56 DOM
-
2026-06-02days on market $175,000 Active 55 DOM
-
2026-06-01days on market $175,000 Active 54 DOM
-
2026-05-31days on market $175,000 Active 53 DOM
-
2026-05-30days on market $175,000 Active 52 DOM
-
2026-05-02price $175,000 386-char remark
Show marketing remark (386 chars)
Terrace Lake Estates, a gated 55+ community. Offering a 2-car garage, spacious living and dining areas, and a fenced yard with a covered deck. Vaulted ceilings and skylights provide abundant natural light. The kitchen features built-in ovens and a cooktop, while the utility room includes a sink and access to the hall bath. The primary suite offers a walk-in closet and walk-in shower.
-
2026-04-08$197,000 Active 386-char remark
Show marketing remark (386 chars)
Terrace Lake Estates, a gated 55+ community. Offering a 2-car garage, spacious living and dining areas, and a fenced yard with a covered deck. Vaulted ceilings and skylights provide abundant natural light. The kitchen features built-in ovens and a cooktop, while the utility room includes a sink and access to the hall bath. The primary suite offers a walk-in closet and walk-in shower.
-
2026-02-10price $197,000
-
2022-08-22soldstatus $175,000 Sold
-
2022-07-27historical Active under Contract
-
2022-06-30price $189,900
-
2022-05-21price $194,900
-
2022-04-14$199,900 Active
-
1996-08-01soldstatus $72,000
ⓘ Source: listings_history table (triggers on properties + properties_extension) + one-shot
backfill from property_details.listing_events for pre-trigger history.
Tax reassessment forecast OR · Resets to sale price
- Current annual tax
- $2,175 · $181/mo
- Projected year-2 tax
- $2,175 · $181/mo
- Expected delta
- $0/yr ($0/mo · 0.0%)
ⓘ Screening estimate from a state-policy table — verify with the county assessor before closing.
Climate risk First Street
- Flood 5/10 Major FEMA zone X · 24% chance over 30 yrs
- Wildfire 3/10 Moderate
- Heat 3/10 Moderate 7 d/yr ≥91°F today · 15 d/yr by 30 yrs out
- Wind 1/10 Low
- Air quality 9/10 Extreme 12 unhealthy d/yr today · 13 by 30 yrs out
Nearby sold comps map
Loading sold comps map…
Walkable amenities ~0.75 mi
Loading nearby amenities…
Taxation est. · year 1
- Rental income
- $23,663
- − Mortgage interest
- −$9,803
- − Property taxes
- −$2,175
- − Insurance
- −$875
- − Repairs & maintenance
- −$1,893
- − Management
- −$1,893
- − Depreciation
- −$5,091
- Taxable income
- $1,934
- Est. tax owed @ 24.0%
- −$464
- After-tax cash flow
- $4,168/yr
For passive investors: Depreciation is non-cash, so a rental often shows a tax loss while cash-flowing — sheltering income. Rental losses are passive: they offset passive income freely, and up to $25,000/yr can offset ordinary (W-2) income if you actively participate and your MAGI is under $100k (phasing out to $0 by $150k); unused losses carry forward. On sale, claimed depreciation is recaptured at up to 25%, and gains may owe capital-gains tax (a 1031 exchange can defer both). Figures are a year-1 estimate at your 24.0% rate — not tax advice; consult a CPA.
Schools (NCES district)
- District
- Salem-Keizer SD 24J
- NCES district ID
- 4110820
- Math proficiency
- 34% ▼ -1.00%
- Reading proficiency
- 47% ▼ -2.00%
- Median HH income
- $48,632
- Composite
- 37.16/100
- National rank
- #9017
- State rank
- #103 of 183 in OR
Livability — Salem
- Score
- 79/100
- State rank
- #59
- US rank
- #2084
Category grades
Schools grade is shown separately in the Schools card above.
Census & demographics
- Census place
- Salem, OR
- County
- Marion County · 258,219 people
- City population
- 193,601
- Metro
- Salem, OR
- Population (ZIP)
- 34,383
- Household income
- $101,753
- Rent vs Own
- Severe rent burden
- 1437.0
Population outlook (Marion County) Hauer SSP2
- Today (2025)
- 360,940 people
- By 2030
- 375,178 · +3.9%
- By 2040
- 400,914 · +11.1%
- By 2050
- 422,187 · +17.0%
- By 2075
- 460,305 · +27.5%
- By 2100
- 464,025 · +28.6%
Race, ethnicity, and origin ACS 2023
- Neighborhood character
- Predominantly White (74%)
- Race & ethnicity
- White 74% Hispanic / Latino 12% Two or more races 9% Asian 5% Pacific Islander 2% Black 1%
- Hispanic origin (detail)
- Mexican 9%
- Common ancestry
- Italian 6% Portuguese 5% Slovak 3%
- Foreign-born
- 8% · Canada, China, Vietnam
- Languages at home
- 86% English-only · Spanish 6% Other Asian/Pacific 3% Russian/Polish/Slavic 1%
Political lean MEDSL · Marion
- 2024 margin
- Toss-up / Even · D 47.5% · R 49.5% · Other 3.0%
- 2008→2024 swing
- -4.2pp toward R · 2008: 2.2pp · 2024: -2.0pp
- All cycles
- 2024: R+2.0 2020: D+1.1 2016: R+5.0 2012: R+3.5 2008: D+2.2
Not yet ingested
- Civics
- —
Market trends
- HPI YoY
- ▼ -335.25%
- Current HPI
- 279.7875
- Rent YoY
- ▲ 1.64%
- Metro
- Salem, OR
- State GDP YoY
- ▲ 2.05%
- F500 in state
- 2
Industry mix (Fortune 500 HQ in OR)
| Industry | F500 HQs | Revenue |
|---|---|---|
| Consumer Goods | 1 | $51B |
|
||
Price history
+143.1% since first listed9 events — show timeline
- 2026-05-02 Price Changed $175,000 WVMLS
- 2026-04-08 Listed $197,000 WVMLS
- 2026-02-10 Price Changed $197,000 WVMLS
- 2022-08-22 Sold (MLS) $175,000 WVMLS
- 2022-07-27 Contingent — WVMLS
- 2022-06-30 Price Changed $189,900 WVMLS
- 2022-05-21 Price Changed $194,900 WVMLS
- 2022-04-14 Listed $199,900 WVMLS
- 1996-08-01 Sold (Public Records) $72,000 Public Records
Property tax history
+3.6%/yrLatest (2025): $2,175 · +7.7% YoY. Source: county tax records.
Cash-flow waterfall
monthlySold comps — $/sqft
last 12 mo · ≤1 miLoading sold comps…