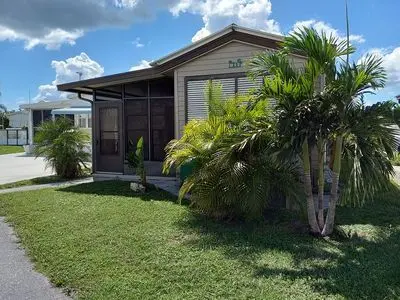
1475 Flamingo Dr · Englewood, FL
Flood risk 7/10 · Major
- FEMA flood zone
- X (shaded)
- Chance of flooding over 30 yrs
- 0.95%
- Est. flood insurance / yr
- $507 – $1,088
Fire risk 5/10 · Moderate
- Est. fire insurance / yr
- $947 – $1,759
Heat risk 10/10 · Severe
- Hot days now (above 107°F)
- 7 days/yr
- Hot days in 30 yrs
- 29 days/yr
Wind risk 10/10 · Severe
- Chance of severe wind over 30 yrs
- 99.0%
Air-quality risk 2/10 · Minimal
- Unhealthy air days now
- 1 days/yr
- Unhealthy air days in 30 yrs
- 1 days/yr
Risk factors via First Street. Map © Google.
Why this score? — see what drove the B grade
The composite is a weighted blend of 9 inputs, each scored 0–100. Each bar is that input's sub-score; the figure is the points it added to the 100-point composite (weight × sub-score).
- Cash flow +30.0/30.0
- 1% rule +10.0/10.0
- DSCR +10.0/10.0
- ARV discount +7.5/15.0
- Schools +4.6/10.0
- Livability +3.7/5.0
- Rent growth +2.5/5.0
- Condition / age +2.5/5.0
- Appreciation +0.0/10.0
$89,000
🖨 Deal sheet (PDF) 📄 Offer letter ✓ Due diligence
Listing remarks MLS
55+active community only 3 miles to Englewood Beach! You own the lot and unit, HOA only $140 month which includes water, septic, park maintenance, pool, club house, pickleball, shuffleboard and lots more! Great location close to grocery, stores and restaurants all within walking distance. This modular home is roomy and comfortable, clean, non-smoking with central A/C & heat, all appliances work, storage shed with washer/dryer, nice carport and a great neighborhood! Unit is turn-key furnished and move-in ready. No damage from Hurricane Helene or Milton. This unit is rental able monthly or annually, pets allowed. Owners motivated.
Key facts
- Hoa includes water
- Hoa includes pool
- Own the lot
Tags
Property features AI
Exterior
- Home design: Built in 1986
- Construction: Living area of 416
- Exterior features: Located in the Englewood South subdivision
Neighborhood map
What this means for you Summary
Snapshot
- This is a 1-bed/2.0-bath other listed at $89k.
Deal economics
- At list price, monthly cash flow is $493 ($6k/yr) — positive.
- The deal already cash-flows at list — no discount required.
- Meets the 1% rule at list price ($1k rent vs $89k).
- Recommended offer: $78k (12.0% below list) — sets the bar for market timing.
- Cap rate 13.8% vs local median 3.8% in Englewood — top-decile yield for the area; either an underpriced asset or a hidden risk that comps aren't pricing in. Stress-test before assuming the spread holds.
Location & tenants
- Location reads 73/100 on livability (#321 in FL) — a middle-class / working-renter tenant base. Strengths: housing A+, cost of living A, health & safety A; Watch: employment C-, amenities F, commute F.
- Charlotte (suburban): math 54% / reading 54% proficiency, ranked #22 of 73 in FL (top 30%) — acceptable for families but not a draw, mixed tenant base, ~2y average lease.
- Zoned schools: Myakka River Elementary School (math 65% / reading 60%, grade B, #601 of 2,144 statewide, top 28%, 608 students, 51% FRL); L. A. Ainger Middle School (math 65% / reading 53%, grade B, #144 of 571 statewide, top 26%, 720 students, 40% FRL); Lemon Bay High School (math 50% / reading 56%, grade C-, #148 of 667 statewide, top 23%, 1,360 students, 28% FRL).
- Market conditions: Rents soft (-0.1%/yr); 737 active listings in the ZIP; 4,585 units permitted in Charlotte County in 2024 (703 in 5+ unit buildings).
Forward outlook
- Local home prices are declining (-3.0%/yr); year-one equity from $615 of loan paydown is wiped out by about $3k of value loss. Plan a longer hold.
- Charlotte County population projected at +24% by 2050 — long-run rental-demand tailwind backs the buy-and-hold thesis.
- At projected returns (-3.0% appreciation + 0.0% rent growth), your $25k cash investment doubles in ~7 years — after that, you're playing with house money.
Negotiation context
- It's been on market 171 days — a 12% lower offer ($78k) is reasonable based on typical stale-listing flexibility.
- 26 sale attempts since 22y ago; this cycle's ask has dropped $10k (10%) from the opening price — seller is motivated, your offer sets the floor, not the list.
- Current owner paid $31k; list at $89k implies a 187% gain — meaningful room to come down on a strong offer.
Risks & watch-outs
- Watch-outs: flood insurance adds $66/mo.
- Climate carrying-cost: major flood risk; severe wind risk, 99% chance of damaging wind over 30y; moderate wildfire risk; extreme-heat days projected 7→29/yr by 2055 (HVAC capex compounding) — expect insurance premiums to compound above CPI over the hold.
Questions for the listing agent
- It's been on market 171 days. Have you received any prior offers? Is the seller open to a 12% concession, seller financing, or rate buy-down credit?
- What's the actual annual flood-insurance premium (NFIP or private), and is the property in a SFHA with mandatory coverage?
- Why hasn't it sold? Are there any deal-killer items the seller is aware of (foundation, flood, title, zoning, code violations)?
- Is there a deadline driving the sale (1031 exchange, divorce, estate, relocation)? That informs how much negotiation room exists.
- Schools are A-rated — typically a magnet for longer-tenancy family renters. What's the average tenant stay here, and is there a school-zone premium baked into asking?
- What's the average days-on-market for RENTAL listings here right now (not sales)? A rising rental-DOM trend means longer vacancies and softer asking-rent achievability than the comps imply.
- What's the recent tenant-quality profile in this submarket — average credit score on applications, eviction rate, late-payment / NSF rate, and stable-employment percentage? A property-management company in the area should have these aggregated.
- How much new for-sale + rental construction is in the pipeline within 1–3 miles? Heavy new supply typically softens prices + rents 12–24 months out; constrained supply supports both.
Investment metrics
- 1% rule
- 1.54% ✓
- Cap rate
- 13.84%
- Cash-on-cash
- 26.95%
- DSCR
- 2.20
- GRM
- 5.4
CMA / ARV
No comps found within radius.
Projected returns pro-forma
-3.0% appreciation · 0.0% rent growth · sell at horizon
- IRR
- 13.5%
- Equity multiple
- 1.52×
- Total profit
- $12,971
- Equity at exit
- $13,270
- IRR
- 20.0%
- Equity multiple
- 2.45×
- Total profit
- $36,207
- Equity at exit
- $7,695
Cash invested: $24,920 (down + closing). Projections, not guarantees.
Landlord ↔ Tenant lean methodology
- Overall (STATE)
- 87 Strongly Landlord-Friendly
- State Florida
- 87 Strongly Landlord-Friendly · R+3
- County
- — inherits STATE
- City
- — inherits STATE
ZIP-level market 34224
- Home prices YoY
- -18.9%
- Rents YoY
- -0.1%
- Active inventory
- 737
- Price-to-rent
- 5.4×
Monthly cashflow live
- Estimated rent
- $1,374 medium interval (Pro) →
- Mortgage (P&I)
- −$467
- Tax from tax record
- −$22 /mo · $266/yr
- Insurance
- −$37
- Flood insurance flood zone
- −$66 /mo · $798/yr
- HOA
- −$0
- Vacancy / Maint / Mgmt
- −$289
- Net cashflow
- $493
Break-even live
Sensitivity live
| Price | -10% $544 | -5% $518 | +0% $493 | +5% $468 | +10% $443 |
|---|---|---|---|---|---|
| Rent | -10% $385 | -5% $439 | +0% $493 | +5% $547 | +10% $602 |
| Rate | -1.0pp $538 | -0.5pp $516 | base $493 | +0.5pp $470 | +1.0pp $447 |
UW: 25.0% down · 7.5% · 30yr · 1.5% tax · 5.0% vac · 8.0% maint · 8.0% mgmt
Financing live
Cash to close
- Down payment
- $22,250
- Closing costs
- $2,670
- Reserves months
- —
- Total cash needed
- —
Loan-product check · same deal, 3 products live
Conventional
25% down · 7.5% · 30yr
- Down + closing
- —
- Monthly P&I
- —
- Monthly cashflow
- —
- DSCR
- —
- Eligible?
- —
Personal DTI + credit; lowest rate.
DSCR
20% down · 8.5% · 30yr
- Down + closing
- —
- Monthly P&I
- —
- Monthly cashflow
- —
- DSCR
- —
- Eligible?
- —
No personal income docs; deal must DSCR.
Hard money
10% down · 12.0% · 12mo
- Down + closing
- —
- Monthly P&I
- —
- Monthly cashflow
- —
- DSCR
- —
- Eligible?
- —
Short-term bridge; refi at stabilization.
Listing history 50 events
-
2026-06-22days on market $89,000 Active 171 DOM
-
2026-06-18days on market $89,000 Active 168 DOM
-
2026-06-17days on market $89,000 Active 167 DOM
-
2026-06-16remarks 641-char remark
-
2026-06-16pricedays on market $89,000 Active 166 DOM
-
2026-06-16days on market $95,000 Active 35 DOM
-
2026-06-15days on market $95,000 Active 34 DOM
-
2026-06-14days on market $95,000 Active 32 DOM
-
2026-06-13days on market $95,000 Active 31 DOM
-
2026-06-10days on market $95,000 Active 29 DOM
-
2026-06-09days on market $95,000 Active 28 DOM
-
2026-06-08days on market $95,000 Active 27 DOM
-
2026-06-05days on market $95,000 Active 23 DOM
-
2026-06-02days on market $95,000 Active 21 DOM
-
2026-06-01days on market $95,000 Active 20 DOM
-
2026-05-31days on market $95,000 Active 19 DOM
-
2026-05-30days on market $95,000 Active 18 DOM
-
2026-05-13price $95,000
-
2026-05-12$98,500 Active
-
2026-01-01$89,000 Active 645-char remark
Show marketing remark (645 chars)
55+active community only 3 miles to Englewood Beach! You own the lot and unit, HOA only $140 month which includes water, septic, park maintenance, pool, club house, pickleball, shuffleboard and lots more! Great location close to grocery, stores and restaurants all within walking distance. This modular home is roomy and comfortable, clean, non-smoking with central A/C & heat, all appliances work, storage shed with washer/dryer, nice carport and a great neighborhood! Unit is turn-key furnished and move-in ready. No damage from Hurricane Helene or Milton. This unit is rental able monthly or annually, pets allowed. Owners motivated.
-
2010-04-16soldstatus $31,000 203-char remark
Show marketing remark (203 chars)
Seems so big with finished lani aera with washer and dryer. call and see then lets make a deal. turnkey furnished. Pool , clubhouse public boat dock, aintense includes water sewer, lawn, rec bld and pool
-
2010-03-04soldstatus $19,000
-
2009-08-18$23,000
-
2009-08-10$42,000
-
2009-07-10soldstatus $20,500
-
2009-06-05$24,000
-
2009-05-21$37,001 203-char remark
Show marketing remark (203 chars)
Seems so big with finished lani aera with washer and dryer. call and see then lets make a deal. turnkey furnished. Pool , clubhouse public boat dock, aintense includes water sewer, lawn, rec bld and pool
-
2009-05-09$64,900
-
2008-06-27historical
-
2008-05-01$55,000
-
2008-04-20$74,900
-
2008-02-26$33,600
-
2008-01-09$45,000
-
2007-11-14soldstatus $35,000
-
2007-09-17soldstatus $32,500
-
2007-07-20$44,000
-
2007-05-11soldstatus $37,500
-
2007-04-27soldstatus $87,500
-
2007-04-26$34,900
-
2007-03-31historical
-
2007-03-15soldstatus $38,000
-
2007-03-15$77,900
-
2007-03-08soldstatus $49,900
-
2007-02-24$99,900
-
2007-02-23$99,900
-
2007-01-02$40,000
-
2006-11-21$53,900
-
2006-11-03$42,500
-
2006-03-21soldstatus $57,500
-
2006-02-01$53,900
ⓘ Source: listings_history table (triggers on properties + properties_extension) + one-shot
backfill from property_details.listing_events for pre-trigger history.
Tax reassessment forecast FL · Resets to sale price
- Current annual tax
- $266 · $22/mo
- Projected year-2 tax
- $739 · $62/mo
- Expected delta
- +$472/yr (+$39/mo · 177.4%)
ⓘ Screening estimate from a state-policy table — verify with the county assessor before closing.
Climate risk First Street
- Flood 7/10 Severe FEMA zone X (shaded) · 95% chance over 30 yrs
- Wildfire 5/10 Major
- Heat 10/10 Extreme 7 d/yr ≥107°F today · 29 d/yr by 30 yrs out
- Wind 10/10 Extreme 99% chance of damaging wind over 30 yrs
- Air quality 2/10 Low 1 unhealthy d/yr today · 1 by 30 yrs out
Nearby sold comps map
Loading sold comps map…
Walkable amenities ~0.75 mi
Loading nearby amenities…
Taxation est. · year 1
- Rental income
- $16,491
- − Mortgage interest
- −$4,985
- − Property taxes
- −$266
- − Insurance
- −$1,242
- − Repairs & maintenance
- −$1,319
- − Management
- −$1,319
- − Depreciation
- −$2,589
- Taxable income
- $4,769
- Est. tax owed @ 24.0%
- −$1,145
- After-tax cash flow
- $4,774/yr
For passive investors: Depreciation is non-cash, so a rental often shows a tax loss while cash-flowing — sheltering income. Rental losses are passive: they offset passive income freely, and up to $25,000/yr can offset ordinary (W-2) income if you actively participate and your MAGI is under $100k (phasing out to $0 by $150k); unused losses carry forward. On sale, claimed depreciation is recaptured at up to 25%, and gains may owe capital-gains tax (a 1031 exchange can defer both). Figures are a year-1 estimate at your 24.0% rate — not tax advice; consult a CPA.
Schools (NCES district)
- District
- Charlotte
- NCES district ID
- 1200240
- Math proficiency
- 54% ▼ -6.00%
- Reading proficiency
- 54% ▼ -1.00%
- Median HH income
- $44,864
- Composite
- 45.62/100
- National rank
- #2586
- State rank
- #22 of 73 in FL
Livability — Englewood
- Score
- 73/100
- State rank
- #321
- US rank
- #5655
Category grades
Schools grade is shown separately in the Schools card above.
Census & demographics
- Census place
- Englewood, FL
- County
- Charlotte County · 196,994 people
- City population
- 35,420
- Metro
- Punta Gorda, FL
- Population (ZIP)
- 15,536
- Household income
- $57,281
- Rent vs Own
- Severe rent burden
- 329.0
Population outlook (Charlotte County) Hauer SSP2
- Today (2025)
- 198,646 people
- By 2030
- 210,507 · +6.0%
- By 2040
- 230,857 · +16.2%
- By 2050
- 247,148 · +24.4%
- By 2075
- 281,777 · +41.8%
- By 2100
- 293,609 · +47.8%
Race, ethnicity, and origin ACS 2023
- Neighborhood character
- Predominantly White (92%)
- Race & ethnicity
- White 92% Two or more races 5% Hispanic / Latino 3% Asian 1%
- Common ancestry
- Romanian 4% Slovak 4% Lithuanian 4%
- Foreign-born
- 9% · Canada
- Languages at home
- 92% English-only · Other Indo-European 2% Spanish 2% German/W. Germanic 1%
Political lean MEDSL · Charlotte
- 2024 margin
- Solid R (+34.0) · D 32.7% · R 66.7%
- 2008→2024 swing
- -26.7pp toward R · 2008: -7.2pp · 2024: -34.0pp
- All cycles
- 2024: R+34.0 2020: R+26.6 2016: R+27.8 2012: R+14.3 2008: R+7.2
Not yet ingested
- Civics
- —
Market trends
- HPI YoY
- ▼ -75.76%
- Current HPI
- 325.0345
- Rent YoY
- ▼ -0.11%
- Metro
- Punta Gorda, FL
- State GDP YoY
- ▲ 3.28%
- F500 in state
- 36
Industry mix (Fortune 500 HQ in FL)
| Industry | F500 HQs | Revenue |
|---|---|---|
| Industrial Technology | 2 | $29B |
|
||
| Insurance | 2 | $17B |
|
||
| Retail | 1 | $60B |
|
||
| Technology Distribution | 1 | $58B |
|
||
| Homebuilding | 1 | $35B |
|
||
| Technology Manufacturing | 1 | $35B |
|
||
Price history
+280.0% since first listed43 events — show timeline
- 2026-05-13 Price Changed $95,000 FSBO.com
- 2026-05-12 Listed $98,500 FSBO.com
- 2026-01-01 Listed $89,000 ForSaleByOwner.com
- 2010-04-16 Sold (MLS) $31,000 Stellar MLS as Distributed by MLS Grid
- 2010-03-04 Sold (MLS) $19,000 Stellar MLS as Distributed by MLS Grid
- 2009-08-18 Listed $23,000 Stellar MLS as Distributed by MLS Grid
- 2009-08-10 Listed $42,000 Stellar MLS as Distributed by MLS Grid
- 2009-07-10 Sold (MLS) $20,500 Stellar MLS as Distributed by MLS Grid
- 2009-06-05 Listed $24,000 Stellar MLS as Distributed by MLS Grid
- 2009-05-21 Listed $37,001 Stellar MLS as Distributed by MLS Grid
- 2009-05-09 Listed $64,900 Stellar MLS as Distributed by MLS Grid
- 2008-06-27 Listing Removed — Stellar MLS as Distributed by MLS Grid
- 2008-05-01 Listed $55,000 Stellar MLS as Distributed by MLS Grid
- 2008-04-20 Listed $74,900 Stellar MLS as Distributed by MLS Grid
- 2008-02-26 Listed $33,600 Stellar MLS as Distributed by MLS Grid
- 2008-01-09 Listed $45,000 Stellar MLS as Distributed by MLS Grid
- 2007-11-14 Sold (MLS) $35,000 Stellar MLS as Distributed by MLS Grid
- 2007-09-17 Sold (MLS) $32,500 Stellar MLS as Distributed by MLS Grid
- 2007-07-20 Listed $44,000 Stellar MLS as Distributed by MLS Grid
- 2007-05-11 Sold (MLS) $37,500 Stellar MLS as Distributed by MLS Grid
- 2007-04-27 Sold (MLS) $87,500 Stellar MLS as Distributed by MLS Grid
- 2007-04-26 Listed $34,900 Stellar MLS as Distributed by MLS Grid
- 2007-03-31 Listing Removed — Stellar MLS as Distributed by MLS Grid
- 2007-03-15 Listed $77,900 Stellar MLS as Distributed by MLS Grid
- 2007-03-15 Sold (MLS) $38,000 Stellar MLS as Distributed by MLS Grid
- 2007-03-08 Sold (MLS) $49,900 Stellar MLS as Distributed by MLS Grid
- 2007-02-24 Listed $99,900 Stellar MLS as Distributed by MLS Grid
- 2007-02-23 Listed $99,900 Stellar MLS as Distributed by MLS Grid
- 2007-01-02 Listed $40,000 Stellar MLS as Distributed by MLS Grid
- 2006-11-21 Listed $53,900 Stellar MLS as Distributed by MLS Grid
- 2006-11-03 Listed $42,500 Stellar MLS as Distributed by MLS Grid
- 2006-03-21 Sold (MLS) $57,500 Stellar MLS as Distributed by MLS Grid
- 2006-02-01 Listed $53,900 Stellar MLS as Distributed by MLS Grid
- 2006-01-27 Listed $75,000 Stellar MLS as Distributed by MLS Grid
- 2006-01-10 Listed $62,000 Stellar MLS as Distributed by MLS Grid
- 2006-01-09 Sold (MLS) $45,000 Stellar MLS as Distributed by MLS Grid
- 2005-09-20 Listed $54,900 Stellar MLS as Distributed by MLS Grid
- 2005-06-28 Sold (MLS) $54,000 Stellar MLS as Distributed by MLS Grid
- 2005-06-16 Sold (MLS) $69,900 Stellar MLS as Distributed by MLS Grid
- 2005-05-03 Listed $74,900 Stellar MLS as Distributed by MLS Grid
- 2005-03-22 Listed $59,900 Stellar MLS as Distributed by MLS Grid
- 2004-11-16 Listed $74,900 Stellar MLS as Distributed by MLS Grid
- 2004-06-15 Sold (MLS) $25,000 Stellar MLS as Distributed by MLS Grid
Property tax history
+15.6%/yrLatest (2025): $266 · +7.5% YoY. Source: county tax records.
Cash-flow waterfall
monthlySold comps — $/sqft
last 12 mo · ≤1 miLoading sold comps…