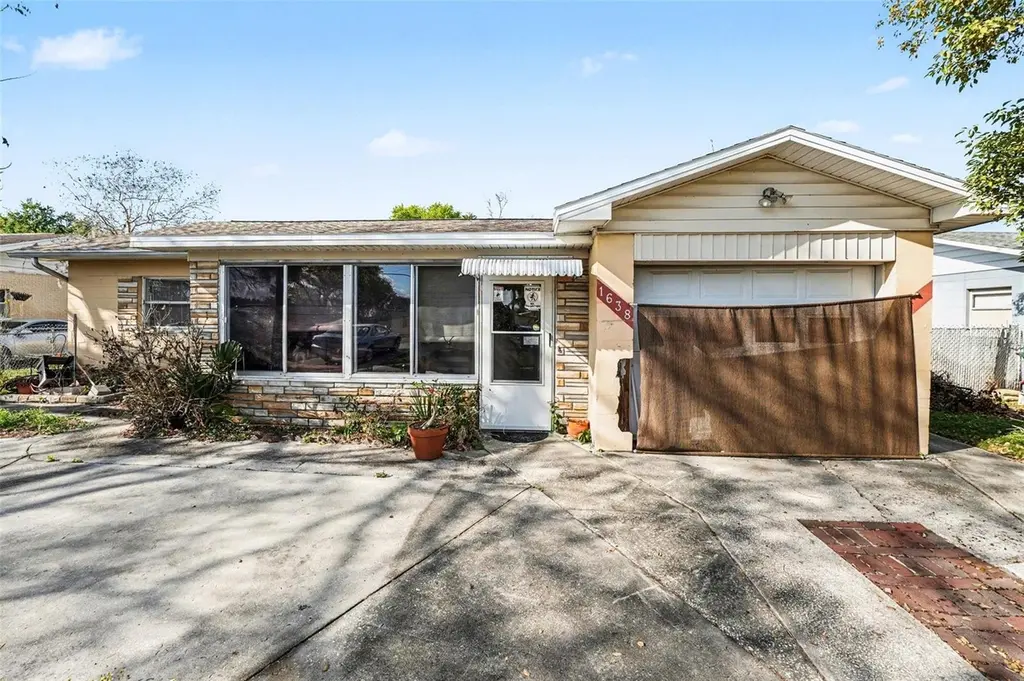
1638 E Main St · Lakeland, FL
Flood risk 1/10 · Minimal
- FEMA flood zone
- X (unshaded)
- Chance of flooding over 30 yrs
- 0.0%
- Est. flood insurance / yr
- $507 – $1,088
Fire risk 1/10 · Minimal
- Est. fire insurance / yr
- $947 – $1,759
Heat risk 8/10 · Major
- Hot days now (above 108°F)
- 7 days/yr
- Hot days in 30 yrs
- 24 days/yr
Wind risk 10/10 · Severe
- Chance of severe wind over 30 yrs
- 99.0%
Air-quality risk 2/10 · Minimal
- Unhealthy air days now
- 1 days/yr
- Unhealthy air days in 30 yrs
- 2 days/yr
Risk factors via First Street. Map © Google.
Why this score? — see what drove the D grade
The composite is a weighted blend of 9 inputs, each scored 0–100. Each bar is that input's sub-score; the figure is the points it added to the 100-point composite (weight × sub-score).
- Cash flow +13.5/30.0
- ARV discount +7.5/15.0
- DSCR +4.1/10.0
- Livability +3.9/5.0
- 1% rule +3.7/10.0
- Schools +3.5/10.0
- Rent growth +2.8/5.0
- Condition / age +2.5/5.0
- Appreciation +0.0/10.0
$200,000
🖨 Deal sheet 📄 Offer letter ✓ Due diligence
Listing remarks MLS
ENJOY VIEW OF LK BONNY FROM FRONT OF HOME. PUBLIC BOAT RAMP ACROSS THE STREET. FL. RM ON BACK OF HOUSE. FENCED BACK YARD. CONVENIENT LOCATION. TILED THRU OUT. SEMI CIRCLE DRIVEWAY. STROLL TO INTERLACHEN PARK AND PLAYGROUND. HUD property sold as-is. Sold subject to rules and regulations of HUD. FHA ELIGIBLE WITH $2750 REPAIR ESCROW HUD CASE - 093-629181
Key facts
- Screened front porch
- Ensuite half bath
- Concrete patio
Tags
Property features AI
Finance
- Other: Property type: Residential, single family; Zoning: RA-3; Living area approximately 1,268 square feet
- HOA & community: No association indicated
Exterior
- Parking: Attached garage with 1 garage space
- Utilities: Public water; Public sewer; Cable available; Electricity available; Phone service available
- Home design: Single-family residence; One story; Faces southwest
- Construction: Brick and other exterior materials; Shingle roof; Slab foundation; Built on 0.17-acre lot
- Exterior features: Sidewalk; Paved lot; Asphalt road access
Interior
- Kitchen: Range
- Bedrooms: 4 bedrooms
- Flooring: Tile
- Bathrooms: 2 full bathrooms
- Heating & cooling: Central heating; Central air conditioning
- Interior features: Ceiling fans
- Laundry & utility: Laundry room inside
Neighborhood map
What this means for you Summary
Snapshot
- This is a 3-bed/1.0-bath single-family listed at $200k.
Deal economics
- At list price, monthly cash flow is $6 ($76/yr) — positive.
- The deal already cash-flows at list — no discount required.
- To meet the 1% rule (rent ≥ 1% of price), the offer needs to be $175k (12.5% below list).
- Recommended offer: $175k (12.5% below list) — sets the bar for 1% rule.
Location & tenants
- Location reads 77/100 on livability (#206 in FL, #3,179 nationally) — a middle-class / working-renter tenant base. Strengths: cost of living A+, housing A+, health & safety A+; Watch: employment D+, amenities F, commute F.
- Polk (suburban): math 39% / reading 43% proficiency, ranked #62 of 73 in FL (top 85%) — families likely to look elsewhere, expect single-tenant / working-renter base with shorter leases.
- Market conditions: Rents rising (+1.1%/yr); 253 active listings in the ZIP; 30 comparable units currently listed for rent nearby; rentals at typical pace (median 19d on market — plan ~3-4 weeks tenant-placement turnaround); 10,384 units permitted in Polk County in 2024 (1,716 in 5+ unit buildings).
- This rent runs 40% of the median local income ($53k/yr) — at the standard rent-burdened threshold; future hikes will face affordability resistance.
Forward outlook
- Local home prices are declining (-3.0%/yr); year-one equity from $1k of loan paydown is wiped out by about $6k of value loss. Plan a longer hold.
- Polk County population projected at +33% by 2050 — long-run rental-demand tailwind backs the buy-and-hold thesis.
Negotiation context
- It's been on market 59 days — a 3% lower offer ($194k) is reasonable based on typical stale-listing flexibility.
- 6 sale attempts since 19y ago; this cycle's ask has dropped $25k (11%) from the opening price — seller is motivated, your offer sets the floor, not the list.
- Current owner paid $49k; list at $200k implies a 308% gain — meaningful room to come down on a strong offer.
Risks & watch-outs
- Watch-outs: built in 1955 — expect roof / HVAC / electrical / plumbing capex.
- Climate carrying-cost: severe wind risk, 99% chance of damaging wind over 30y; extreme-heat days projected 7→24/yr by 2055 (HVAC capex compounding) — expect insurance premiums to compound above CPI over the hold.
Questions for the listing agent
- It's been on market 59 days. Have you received any prior offers? Is the seller open to a 13% concession, seller financing, or rate buy-down credit?
- Built in 1955 — when were the roof, HVAC, electrical panel, plumbing, and water heater last replaced?
- Is there a deadline driving the sale (1031 exchange, divorce, estate, relocation)? That informs how much negotiation room exists.
- The area grade is low — what's the realistic commute time and amenity access for the typical tenant pool here? Any planned neighborhood developments (good or bad) we should know about?
- What's the average days-on-market for RENTAL listings here right now (not sales)? A rising rental-DOM trend means longer vacancies and softer asking-rent achievability than the comps imply.
- What's the recent tenant-quality profile in this submarket — average credit score on applications, eviction rate, late-payment / NSF rate, and stable-employment percentage? A property-management company in the area should have these aggregated.
- How much new for-sale + rental construction is in the pipeline within 1–3 miles? Heavy new supply typically softens prices + rents 12–24 months out; constrained supply supports both.
Investment metrics
- 1% rule
- 0.87% ✗
- Cap rate
- 6.33%
- Cash-on-cash
- 0.14%
- DSCR
- 1.01
- GRM
- 9.5
CMA / ARV
No comps found within radius.
Projected returns pro-forma
-3.0% appreciation · 1.05% rent growth · sell at horizon
- IRR
- -18.3%
- Equity multiple
- 0.37×
- Total profit
- $-35,351
- Equity at exit
- $29,821
- IRR
- -14.9%
- Equity multiple
- 0.22×
- Total profit
- $-43,460
- Equity at exit
- $17,292
Cash invested: $56,000 (down + closing). Projections, not guarantees.
Landlord ↔ Tenant lean methodology
- Overall (STATE)
- 87 Strongly Landlord-Friendly
- State Florida
- 87 Strongly Landlord-Friendly · R+3
- County
- — inherits STATE
- City
- — inherits STATE
ZIP-level market 33801
- Home prices YoY
- -15.9%
- Rents YoY
- 1.1%
- Active inventory
- 253
- Price-to-rent
- 9.5×
Monthly cashflow live
- Estimated rent
- $1,749 high interval (Pro) →
- Mortgage (P&I)
- −$1,049
- Tax from tax record
- −$243 /mo · $2,921/yr
- Insurance
- −$83
- HOA
- −$0
- Vacancy / Maint / Mgmt
- −$367
- Net cashflow
- $6
Break-even live
UW: 25.0% down · 7.5% · 30yr · 1.5% tax · 5.0% vac · 8.0% maint · 8.0% mgmt
Financing live
Cash to close
- Down payment
- $50,000
- Closing costs
- $6,000
- Reserves months
- —
- Total cash needed
- —
Loan-product check · same deal, 3 products live
Conventional
25% down · 7.5% · 30yr
- Down + closing
- —
- Monthly P&I
- —
- Monthly cashflow
- —
- DSCR
- —
- Eligible?
- —
Personal DTI + credit; lowest rate.
DSCR
20% down · 8.5% · 30yr
- Down + closing
- —
- Monthly P&I
- —
- Monthly cashflow
- —
- DSCR
- —
- Eligible?
- —
No personal income docs; deal must DSCR.
Hard money
10% down · 12.0% · 12mo
- Down + closing
- —
- Monthly P&I
- —
- Monthly cashflow
- —
- DSCR
- —
- Eligible?
- —
Short-term bridge; refi at stabilization.
Rent comps 30 comps
| Address | Beds | Baths | Sqft | Rent | $/sqft | DOM | Units | Dist |
|---|---|---|---|---|---|---|---|---|
| 350 Bonnyview Dr Lakeland, FL | 3.0 | 2.0 | 1284 | $1,600 | $1.25 | 23d | 1 | 0.50mi |
| 1222 E Lemon St Lakeland, FL | 3.0 | 2.0 | 1168 | $1,550 | $1.33 | 13d | 1 | 0.57mi |
| 1306 Golconda Rd Lakeland, FL | 2.0 | 1.0 | 1458 | $1,400 | $0.96 | 23d | 1 | 0.70mi |
| 1211 Jaffa St Lakeland, FL | 3.0 | 2.0 | 1341 | $1,850 | $1.38 | 14d | 1 | 0.75mi |
| 510 Longfellow Blvd Lakeland, FL | 3.0 | 2.0 | 1315 | $1,825 | $1.39 | 3d | 1 | 0.85mi |
| 446 Francis Blvd Lakeland, FL | 2.0 | 1.0 | 1499 | $1,150 | $0.77 | 3d | 1 | 0.88mi |
| 2155 Lone Oak Ln Lakeland, FL | 3.0 | 2.0 | 1486 | $2,100 | $1.41 | 23d | 1 | 0.88mi |
| 923 E Lemon St Lakeland, FL | 2.0 | 1.5 | 962 | $1,599 | $1.66 | 23d | 1 | 0.96mi |
| 936 E Lime St Lakeland, FL | 3.0 | 2.0 | 1045 | $1,375 | $1.32 | 23d | 1 | 0.97mi |
| 2023 Tennyson St Unit 2025 Lakeland, FL | 2.0 | 1.0 | 884 | $1,095 | $1.24 | 23d | 1 | 0.98mi |
| 915 E Lemon St Lakeland, FL | 2.0 | 1.5 | 962 | $1,599 | $1.66 | 23d | 1 | 0.99mi |
| 2184 Colonial Ave Lakeland, FL | 3.0 | 2.0 | 1123 | $1,645 | $1.46 | 23d | 1 | 1.01mi |
| 1108 Bartow Rd Lakeland, FL | 1.0–2.0 | 1.0 | 797 | $1,395 | $1.75 | 3d | 2 | 1.02mi |
| 821 Hollingsworth Rd Lakeland, FL | 2.0 | 2.0 | 1238 | $2,200 | $1.78 | 19d | 1 | 1.03mi |
| 506 S McKay Ave Lakeland, FL | 2.0 | 2.0 | 885 | $1,700 | $1.92 | 23d | 1 | 1.05mi |
| 722 S Ingraham Ave Unit 720ING Lakeland, FL | 2.0 | 1.0 | 900 | $1,345 | $1.49 | 14d | 1 | 1.07mi |
| 1048 Lexington St Lakeland, FL | 2.0 | 2.0 | 1125 | $3,100 | $2.76 | 3d | 1 | 1.09mi |
| 635 Meridian Ave Lakeland, FL | 3.0 | 2.0 | 1206 | $1,750 | $1.45 | 3d | 1 | 1.20mi |
| 1836 N Crystal Lake Dr #112 Lakeland, FL | 3.0 | 3.0 | 1482 | $2,000 | $1.35 | 23d | 1 | 1.20mi |
| 709 Park Hill Ave Lakeland, FL | 3.0 | 1.0 | 1114 | $1,545 | $1.39 | 3d | 1 | 1.21mi |
| 1188 Oak Hammock Unit 1 Lakeland, FL | 3.0 | 2.5 | 1674 | $1,850 | $1.11 | 23d | 1 | 1.21mi |
| 1186 Oak Hammock Ln Lakeland, FL | 3.0 | 2.5 | 1674 | $1,850 | $1.11 | 23d | 1 | 1.21mi |
| 1836 N Crystal Lake Dr #5 Lakeland, FL | 3.0 | 2.5 | 1482 | $1,695 | $1.14 | 23d | 1 | 1.22mi |
| 929 Gilmore Ave Lakeland, FL | 2.0 | 1.0–1.5 | 620 | $1,280 | $2.06 | 2d | 20 | 1.24mi |
| 1836 N Crystal Lake Dr Unit 3 Lakeland, FL | 2.0 | 1.5 | 1158 | $1,495 | $1.29 | 14d | 1 | 1.27mi |
| 600 E Bay St Lakeland, FL | 3.0 | 1.0–2.0 | 914 | $2,417 | $2.64 | 3d | 29 | 1.29mi |
| 1233 Honeytree Ln E Lakeland, FL | 3.0 | 2.0 | 1355 | $2,250 | $1.66 | 3d | 1 | 1.31mi |
| 728 Johnson Ave Unit 1234479P Lakeland, FL | 2.0 | 1.0 | 893 | $6,611 | $7.40 | 14d | 1 | 1.33mi |
| 1885 N Crystal Lake Dr Apt 7 Lakeland, FL | 2.0 | 1.5 | 900 | $1,395 | $1.55 | 23d | 1 | 1.47mi |
| 270 E Bay St Lakeland, FL | 2.0 | 1.0–2.0 | 892 | $1,725 | $1.93 | 3d | 6 | 1.50mi |
Listing history 19 events
-
2026-05-31remarks 699-char remark
-
2026-05-31status $200,000 Pending 59 DOM
-
2026-05-19status Active
-
2026-05-14status Pending
-
2026-05-06price $200,000
-
2026-04-12price $215,000
-
2026-03-27$225,000 Active
-
2026-01-11historical
-
2025-12-23status Active
-
2025-11-18status Pending
-
2025-11-13$200,000 Active
-
2010-09-30soldstatus $49,000 355-char remark
Show marketing remark (355 chars)
ENJOY VIEW OF LK BONNY FROM FRONT OF HOME. PUBLIC BOAT RAMP ACROSS THE STREET. FL. RM ON BACK OF HOUSE. FENCED BACK YARD. CONVENIENT LOCATION. TILED THRU OUT. SEMI CIRCLE DRIVEWAY. STROLL TO INTERLACHEN PARK AND PLAYGROUND. HUD property sold as-is. Sold subject to rules and regulations of HUD. FHA ELIGIBLE WITH $2750 REPAIR ESCROW HUD CASE - 093-629181
-
2010-08-20$49,000 355-char remark
Show marketing remark (355 chars)
ENJOY VIEW OF LK BONNY FROM FRONT OF HOME. PUBLIC BOAT RAMP ACROSS THE STREET. FL. RM ON BACK OF HOUSE. FENCED BACK YARD. CONVENIENT LOCATION. TILED THRU OUT. SEMI CIRCLE DRIVEWAY. STROLL TO INTERLACHEN PARK AND PLAYGROUND. HUD property sold as-is. Sold subject to rules and regulations of HUD. FHA ELIGIBLE WITH $2750 REPAIR ESCROW HUD CASE - 093-629181
-
2007-08-16soldstatus $160,000
-
2007-08-03soldstatus $160,000
-
2007-03-15$151,900
-
2003-05-12soldstatus $89,100
-
2000-08-31soldstatus $74,000
-
1990-06-01soldstatus $36,000
ⓘ Source: listings_history table (triggers on properties + properties_extension) + one-shot
backfill from property_details.listing_events for pre-trigger history.
Tax reassessment forecast FL · Resets to sale price
- Current annual tax
- $2,921 · $243/mo
- Projected year-2 tax
- $2,921 · $243/mo
- Expected delta
- $0/yr ($0/mo · 0.0%)
ⓘ Screening estimate from a state-policy table — verify with the county assessor before closing.
Climate risk First Street
- Flood 1/10 Low FEMA zone X (unshaded) · 0% chance over 30 yrs
- Wildfire 1/10 Low
- Heat 8/10 Severe 7 d/yr ≥108°F today · 24 d/yr by 30 yrs out
- Wind 10/10 Extreme 99% chance of damaging wind over 30 yrs
- Air quality 2/10 Low 1 unhealthy d/yr today · 2 by 30 yrs out
Nearby sold comps map
Loading sold comps map…
Walkable amenities ~0.75 mi
Loading nearby amenities…
Taxation est. · year 1
- Rental income
- $20,991
- − Mortgage interest
- −$11,203
- − Property taxes
- −$2,921
- − Insurance
- −$1,000
- − Repairs & maintenance
- −$1,679
- − Management
- −$1,679
- − Depreciation
- −$5,818
- Taxable loss
- −$3,310
- Est. tax savings @ 24.0%
- +$794
- After-tax cash flow
- $870/yr
For passive investors: Depreciation is non-cash, so a rental often shows a tax loss while cash-flowing — sheltering income. Rental losses are passive: they offset passive income freely, and up to $25,000/yr can offset ordinary (W-2) income if you actively participate and your MAGI is under $100k (phasing out to $0 by $150k); unused losses carry forward. On sale, claimed depreciation is recaptured at up to 25%, and gains may owe capital-gains tax (a 1031 exchange can defer both). Figures are a year-1 estimate at your 24.0% rate — not tax advice; consult a CPA.
Schools (NCES district)
- District
- Polk
- NCES district ID
- 1201590
- Math proficiency
- 39% ▼ -11.00%
- Reading proficiency
- 43% ▼ -4.00%
- Median HH income
- $43,979
- Composite
- 34.74/100
- National rank
- #5132
- State rank
- #62 of 73 in FL
Livability — Lakeland
- Score
- 77/100
- State rank
- #206
- US rank
- #3179
Category grades
Schools grade is shown separately in the Schools card above.
Census & demographics
- Census place
- Lakeland, FL
- County
- Polk County · 740,051 people
- City population
- 277,690
- Metro
- Lakeland-Winter Haven, FL
- Population (ZIP)
- 35,394
- Household income
- $53,061
- Rent vs Own
- Severe rent burden
- 1291.0
Population outlook (Polk County) Hauer SSP2
- Today (2025)
- 752,975 people
- By 2030
- 804,621 · +6.9%
- By 2040
- 906,117 · +20.3%
- By 2050
- 1,000,476 · +32.9%
- By 2075
- 1,197,520 · +59.0%
- By 2100
- 1,271,518 · +68.9%
Race, ethnicity, and origin ACS 2023
- Neighborhood character
- Diverse neighborhood (Simpson 0.58)
- Race & ethnicity
- White 60% Hispanic / Latino 19% Black 16% Two or more races 8% Asian 1%
- Hispanic origin (detail)
- Mexican 5% Puerto Rican 8% Cuban 3%
- Common ancestry
- Romanian 2% Slovak 2% Lithuanian 1%
- Foreign-born
- 8% · Canada
- Languages at home
- 83% English-only · Spanish 14% French/Haitian/Cajun 1%
Political lean MEDSL · Polk
- 2024 margin
- Strong R (+20.7) · D 39.2% · R 59.9%
- 2008→2024 swing
- -14.6pp toward R · 2008: -6.1pp · 2024: -20.7pp
- All cycles
- 2024: R+20.7 2020: R+14.4 2016: R+14.1 2012: R+6.8 2008: R+6.1
Not yet ingested
- Civics
- —
Market trends
- HPI YoY
- ▼ -70.91%
- Current HPI
- 373.7159
- Rent YoY
- ▲ 1.05%
- Metro
- Lakeland-Winter Haven, FL
- State GDP YoY
- ▲ 3.28%
- F500 in state
- 36
Industry mix (Fortune 500 HQ in FL)
| Industry | F500 HQs | Revenue |
|---|---|---|
| Industrial Technology | 2 | $29B |
|
||
| Insurance | 2 | $17B |
|
||
| Retail | 1 | $60B |
|
||
| Technology Distribution | 1 | $58B |
|
||
| Homebuilding | 1 | $35B |
|
||
| Technology Manufacturing | 1 | $35B |
|
||
Price history
+455.6% since first listed17 events — show timeline
- 2026-05-19 Relisted — Stellar MLS as Distributed by MLS Grid
- 2026-05-14 Pending — Stellar MLS as Distributed by MLS Grid
- 2026-05-06 Price Changed $200,000 Stellar MLS as Distributed by MLS Grid
- 2026-04-12 Price Changed $215,000 Stellar MLS as Distributed by MLS Grid
- 2026-03-27 Listed $225,000 Stellar MLS as Distributed by MLS Grid
- 2026-01-11 Listing Removed — Stellar MLS as Distributed by MLS Grid
- 2025-12-23 Relisted — Stellar MLS as Distributed by MLS Grid
- 2025-11-18 Pending — Stellar MLS as Distributed by MLS Grid
- 2025-11-13 Listed $200,000 Stellar MLS as Distributed by MLS Grid
- 2010-09-30 Sold (MLS) $49,000 Stellar MLS as Distributed by MLS Grid
- 2010-08-20 Listed $49,000 Stellar MLS as Distributed by MLS Grid
- 2007-08-16 Sold (Public Records) $160,000 Public Records
- 2007-08-03 Sold (MLS) $160,000 Stellar MLS as Distributed by MLS Grid
- 2007-03-15 Listed $151,900 Stellar MLS as Distributed by MLS Grid
- 2003-05-12 Sold (Public Records) $89,100 Public Records
- 2000-08-31 Sold (Public Records) $74,000 Public Records
- 1990-06-01 Sold (Public Records) $36,000 Public Records
Property tax history
+21.1%/yrLatest (2025): $2,921 · -0.4% YoY. Source: county tax records.
Cash-flow waterfall
monthlySold comps — $/sqft
last 12 mo · ≤1 miLoading sold comps…