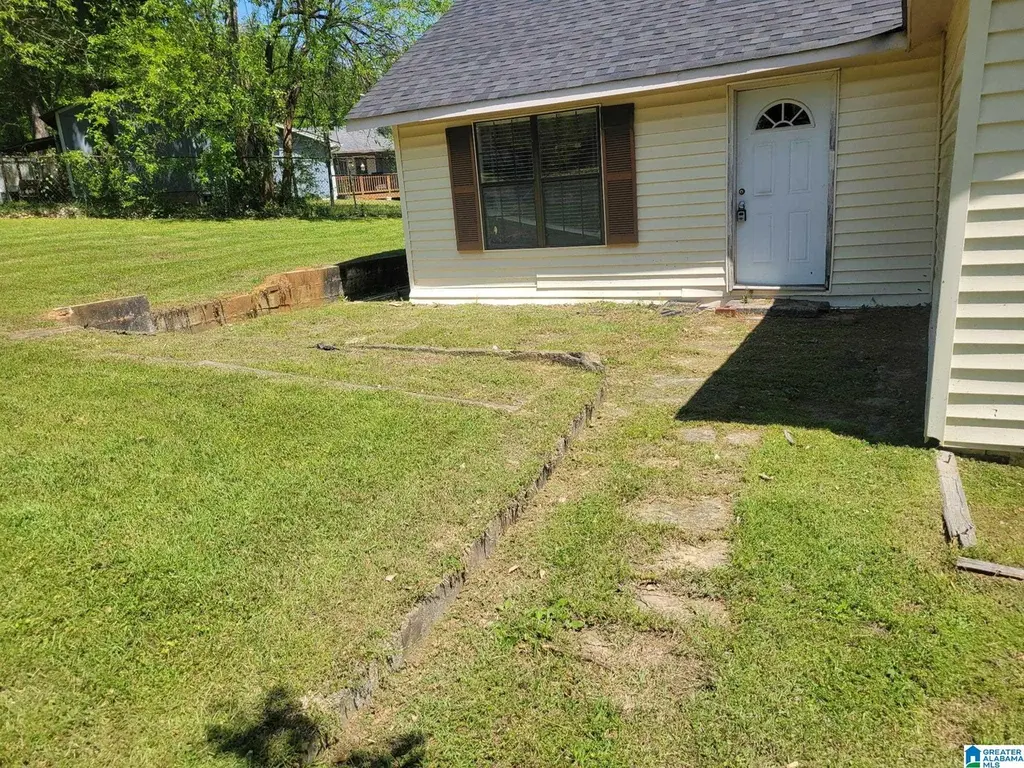
329 23rd St N · Irondale, AL
Flood risk 1/10 · Minimal
- FEMA flood zone
- X (unshaded)
- Chance of flooding over 30 yrs
- 0.0%
- Est. flood insurance / yr
- $507 – $1,088
Fire risk 3/10 · Minor
- Est. fire insurance / yr
- $916 – $1,700
Heat risk 5/10 · Moderate
- Hot days now (above 106°F)
- 7 days/yr
- Hot days in 30 yrs
- 18 days/yr
Wind risk 6/10 · Moderate
- Chance of severe wind over 30 yrs
- 27.0%
Air-quality risk 5/10 · Moderate
- Unhealthy air days now
- 8 days/yr
- Unhealthy air days in 30 yrs
- 10 days/yr
Risk factors via First Street. Map © Google.
Why this score? — see what drove the B- grade
The composite is a weighted blend of 9 inputs, each scored 0–100. Each bar is that input's sub-score; the figure is the points it added to the 100-point composite (weight × sub-score).
- Cash flow +30.0/30.0
- 1% rule +10.0/10.0
- DSCR +10.0/10.0
- ARV discount +7.5/15.0
- Livability +3.7/5.0
- Rent growth +3.5/5.0
- Condition / age +2.5/5.0
- Schools +1.8/10.0
- Appreciation +0.0/10.0
$99,000
🖨 Deal sheet 📄 Offer letter ✓ Due diligence
Listing remarks
Great investment property.
Key facts
- 5,227 sq ft lot
- Built 1948
- Listed 23 days
Property features AI
Finance
- Other: Lot size approximately 0.12 acres; Not in a flood plain
- Financial info: Garbage fee of $45
Exterior
- Parking: Driveway parking; Off-street parking
- Utilities: Public water; Connected sewer; Internet service availability unknown
- Home design: Existing construction; Vinyl siding; Slab foundation; Located in SOUTH IRONDALE subdivision
- Construction: Vinyl siding construction; Slab foundation
- Exterior features: Fenced yard; Storage building; Open patio
Interior
- Kitchen: Kitchen on main level
- Flooring: Concrete
- Bathrooms: 1 full bathroom
- Heating & cooling: No heat; No air conditioning
- Interior features: Concrete floors; Ceilings described as 'Other (See Remarks)'; No additional interior features listed
Neighborhood map
What this means for you Summary
Snapshot
- This is a 3-bed/1.0-bath single-family listed at $99k.
Deal economics
- At list price, monthly cash flow is $492 ($6k/yr) — positive.
- The deal already cash-flows at list — no discount required.
- Meets the 1% rule at list price ($2k rent vs $99k).
- Recommended offer: $98k (1.5% below list) — sets the bar for market timing.
- Cap rate 12.3% vs local median 5.2% in Irondale — top-decile yield for the area; either an underpriced asset or a hidden risk that comps aren't pricing in. Stress-test before assuming the spread holds.
Location & tenants
- Location reads 74/100 on livability (#23 in AL, #4,921 nationally) — a middle-class / working-renter tenant base. Strengths: cost of living A+, housing A+, crime B+; Watch: employment C-, amenities F, health & safety F.
- Jefferson County (suburban): math 9% / reading 32% proficiency, ranked #104 of 129 in AL (top 81%) — low school quality limits family demand, transient renter base, plan for 1-2y turnover.
- Zoned schools: Irondale Community School (math 6% / reading 32%, grade F, #478 of 627 statewide, top 76%, 450 students, 50% FRL); Shades Valley High School (math 29% / reading 39%, grade F, #53 of 305 statewide, top 18%, 1,200 students, 68% FRL).
- Market conditions: Rents rising fast (+4.2%/yr); 81 active listings in the ZIP; 40 comparable units currently listed for rent nearby; rentals at typical pace (median 24d on market — plan ~3-4 weeks tenant-placement turnaround); 48% of comp listings sitting > 30 days — soft ceiling on asking rent; 2,114 units permitted in Jefferson County in 2024 (556 in 5+ unit buildings).
Forward outlook
- Local home prices are declining (-3.0%/yr); year-one equity from $684 of loan paydown is wiped out by about $3k of value loss. Plan a longer hold.
- Jefferson County population projected to shrink 4% by 2050 — rents likely to lag national; underwrite the cash flow, not the appreciation.
- At projected returns (-3.0% appreciation + 4.2% rent growth), your $28k cash investment doubles in ~6 years — after that, you're playing with house money.
Negotiation context
- It's been on market 23 days — a 2% lower offer ($98k) is reasonable based on typical stale-listing flexibility.
- Current owner paid $65k; list at $99k implies a 52% gain — meaningful room to come down on a strong offer.
Risks & watch-outs
- Watch-outs: built in 1948 — expect roof / HVAC / electrical / plumbing capex.
- Climate carrying-cost: major wind risk, 27% chance of damaging wind over 30y; extreme-heat days projected 7→18/yr by 2055 (HVAC capex compounding) — expect insurance premiums to compound above CPI over the hold.
Questions for the listing agent
- Built in 1948 — when were the roof, HVAC, electrical panel, plumbing, and water heater last replaced?
- Is there a deadline driving the sale (1031 exchange, divorce, estate, relocation)? That informs how much negotiation room exists.
- Schools are D-rated, which usually means shorter tenancies and higher turnover. Who's the typical renter profile here, and what's been the actual vacancy rate?
- What's the average days-on-market for RENTAL listings here right now (not sales)? A rising rental-DOM trend means longer vacancies and softer asking-rent achievability than the comps imply.
- What's the recent tenant-quality profile in this submarket — average credit score on applications, eviction rate, late-payment / NSF rate, and stable-employment percentage? A property-management company in the area should have these aggregated.
- How much new for-sale + rental construction is in the pipeline within 1–3 miles? Heavy new supply typically softens prices + rents 12–24 months out; constrained supply supports both.
Investment metrics
- 1% rule
- 1.52% ✓
- Cap rate
- 12.26%
- Cash-on-cash
- 21.30%
- DSCR
- 1.95
- GRM
- 5.5
CMA / ARV
- ARV (on-the-fly)
- $275,625
- Comps found
- 12
Show comp detail 12 sales within ~0.75 mi
| Address | Dist | Beds/Ba | Sqft | Sold | Price | $/sf | Match |
|---|---|---|---|---|---|---|---|
| 2120 3rd Ave N | 0.15mi | 3/2.0 | 1,184 (-3%) | 4mo | $170,000 | $144 | 80 |
| 224 24th St N | 0.08mi | 3/2.0 | 1,296 (+6%) | 5mo | $205,000 | $158 | 78 |
| 2302 Highland Ave | 0.07mi | 3/1.0 | 1,351 (+10%) | 10mo | $195,000 | $144 | 72 |
| 2209 2nd Ave S | 0.35mi | 3/1.5 | 1,150 (-6%) | 1mo | $235,000 | $204 | 70 |
| 2110 S 4th Ave | 0.47mi | 3/2.0 | 1,232 (+1%) | 10mo | $248,000 | $201 | 64 |
| 2010 2nd Ave N | 0.27mi | 3/1.0 | 1,375 (+12%) | 8mo | $247,400 | $180 | 60 |
| 2829 Montevallo Park Rd | 0.67mi | 3/2.0 | 1,276 (+4%) | 2mo | $329,900 | $259 | 56 |
| 2901 Montevallo Park Rd | 0.62mi | 3/2.0 | 1,276 (+4%) | 9mo | $314,000 | $246 | 52 |
| 2812 Montevallo Park Rd | 0.68mi | 3/2.0 | 1,334 (+9%) | 3mo | $325,000 | $244 | 47 |
| 2809 Montevallo Park Rd | 0.65mi | 3/2.0 | 1,334 (+9%) | 9mo | $321,000 | $241 | 43 |
| 1516 Monticello Rd | 0.73mi | 3/1.0 | 1,056 (-14%) | 2mo | $265,000 | $251 | 41 |
| 2833 Montevallo Park Rd | 0.68mi | 3/2.0 | 1,334 (+9%) | 10mo | $300,000 | $225 | 41 |
Match score weights: distance 35% · size 25% · config 20% · recency 20%. Top-matched comps best support the ARV.
Projected returns pro-forma
-3.0% appreciation · 4.18% rent growth · sell at horizon
- IRR
- 15.2%
- Equity multiple
- 1.62×
- Total profit
- $17,147
- Equity at exit
- $14,761
- IRR
- 24.8%
- Equity multiple
- 3.27×
- Total profit
- $63,041
- Equity at exit
- $8,560
Cash invested: $27,720 (down + closing). Projections, not guarantees.
Landlord ↔ Tenant lean methodology
- Overall (STATE)
- 90 Strongly Landlord-Friendly
- State Alabama
- 90 Strongly Landlord-Friendly · R+15
- County
- — inherits STATE
- City
- — inherits STATE
ZIP-level market 35210
- Home prices YoY
- -32.2%
- Rents YoY
- 4.2%
- Active inventory
- 81
- Price-to-rent
- 5.5×
Monthly cashflow live
- Estimated rent
- $1,509 high interval (Pro) →
- Mortgage (P&I)
- −$519
- Tax from tax record
- −$139 /mo · $1,671/yr
- Insurance
- −$41
- HOA
- −$0
- Vacancy / Maint / Mgmt
- −$317
- Net cashflow
- $492
Break-even live
UW: 25.0% down · 7.5% · 30yr · 1.5% tax · 5.0% vac · 8.0% maint · 8.0% mgmt
Financing live
Cash to close
- Down payment
- $24,750
- Closing costs
- $2,970
- Reserves months
- —
- Total cash needed
- —
Loan-product check · same deal, 3 products live
Conventional
25% down · 7.5% · 30yr
- Down + closing
- —
- Monthly P&I
- —
- Monthly cashflow
- —
- DSCR
- —
- Eligible?
- —
Personal DTI + credit; lowest rate.
DSCR
20% down · 8.5% · 30yr
- Down + closing
- —
- Monthly P&I
- —
- Monthly cashflow
- —
- DSCR
- —
- Eligible?
- —
No personal income docs; deal must DSCR.
Hard money
10% down · 12.0% · 12mo
- Down + closing
- —
- Monthly P&I
- —
- Monthly cashflow
- —
- DSCR
- —
- Eligible?
- —
Short-term bridge; refi at stabilization.
Rent comps 40 comps
| Address | Beds | Baths | Sqft | Rent | $/sqft | DOM | Units | Dist |
|---|---|---|---|---|---|---|---|---|
| 2208 3rd Ave S Irondale, AL | 3.0 | 1.0 | 934 | $1,350 | $1.45 | 43d | 1 | 0.41mi |
| 2884 Montevallo Park Rd Irondale, AL | 3.0 | 2.0 | 1275 | $2,206 | $1.73 | 2d | 1 | 0.64mi |
| 7341 Rome Ave Birmingham, AL | 3.0 | 1.0 | 1000 | $1,300 | $1.30 | 43d | 1 | 0.79mi |
| 7341 Rome Ave Birmingham, AL | 3.0 | 1.0 | 1000 | $1,275 | $1.27 | 3d | 1 | 0.79mi |
| 7216 Paris Ave Birmingham, AL | 3.0 | 1.5 | 966 | $1,125 | $1.16 | 19d | 1 | 0.79mi |
| 7313 Paris Ave Birmingham, AL | 3.0 | 2.0 | 1000 | $1,395 | $1.40 | 2d | 1 | 0.84mi |
| 7213 Naples Ave Birmingham, AL | 3.0 | 1.5 | 925 | $1,100 | $1.19 | 43d | 1 | 0.88mi |
| 7213 Naples Ave Birmingham, AL | 3.0 | 1.5 | 937 | $1,100 | $1.17 | 11d | 1 | 0.88mi |
| 7404 Paris Ave Birmingham, AL | 3.0 | 1.5 | 802 | $1,200 | $1.50 | 43d | 1 | 0.93mi |
| 836 Vanderbilt St Birmingham, AL | 3.0 | 1.0 | 1072 | $850 | $0.79 | 23d | 1 | 0.93mi |
| 7808 Vienna Ave Birmingham, AL | 2.0 | 1.0 | 904 | $850 | $0.94 | 43d | 1 | 0.97mi |
| 7716 Sunrise Cir Birmingham, AL | 1.0–2.0 | 1.0 | 795 | $1,000 | $1.26 | 43d | 1 | 1.05mi |
| 756 Vanderbilt St Birmingham, AL | 3.0 | 2.0 | 1096 | $1,000 | $0.91 | 43d | 1 | 1.06mi |
| 832 79th Pl S Birmingham, AL | 3.0 | 1.0 | 960 | $1,250 | $1.30 | 23d | 1 | 1.06mi |
| 7825 Rugby Ct Birmingham, AL | 2.0 | 1.0 | 929 | $875 | $0.94 | 21d | 1 | 1.12mi |
| 630 77th St S Birmingham, AL | 2.0 | 2.0 | 1100 | $983 | $0.89 | 2d | 1 | 1.13mi |
| 7823 Rugby Ave Birmingham, AL | 3.0 | 1.0 | 1023 | $1,175 | $1.15 | 43d | 1 | 1.19mi |
| 7827 Rugby Ave Birmingham, AL | 3.0 | 1.0 | 1365 | $850 | $0.62 | 3d | 1 | 1.20mi |
| 7740 Rugby Ave Unit b Birmingham, AL | 2.0 | 1.0 | 800 | $1,100 | $1.38 | 43d | 1 | 1.20mi |
| 7740 Rugby Ave Unit 2 Birmingham, AL | 2.0 | 1.0 | 800 | $1,000 | $1.25 | 43d | 1 | 1.20mi |
| 768 80th Pl S Unit 1 Birmingham, AL | 3.0 | 2.0 | 1134 | $1,200 | $1.06 | 43d | 1 | 1.24mi |
| 7728 Rugby Ave Birmingham, AL | 2.0 | 1.0 | 700 | $850 | $1.21 | 43d | 1 | 1.25mi |
| 7701 7th Ave S Birmingham, AL | 2.0 | 1.0 | 800 | $850 | $1.06 | 23d | 1 | 1.27mi |
| 8013 Rugby Ave Birmingham, AL | 3.0 | 2.0 | 1460 | $1,150 | $0.79 | 23d | 1 | 1.29mi |
| 605 71st St S Birmingham, AL | 3.0 | 1.5 | 1024 | $1,303 | $1.27 | 1d | 1 | 1.30mi |
| 764 81st St S Unit B Birmingham, AL | 2.0 | 1.0 | 800 | $800 | $1.00 | 43d | 1 | 1.31mi |
| 509 Ardmore Ln Irondale, AL | 3.0 | 1.5 | 1408 | $1,580 | $1.12 | 2d | 1 | 1.32mi |
| 775 81st Pl S Birmingham, AL | 3.0 | 1.0 | 1232 | $1,095 | $0.89 | 23d | 1 | 1.34mi |
| 7931 7th Ave S Birmingham, AL | 3.0 | 1.0 | 1320 | $1,450 | $1.10 | 43d | 1 | 1.35mi |
| 8229 9th Ave S Birmingham, AL | 2.0 | 1.0 | 997 | $1,195 | $1.20 | 2d | 1 | 1.36mi |
| 6936 66th St S Birmingham, AL | 3.0 | 1.0 | 880 | $1,050 | $1.19 | 43d | 1 | 1.40mi |
| 735 81st St S Birmingham, AL | 3.0 | 2.0 | 1224 | $1,400 | $1.14 | 23d | 1 | 1.40mi |
| 7620 4th Ave S Birmingham, AL | 3.0 | 1.0 | 1144 | $1,025 | $0.90 | 43d | 1 | 1.41mi |
| 731 81st St S Birmingham, AL | 3.0 | 1.0 | 1221 | $995 | $0.81 | 10d | 1 | 1.41mi |
| 6732 Frankfort Ave Birmingham, AL | 3.0 | 1.0 | 924 | $995 | $1.08 | 43d | 1 | 1.42mi |
| 8122 Rugby Ave Unit B Birmingham, AL | 2.0 | 1.0 | 900 | $795 | $0.88 | 43d | 1 | 1.42mi |
| 5303 Dixieland Rd Irondale, AL | 4.0 | 3.0 | 1296 | $1,911 | $1.47 | 15d | 1 | 1.43mi |
| 132 Woodside Dr Irondale, AL | 3.0 | 1.0 | 1452 | $1,595 | $1.10 | 15d | 1 | 1.44mi |
| 7815 4th Ave S Birmingham, AL | 3.0 | 2.0 | 1496 | $1,650 | $1.10 | 1d | 1 | 1.46mi |
| 7025 4th Ave S Birmingham, AL | 3.0 | 1.0 | 1090 | $845 | $0.78 | 43d | 1 | 1.46mi |
Listing history 16 events
-
2026-06-18days on market $99,000 Active 23 DOM
-
2026-06-17days on market $99,000 Active 22 DOM
-
2026-06-16days on market $99,000 Active 21 DOM
-
2026-06-15days on market $99,000 Active 20 DOM
-
2026-06-13days on market $99,000 Active 18 DOM
-
2026-06-10days on market $99,000 Active 15 DOM
-
2026-06-09days on market $99,000 Active 14 DOM
-
2026-06-08days on market $99,000 Active 13 DOM
-
2026-06-07days on market $99,000 Active 12 DOM
-
2026-06-03days on market $99,000 Active 8 DOM
-
2026-06-02days on market $99,000 Active 7 DOM
-
2026-06-01days on market $99,000 Active 6 DOM
-
2026-05-31days on market $99,000 Active 5 DOM
-
2026-05-25$99,000 Active
-
2024-02-21soldstatus $65,000
-
2024-02-07soldstatus $50,000
ⓘ Source: listings_history table (triggers on properties + properties_extension) + one-shot
backfill from property_details.listing_events for pre-trigger history.
Tax reassessment forecast AL · Resets to sale price
- Current annual tax
- $1,671 · $139/mo
- Projected year-2 tax
- $1,671 · $139/mo
- Expected delta
- $0/yr ($0/mo · -0.0%)
ⓘ Screening estimate from a state-policy table — verify with the county assessor before closing.
Climate risk First Street
- Flood 1/10 Low FEMA zone X (unshaded) · 0% chance over 30 yrs
- Wildfire 3/10 Moderate
- Heat 5/10 Major 7 d/yr ≥106°F today · 18 d/yr by 30 yrs out
- Wind 6/10 Major 27% chance of damaging wind over 30 yrs
- Air quality 5/10 Major 8 unhealthy d/yr today · 10 by 30 yrs out
Nearby sold comps map
Loading sold comps map…
Walkable amenities ~0.75 mi
Loading nearby amenities…
Taxation est. · year 1
- Rental income
- $18,104
- − Mortgage interest
- −$5,546
- − Property taxes
- −$1,671
- − Insurance
- −$495
- − Repairs & maintenance
- −$1,448
- − Management
- −$1,448
- − Depreciation
- −$2,880
- Taxable income
- $4,615
- Est. tax owed @ 24.0%
- −$1,108
- After-tax cash flow
- $4,798/yr
For passive investors: Depreciation is non-cash, so a rental often shows a tax loss while cash-flowing — sheltering income. Rental losses are passive: they offset passive income freely, and up to $25,000/yr can offset ordinary (W-2) income if you actively participate and your MAGI is under $100k (phasing out to $0 by $150k); unused losses carry forward. On sale, claimed depreciation is recaptured at up to 25%, and gains may owe capital-gains tax (a 1031 exchange can defer both). Figures are a year-1 estimate at your 24.0% rate — not tax advice; consult a CPA.
Schools (NCES district)
- District
- Jefferson County
- NCES district ID
- 0101920
- Math proficiency
- 9% ▼ -24.00%
- Reading proficiency
- 32% ▼ -5.00%
- Median HH income
- $51,712
- Composite
- 18.4/100
- National rank
- #8937
- State rank
- #104 of 129 in AL
Livability — Irondale
- Score
- 74/100
- State rank
- #23
- US rank
- #4921
Category grades
Schools grade is shown separately in the Schools card above.
Census & demographics
- Census place
- Irondale, AL
- County
- Jefferson County · 527,445 people
- City population
- 13,775
- Metro
- Birmingham-Hoover, AL
- Population (ZIP)
- 13,775
- Household income
- $73,061
- Rent vs Own
- Severe rent burden
- 379.0
Population outlook (Jefferson County) Hauer SSP2
- Today (2025)
- 669,185 people
- By 2030
- 669,694 · +0.1%
- By 2040
- 661,388 · -1.2%
- By 2050
- 643,086 · -3.9%
- By 2075
- 577,267 · -13.7%
- By 2100
- 474,758 · -29.1%
Race, ethnicity, and origin ACS 2023
- Neighborhood character
- Majority White (62%)
- Race & ethnicity
- White 62% Black 28% Hispanic / Latino 7% Two or more races 6%
- Hispanic origin (detail)
- Mexican 4%
- Common ancestry
- Slovak 4% Italian 3% Serbian 2%
- Foreign-born
- 6% · Canada
- Languages at home
- 91% English-only · Spanish 6% Arabic 1% Russian/Polish/Slavic 1%
Political lean MEDSL · Jefferson
- 2024 margin
- D (+10.4) · D 54.6% · R 44.2% · Other 1.2%
- 2008→2024 swing
- +5.4pp toward D · 2008: 5.1pp · 2024: 10.4pp
- All cycles
- 2024: D+10.4 2020: D+13.2 2016: D+7.2 2012: D+6.0 2008: D+5.1
Not yet ingested
- Civics
- —
Market trends
- HPI YoY
- ▼ -109.03%
- Current HPI
- 230.033
- Rent YoY
- ▲ 4.18%
- Metro
- Birmingham-Hoover, AL
- State GDP YoY
- ▲ 2.94%
- F500 in state
- 4
Industry mix (Fortune 500 HQ in AL)
| Industry | F500 HQs | Revenue |
|---|---|---|
| Financial Services | 1 | $8B |
|
||
| Healthcare | 1 | $5B |
|
||
Price history
+98.0% since first listed3 events — show timeline
- 2026-05-25 Listed $99,000 Greater Alabama MLS
- 2024-02-21 Sold (Public Records) $65,000 Public Records
- 2024-02-07 Sold (Public Records) $50,000 Public Records
Property tax history
+13.9%/yrLatest (2025): $1,671 · +374.8% YoY. Source: county tax records.
Cash-flow waterfall
monthlySold comps — $/sqft
last 12 mo · ≤1 miLoading sold comps…