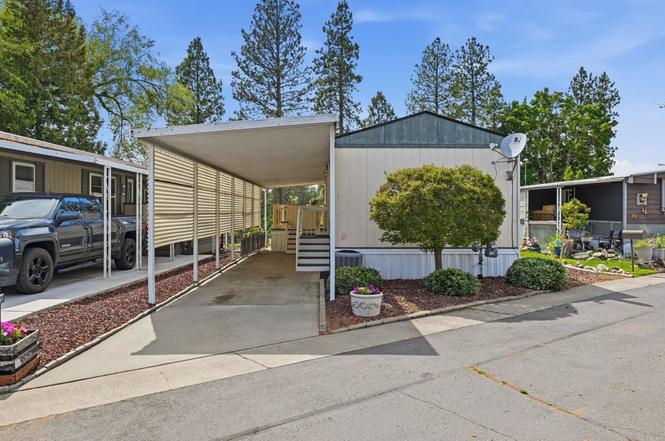
2601 N Barker Rd #79 · Spokane Valley, WA
Flood risk 9/10 · Severe
- FEMA flood zone
- X (unshaded)
- Chance of flooding over 30 yrs
- 0.99%
- Est. flood insurance / yr
- $507 – $1,088
Fire risk 6/10 · Moderate
- Est. fire insurance / yr
- $604 – $1,122
Heat risk 3/10 · Minor
- Hot days now (above 93°F)
- 6 days/yr
- Hot days in 30 yrs
- 12 days/yr
Wind risk 1/10 · Minimal
- Chance of severe wind over 30 yrs
- —
Air-quality risk 9/10 · Severe
- Unhealthy air days now
- 14 days/yr
- Unhealthy air days in 30 yrs
- 15 days/yr
Risk factors via First Street. Map © Google.
Why this score? — see what drove the B- grade
The composite is a weighted blend of 9 inputs, each scored 0–100. Each bar is that input's sub-score; the figure is the points it added to the 100-point composite (weight × sub-score).
- Cash flow +30.0/30.0
- DSCR +10.0/10.0
- 1% rule +8.8/10.0
- ARV discount +7.5/15.0
- Schools +4.3/10.0
- Livability +4.2/5.0
- Rent growth +2.5/5.0
- Condition / age +2.5/5.0
- Appreciation +0.0/10.0
$124,900
🖨 Deal sheet 📄 Offer letter ✓ Due diligence
Listing remarks MLS
* * * * RIVERFRONT * * * View of the sunset and Spokane River surrounded by singing birds, flowers, flowing river, Truly a picture perfect setting, open living room to kitchen floor plan, eating bar, oak finish kitchen with china hutch, all appliances stay WASHER & DRYER also stay, shed, carport. Glass slider to a covered deck overlooking the river, bay window view of the river, vinyl windows and new central A/C. This cozy home is move in ready!
Key facts
- Covered deck
- Bright kitchen
- Fenced yard
Tags
Property features AI
Finance
- HOA & community: Located in River Rose Vill park; Senior community; Monthly land lease: $635
Exterior
- Parking: Carport (1 space); Slab parking; RV access/parking
- Utilities: High-speed internet available (XFinity Filter net)
- Home design: Manufactured home; One-story structure; Skirted foundation
- Construction: Masonite exterior; Composition roof (see remarks); Block foundation
- Exterior features: Deck; Patio; Views; Fenced yard; Treed lot; Level lot; Orchard(s); Riverfront on the Spokane River; Paved road and city street frontage
Interior
- Kitchen: Free-standing range; Dishwasher; Refrigerator; Hard surface counters
- Bedrooms: 2 bedrooms
- Heating & cooling: Natural gas and electric forced-air heating; Window air-conditioning unit(s)
- Interior features: Cathedral ceilings; Bay window; Utility room
- Laundry & utility: Washer; Dryer
Neighborhood map
What this means for you Summary
Snapshot
- This is a 2-bed/1.0-bath manufactured listed at $125k.
Deal economics
- At list price, monthly cash flow is $431 ($5k/yr) — positive.
- The deal already cash-flows at list — no discount required.
- Meets the 1% rule at list price ($2k rent vs $125k).
- Cap rate 11.1% vs local median 3.0% in Spokane Valley — top-decile yield for the area; either an underpriced asset or a hidden risk that comps aren't pricing in. Stress-test before assuming the spread holds.
Location & tenants
- Location reads 85/100 on livability (#31 in WA, #512 nationally) — a professional / high-income tenant draw. Strengths: amenities A+, commute A+, housing A+; Watch: crime D+.
- East Valley School District (Spokane) (urban): math 40% / reading 56% proficiency, ranked #160 of 291 in WA (top 55%) — families likely to look elsewhere, expect single-tenant / working-renter base with shorter leases.
- Zoned schools: Otis Orchards School (367 students, 76% FRL); East Valley High School (957 students, 58% FRL) — zoned schools average 67% FRL vs 45% district-wide (22 pts higher); higher-poverty schools than district average — tighter screening recommended.
- Market conditions: 57 active listings in the ZIP; 4 comparable units currently listed for rent nearby; rentals at typical pace (median 14d on market — plan ~3-4 weeks tenant-placement turnaround); 3,608 units permitted in Spokane County in 2024 (1,792 in 5+ unit buildings).
Forward outlook
- Local home prices are declining (-3.0%/yr); year-one equity from $864 of loan paydown is wiped out by about $4k of value loss. Plan a longer hold.
- Spokane County population projected at +13% by 2050 — modest demand growth; plan on rents tracking national, not racing it.
- At projected returns (-3.0% appreciation + 3.0% rent growth), your $35k cash investment doubles in ~8 years — after that, you're playing with house money.
Negotiation context
- Only 1 days on market — expect competitive offers; lowballing is unlikely to land.
- 6 sale attempts since 21y ago with the ask held roughly flat each time — persistent listings suggest the price (not the market) is what's stuck; bring a comps-based counter.
- Current owner paid $37k; list at $125k implies a 242% gain — meaningful room to come down on a strong offer.
Risks & watch-outs
- Watch-outs: flood insurance adds $66/mo.
- Climate carrying-cost: severe flood risk; major wildfire risk — expect insurance premiums to compound above CPI over the hold.
Questions for the listing agent
- What's the actual annual flood-insurance premium (NFIP or private), and is the property in a SFHA with mandatory coverage?
- Is there a deadline driving the sale (1031 exchange, divorce, estate, relocation)? That informs how much negotiation room exists.
- Schools are B-rated — typically a magnet for longer-tenancy family renters. What's the average tenant stay here, and is there a school-zone premium baked into asking?
- Crime grade is D in this area — have there been break-ins, vandalism, or insurance claims at this property in the last 3 years? What carrier currently insures it and at what premium?
- What's the average days-on-market for RENTAL listings here right now (not sales)? A rising rental-DOM trend means longer vacancies and softer asking-rent achievability than the comps imply.
- What's the recent tenant-quality profile in this submarket — average credit score on applications, eviction rate, late-payment / NSF rate, and stable-employment percentage? A property-management company in the area should have these aggregated.
- How much new for-sale + rental construction is in the pipeline within 1–3 miles? Heavy new supply typically softens prices + rents 12–24 months out; constrained supply supports both.
Investment metrics
- 1% rule
- 1.38% ✓
- Cap rate
- 11.07%
- Cash-on-cash
- 17.08%
- DSCR
- 1.76
- GRM
- 6.0
CMA / ARV
- ARV (on-the-fly)
- $74,760
- Comps found
- 9
Show comp detail 9 sales within ~0.75 mi
| Address | Dist | Beds/Ba | Sqft | Sold | Price | $/sf | Match |
|---|---|---|---|---|---|---|---|
| 2601 N Barker Rd #45 | 0.02mi | 2/2.0 | 780 (-7%) | 1mo | $60,000 | $77 | 82 |
| 2601 N Barker Rd #69 | 0.08mi | 2/1.0 | 812 (-3%) | 18mo | $95,000 | $117 | 76 |
| 2920 N Rivista Dr | 0.28mi | 2/2.0 | 840 (0%) | 10mo | $170,000 | $202 | 75 |
| 2601 N Barker #115 | 0.19mi | 2/1.0 | 868 (+3%) | 14mo | $77,000 | $89 | 74 |
| 2601 N Barker Rd #95 | 0.19mi | 2/2.0 | 924 (+10%) | 2mo | $50,000 | $54 | 69 |
| 19021 E Montgomery Dr | 0.27mi | 1/1.0 (-1) | 900 (+7%) | 10mo | $150,000 | $167 | 62 |
| 2601 N Barker Rd #21 | 0.06mi | 2/2.0 | 960 (+14%) | 12mo | $60,000 | $63 | 59 |
| 19221 E Buckeye Ave #10 | 0.45mi | 3/2.0 (+1) | 924 (+10%) | 11mo | $75,500 | $82 | 44 |
| 18517 E Courtland Ave | 0.64mi | 3/2.0 (+1) | 896 (+7%) | 16mo | $163,000 | $182 | 36 |
Match score weights: distance 35% · size 25% · config 20% · recency 20%. Top-matched comps best support the ARV.
Projected returns pro-forma
-3.0% appreciation · 3.0% rent growth · sell at horizon
- IRR
- 5.4%
- Equity multiple
- 1.21×
- Total profit
- $7,293
- Equity at exit
- $18,623
- IRR
- 14.8%
- Equity multiple
- 2.20×
- Total profit
- $41,987
- Equity at exit
- $10,799
Cash invested: $34,972 (down + closing). Projections, not guarantees.
Landlord ↔ Tenant lean methodology
- Overall (STATE)
- 28 Tenant-Leaning
- State Washington
- 28 Tenant-Leaning · D+8
- County
- — inherits STATE
- City
- — inherits STATE
ZIP-level market 99027
- Home prices YoY
- -20.5%
- Active inventory
- 57
- Price-to-rent
- 6.0×
Monthly cashflow live
- Estimated rent
- $1,723 medium interval (Pro) →
- Mortgage (P&I)
- −$655
- Tax est. 1.5%
- −$156 /mo · $1,874/yr
- Insurance
- −$52
- Flood insurance flood zone
- −$66 /mo · $798/yr
- HOA
- −$0
- Vacancy / Maint / Mgmt
- −$362
- Net cashflow
- $431
Break-even live
UW: 25.0% down · 7.5% · 30yr · 1.5% tax · 5.0% vac · 8.0% maint · 8.0% mgmt
Financing live
Cash to close
- Down payment
- $31,225
- Closing costs
- $3,747
- Reserves months
- —
- Total cash needed
- —
Loan-product check · same deal, 3 products live
Conventional
25% down · 7.5% · 30yr
- Down + closing
- —
- Monthly P&I
- —
- Monthly cashflow
- —
- DSCR
- —
- Eligible?
- —
Personal DTI + credit; lowest rate.
DSCR
20% down · 8.5% · 30yr
- Down + closing
- —
- Monthly P&I
- —
- Monthly cashflow
- —
- DSCR
- —
- Eligible?
- —
No personal income docs; deal must DSCR.
Hard money
10% down · 12.0% · 12mo
- Down + closing
- —
- Monthly P&I
- —
- Monthly cashflow
- —
- DSCR
- —
- Eligible?
- —
Short-term bridge; refi at stabilization.
Rent comps 4 comps
| Address | Beds | Baths | Sqft | Rent | $/sqft | DOM | Units | Dist |
|---|---|---|---|---|---|---|---|---|
| 17016 E Indiana Pkwy Spokane Valley, WA | 3.0 | 1.0–2.0 | 918 | $1,767 | $1.92 | 14d | 50 | 1.21mi |
| 18417 E Appleway Ave Spokane Valley, WA | 1.0–3.0 | 1.0–2.0 | 1025 | $1,645 | $1.60 | 14d | 8 | 1.34mi |
| 16621 E Indiana Ave Spokane Valley, WA | 1.0–3.0 | 1.0–2.0 | 980 | $1,724 | $1.76 | 14d | 27 | 1.36mi |
| 16609 E Desmet Ct Spokane Valley, WA | 1.0–3.0 | 1.0–2.0 | 1125 | $1,748 | $1.55 | 14d | 24 | 1.38mi |
Listing history 2 events
-
2026-06-17remarks 695-char remark
-
2026-06-17$124,900 Active 1 DOM
ⓘ Source: listings_history table (triggers on properties + properties_extension) + one-shot
backfill from property_details.listing_events for pre-trigger history.
Climate risk First Street
- Flood 9/10 Extreme FEMA zone X (unshaded) · 99% chance over 30 yrs
- Wildfire 6/10 Major
- Heat 3/10 Moderate 6 d/yr ≥93°F today · 12 d/yr by 30 yrs out
- Wind 1/10 Low
- Air quality 9/10 Extreme 14 unhealthy d/yr today · 15 by 30 yrs out
Nearby sold comps map
Loading sold comps map…
Walkable amenities ~0.75 mi
Loading nearby amenities…
Taxation est. · year 1
- Rental income
- $20,671
- − Mortgage interest
- −$6,996
- − Property taxes
- −$1,874
- − Insurance
- −$1,422
- − Repairs & maintenance
- −$1,654
- − Management
- −$1,654
- − Depreciation
- −$3,633
- Taxable income
- $3,438
- Est. tax owed @ 24.0%
- −$825
- After-tax cash flow
- $4,349/yr
For passive investors: Depreciation is non-cash, so a rental often shows a tax loss while cash-flowing — sheltering income. Rental losses are passive: they offset passive income freely, and up to $25,000/yr can offset ordinary (W-2) income if you actively participate and your MAGI is under $100k (phasing out to $0 by $150k); unused losses carry forward. On sale, claimed depreciation is recaptured at up to 25%, and gains may owe capital-gains tax (a 1031 exchange can defer both). Figures are a year-1 estimate at your 24.0% rate — not tax advice; consult a CPA.
Schools (NCES district)
- District
- East Valley School District (Spokane)
- NCES district ID
- 5302280
- Math proficiency
- 40% ▼ -5.00%
- Reading proficiency
- 56% ▼ -4.00%
- Median HH income
- $49,557
- Composite
- 43.15/100
- National rank
- #6603
- State rank
- #160 of 291 in WA
Livability — Spokane Valley
- Score
- 85/100
- State rank
- #31
- US rank
- #512
Category grades
Schools grade is shown separately in the Schools card above.
Census & demographics
- Census place
- Spokane Valley, WA
- City population
- 129,511
- Population (ZIP)
- 5,878
Population outlook (Spokane County) Hauer SSP2
- Today (2025)
- 531,314 people
- By 2030
- 549,278 · +3.4%
- By 2040
- 577,822 · +8.8%
- By 2050
- 598,188 · +12.6%
- By 2075
- 630,744 · +18.7%
- By 2100
- 622,360 · +17.1%
Race, ethnicity, and origin ACS 2023
- Neighborhood character
- Predominantly White (93%)
- Race & ethnicity
- White 93% Two or more races 3% Hispanic / Latino 3%
- Common ancestry
- Slovak 6% Portuguese 3% Lithuanian 2%
- Foreign-born
- 2%
Political lean MEDSL · Spokane
- 2024 margin
- Toss-up / Even · D 46.0% · R 51.0% · Other 3.0%
- 2008→2024 swing
- -3.8pp toward R · 2008: -1.1pp · 2024: -5.0pp
- All cycles
- 2024: R+5.0 2020: R+4.3 2016: R+8.3 2012: R+6.3 2008: R+1.1
Not yet ingested
- Civics
- —
Market trends
- HPI YoY
- ▼ -92.71%
- Current HPI
- 360.3438
- Rent YoY
- —
- Metro
- —
- State GDP YoY
- ▲ 4.65%
- F500 in state
- 22
Industry mix (Fortune 500 HQ in WA)
| Industry | F500 HQs | Revenue |
|---|---|---|
| Retail | 2 | $269B |
|
||
| Technology / Retail | 1 | $638B |
|
||
| Technology | 1 | $245B |
|
||
| Telecommunications | 1 | $38B |
|
||
| Food / Beverage | 1 | $36B |
|
||
| Automotive / Trucks | 1 | $34B |
|
||
Price history
+197.4% since first listed12 events — show timeline
- 2026-06-17 Listed $124,900 SPOKANEMLS as Distributed by MLS Grid
- 2015-10-21 Sold (MLS) $36,550 SPOKANEMLS as Distributed by MLS Grid
- 2015-10-19 Listing Removed — SPOKANEMLS as Distributed by MLS Grid
- 2015-08-28 Listed $36,950 SPOKANEMLS as Distributed by MLS Grid
- 2013-08-05 Sold (MLS) $36,500 SPOKANEMLS as Distributed by MLS Grid
- 2013-05-04 Listed $36,500 SPOKANEMLS as Distributed by MLS Grid
- 2011-11-02 Sold (MLS) $35,000 SPOKANEMLS as Distributed by MLS Grid
- 2011-08-25 Listed $35,900 SPOKANEMLS as Distributed by MLS Grid
- 2008-09-12 Sold (MLS) $31,500 SPOKANEMLS as Distributed by MLS Grid
- 2008-08-15 Listed $34,000 SPOKANEMLS as Distributed by MLS Grid
- 2006-02-02 Sold (MLS) $40,000 SPOKANEMLS as Distributed by MLS Grid
- 2005-10-02 Listed $42,000 SPOKANEMLS as Distributed by MLS Grid
Property tax history
-21.4%/yrLatest (2018): $178 · -58.0% YoY. Source: county tax records.
Cash-flow waterfall
monthlySold comps — $/sqft
last 12 mo · ≤1 miLoading sold comps…