 Duplex
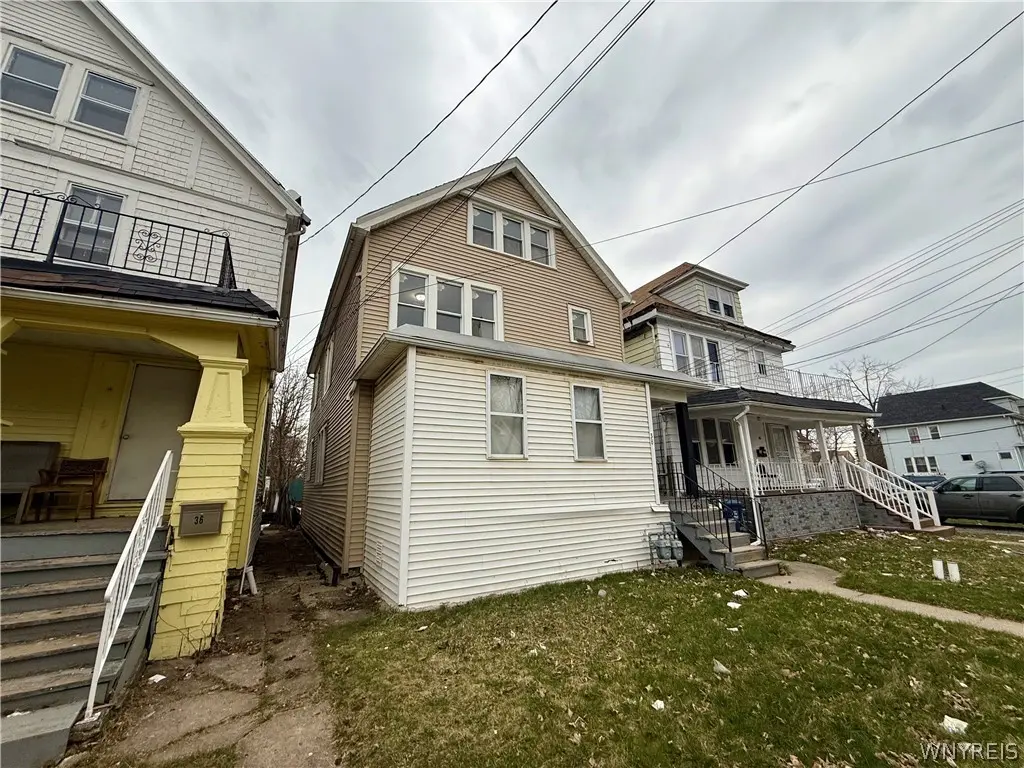
38 Richlawn Ave · Buffalo, NY
Flood risk 1/10 · Minimal
- FEMA flood zone
- X (unshaded)
- Chance of flooding over 30 yrs
- 0.0%
- Est. flood insurance / yr
- $473 – $860
Fire risk 1/10 · Minimal
- Est. fire insurance / yr
- $691 – $1,283
Heat risk 2/10 · Minimal
- Hot days now (above 93°F)
- 7 days/yr
- Hot days in 30 yrs
- 14 days/yr
Wind risk 1/10 · Minimal
- Chance of severe wind over 30 yrs
- —
Air-quality risk 3/10 · Minor
- Unhealthy air days now
- 2 days/yr
- Unhealthy air days in 30 yrs
- 3 days/yr
Risk factors via First Street. Map © Google.
Why this score? — see what drove the B+ grade
The composite is a weighted blend of 9 inputs, each scored 0–100. Each bar is that input's sub-score; the figure is the points it added to the 100-point composite (weight × sub-score).
- Cash flow +30.0/30.0
- ARV discount +15.0/15.0
- 1% rule +10.0/10.0
- DSCR +10.0/10.0
- Livability +3.9/5.0
- Schools +3.3/10.0
- Rent growth +2.7/5.0
- Condition / age +2.5/5.0
- Appreciation +0.0/10.0
$165,000
🖨 Deal sheet 📄 Offer letter ✓ Due diligence
Multi-family units
County records classify this as Multi-Family (2-4 Unit). Listing-text estimate: 2 units. confirmed
Listing remarks MLS
Welcome to 38 Richlawn Ave — A duplex that features two spacious units, making it perfect for both investors and owner-occupants. The lower unit offers 3 bedrooms and 1 full bathroom, while the upper unit includes 2 bedrooms and 1 full bathroom, providing flexible living arrangements and strong rental potential. The property has seen several key updates, including a newer roof, newer windows, one newer furnace, and a newer hot water tank—giving peace of mind and minimizing major capital expenses. Inside, you’ll find updated flooring throughout, creating a clean and modern feel for tenants or future occupants. Step outside to a large backyard, ideal for entertaining, gardening, or simply enjoying outdoor space—an added bonus for both units. Located in a convenient Buffalo neighborhood, 38 Richlawn Ave offers easy access to local shops, restaurants, schools, and parks. Commuting is a breeze with nearby access to major roadways and public transportation, making this an attractive location for tenants and homeowners alike. Whether you’re looking to expand your investment portfolio or live in one unit while generating income from the other, this property checks all the boxes.
Key facts
- 3,509 sq ft lot
- Garage
- Built 1925
Neighborhood map
What this means for you Summary
Snapshot
- This is a 2 × 2-bed/1.0-bath units multifamily listed at $165k.
Deal economics
- At list price, monthly cash flow is $918 ($11k/yr) — positive. Per door: $459/mo.
- The deal already cash-flows at list — no discount required.
- Meets the 1% rule at list price ($3k rent vs $165k).
- Recommended offer: $160k (3.0% below list) — sets the bar for market timing.
- Cap rate 13.0% vs local median 8.0% in Buffalo — top-decile yield for the area; either an underpriced asset or a hidden risk that comps aren't pricing in. Stress-test before assuming the spread holds.
Location & tenants
- Location reads 77/100 on livability (#195 in NY, #3,011 nationally) — a middle-class / working-renter tenant base. Strengths: commute A+, housing A+, health & safety A+; Watch: crime F, employment D-.
- Buffalo City School District (urban): math 41% / reading 40% proficiency, ranked #535 of 590 in NY (top 91%) — families likely to look elsewhere, expect single-tenant / working-renter base with shorter leases; 75% free/reduced lunch — lower-income household profile, screen leases tightly.
- Market conditions: Rents flat; 237 active listings in the ZIP; 18 comparable units currently listed for rent nearby; rentals at typical pace (median 15d on market — plan ~3-4 weeks tenant-placement turnaround); lower-income renter base — watch delinquency; 1,244 units permitted in Erie County in 2024 (563 in 5+ unit buildings).
- At $2,605/mo this rent would consume 70% of the median local household income ($45k/yr) (locally 2873% of renters already pay >50% of income on rent) — very limited rent-growth headroom before tenants either downsize or default.
Forward outlook
- Local home prices are declining (-3.0%/yr); year-one equity from $1k of loan paydown is wiped out by about $5k of value loss. Plan a longer hold.
- At projected returns (-3.0% appreciation + 0.7% rent growth), your $46k cash investment doubles in ~6 years — after that, you're playing with house money.
Negotiation context
- It's been on market 41 days — a 3% lower offer ($160k) is reasonable based on typical stale-listing flexibility.
- Current owner paid $60k; list at $165k implies a 175% gain — meaningful room to come down on a strong offer.
Risks & watch-outs
- Watch-outs: built in 1925 — expect roof / HVAC / electrical / plumbing capex.
Questions for the listing agent
- It's been on market 41 days. Have you received any prior offers? Is the seller open to a 3% concession, seller financing, or rate buy-down credit?
- Can we see the unit-by-unit rent roll, current vacancy, and any below-market leases? What's the average tenancy length?
- What capital expenditures (roof, boiler, parking lot, exteriors) have been made in the last 5 years, and what's planned in the next 2?
- Built in 1925 — when were the roof, HVAC, electrical panel, plumbing, and water heater last replaced?
- Is there a deadline driving the sale (1031 exchange, divorce, estate, relocation)? That informs how much negotiation room exists.
- Crime grade is F in this area — have there been break-ins, vandalism, or insurance claims at this property in the last 3 years? What carrier currently insures it and at what premium?
- What's the average days-on-market for RENTAL listings here right now (not sales)? A rising rental-DOM trend means longer vacancies and softer asking-rent achievability than the comps imply.
- What's the recent tenant-quality profile in this submarket — average credit score on applications, eviction rate, late-payment / NSF rate, and stable-employment percentage? A property-management company in the area should have these aggregated.
- How much new apartment / multifamily construction is in the pipeline within 1–3 miles? Heavy new supply (>2% of stock underway) typically softens rents 12–24 months out; light construction supports rent growth.
Investment metrics
- 1% rule
- 1.58% ✓
- Cap rate
- 12.97%
- Cash-on-cash
- 23.84%
- DSCR
- 2.06
- GRM
- 5.3
CMA / ARV
- ARV (median comp)
- $258,905
- List price
- $165,000
- Delta
- -36.27%
- Verdict
- UNDERPRICED
- Comps
- 20 within 1.0 mi
Show comp detail 12 sales within ~0.75 mi
| Address | Dist | Beds/Ba | Sqft | Sold | Price | $/sf | Match |
|---|---|---|---|---|---|---|---|
| 157 Victoria Ave | 0.14mi | 4/2.0 | 1,904 (+2%) | 9mo | $169,000 | $89 | 83 |
| 88 Marigold Ave | 0.10mi | 4/2.0 | 1,960 (+5%) | 8mo | $210,000 | $107 | 80 |
| 329 Jewett Ave | 0.08mi | 4/4.0 | 2,053 (+10%) | 8mo | $165,000 | $80 | 66 |
| 111 Marigold Ave | 0.15mi | 4/2.0 | 1,663 (-11%) | 14mo | $105,000 | $63 | 62 |
| 47 Parkridge Ave | 0.50mi | 4/2.0 | 1,804 (-4%) | 16mo | $120,000 | $67 | 58 |
| 114 Manhattan Ave | 0.17mi | 5/2.0 (+1) | 2,052 (+10%) | 16mo | $158,000 | $77 | 58 |
| 29 Thatcher Ave | 0.67mi | 4/2.0 | 1,866 (-0%) | 20mo | $72,000 | $39 | 51 |
| 42 Poultney Ave | 0.53mi | 4/2.0 | 2,036 (+9%) | 14mo | $160,000 | $79 | 49 |
| 128 Poultney Ave | 0.60mi | 4/2.0 | 1,959 (+5%) | 20mo | $191,000 | $97 | 48 |
| 96 Sussex St | 0.53mi | 5/2.0 (+1) | 2,152 (+15%) | 4mo | $255,000 | $118 | 42 |
| 475 Norfolk Ave | 0.72mi | 4/2.0 | 2,068 (+10%) | 8mo | $105,000 | $51 | 42 |
| 401 Cambridge Ave | 0.71mi | 4/2.0 | 1,962 (+5%) | 21mo | $230,000 | $117 | 41 |
Match score weights: distance 35% · size 25% · config 20% · recency 20%. Top-matched comps best support the ARV.
Projected returns pro-forma
-3.0% appreciation · 0.67% rent growth · sell at horizon
- IRR
- 14.4%
- Equity multiple
- 1.56×
- Total profit
- $25,781
- Equity at exit
- $24,602
- IRR
- 21.3%
- Equity multiple
- 2.61×
- Total profit
- $74,495
- Equity at exit
- $14,266
Cash invested: $46,200 (down + closing). Projections, not guarantees.
Landlord ↔ Tenant lean methodology
- Overall (STATE)
- 15 Strongly Tenant-Friendly
- State New York
- 15 Strongly Tenant-Friendly · D+10
- County
- — inherits STATE
- City
- — inherits STATE
ZIP-level market 14215
- Home prices YoY
- -30.0%
- Rents YoY
- 0.7%
- Active inventory
- 237
- Price-to-rent
- 10.6×
Monthly cashflow live
- Estimated rent
- $2,605 high interval (Pro) →
- Mortgage (P&I)
- −$865
- Tax est. 1.5%
- −$206 /mo · $2,475/yr
- Insurance
- −$69
- HOA
- −$0
- Vacancy / Maint / Mgmt
- −$547
- Net cashflow
- $918
Break-even live
2-unit breakdown (identical units grouped — click to expand)
| Units | Beds | Baths | Est. rent |
|---|---|---|---|
| 2× units | 2 | 1 | $2,604 |
| #1 | 2 | 1 | $1,302 |
| #2 | 2 | 1 | $1,302 |
| Total (2 units) | $2,605 | ||
UW: 25.0% down · 7.5% · 30yr · 1.5% tax · 5.0% vac · 8.0% maint · 8.0% mgmt
Financing live
Cash to close
- Down payment
- $41,250
- Closing costs
- $4,950
- Reserves months
- —
- Total cash needed
- —
Loan-product check · same deal, 3 products live
Conventional
25% down · 7.5% · 30yr
- Down + closing
- —
- Monthly P&I
- —
- Monthly cashflow
- —
- DSCR
- —
- Eligible?
- —
Personal DTI + credit; lowest rate.
DSCR
20% down · 8.5% · 30yr
- Down + closing
- —
- Monthly P&I
- —
- Monthly cashflow
- —
- DSCR
- —
- Eligible?
- —
No personal income docs; deal must DSCR.
Hard money
10% down · 12.0% · 12mo
- Down + closing
- —
- Monthly P&I
- —
- Monthly cashflow
- —
- DSCR
- —
- Eligible?
- —
Short-term bridge; refi at stabilization.
Rent comps 18 comps
| Address | Beds | Baths | Sqft | Rent | $/sqft | DOM | Units | Dist |
|---|---|---|---|---|---|---|---|---|
| 25 Parkridge Ave Buffalo, NY | 3.0 | 1.0 | 1914 | $1,350 | $0.71 | 14d | 1 | 0.50mi |
| 89 Lasalle Ave Buffalo, NY | 1.0–4.0 | 1.0–4.0 | 1024 | $2,997 | $2.93 | 1d | 10 | 0.81mi |
| 202 Summit Ave Unit 1 Buffalo, NY | 3.0 | 1.0 | 2000 | $2,400 | $1.20 | 23d | 1 | 0.91mi |
| 59 Lisbon Ave Buffalo, NY | 3.0 | 1.0 | 2521 | $1,250 | $0.50 | 23d | 1 | 1.00mi |
| 263 Minnesota Ave Unit Upper Buffalo, NY | 3.0 | 1.0 | 1242 | $1,500 | $1.21 | 14d | 1 | 1.02mi |
| 175 Lisbon Ave Buffalo, NY | 5.0 | 2.0 | 2000 | $2,500 | $1.25 | 14d | 1 | 1.03mi |
| 85 Highgate Ave Buffalo, NY | 5.0 | 2.0 | 2193 | $3,750 | $1.71 | 14d | 1 | 1.07mi |
| 222 Lisbon Ave Buffalo, NY | 4.0 | 1.0 | 1300 | $1,400 | $1.08 | 23d | 1 | 1.09mi |
| 222 Lisbon Ave Unit Upper Buffalo, NY | 3.0 | 1.0 | 1400 | $1,400 | $1.00 | 43d | 1 | 1.09mi |
| 24 Custer St Buffalo, NY | 5.0 | 2.0 | 2500 | $3,000 | $1.20 | 14d | 1 | 1.11mi |
| 65 Northrup Pl Buffalo, NY | 5.0 | 2.0 | 1467 | $2,500 | $1.70 | 14d | 1 | 1.14mi |
| 563 Humboldt Pkwy Buffalo, NY | 3.0 | 1.0 | 2004 | $1,200 | $0.60 | 23d | 1 | 1.19mi |
| 163 Carmel Rd Buffalo, NY | 3.0 | 1.0 | 1400 | $1,800 | $1.29 | 2d | 1 | 1.29mi |
| 73 Inter Park Ave Buffalo, NY | 3.0 | 1.0 | 2080 | $1,300 | $0.62 | 14d | 1 | 1.38mi |
| 60 Englewood Ave Buffalo, NY | 4.0 | 1.0 | 1400 | $1,650 | $1.18 | 1d | 1 | 1.39mi |
| 184 Butler Ave Unit 1545840P Buffalo, NY | 4.0 | 1.0 | 1496 | $3,226 | $2.16 | 14d | 1 | 1.42mi |
| 102 Englewood Ave Buffalo, NY | 4.0 | 1.0 | 2426 | $2,750 | $1.13 | 1d | 1 | 1.42mi |
| 91 Englewood Ave Buffalo, NY | 4.0 | 1.0 | 2500 | $2,000 | $0.80 | 1d | 1 | 1.44mi |
Listing history 3 events
-
2026-05-12status Pending 1219-char remark
Show marketing remark (1219 chars)
Welcome to 38 Richlawn Ave — A duplex that features two spacious units, making it perfect for both investors and owner-occupants. The lower unit offers 3 bedrooms and 1 full bathroom, while the upper unit includes 2 bedrooms and 1 full bathroom, providing flexible living arrangements and strong rental potential. The property has seen several key updates, including a newer roof, newer windows, one newer furnace, and a newer hot water tank—giving peace of mind and minimizing major capital expenses. Inside, you’ll find updated flooring throughout, creating a clean and modern feel for tenants or future occupants. Step outside to a large backyard, ideal for entertaining, gardening, or simply enjoying outdoor space—an added bonus for both units. Located in a convenient Buffalo neighborhood, 38 Richlawn Ave offers easy access to local shops, restaurants, schools, and parks. Commuting is a breeze with nearby access to major roadways and public transportation, making this an attractive location for tenants and homeowners alike. Whether you’re looking to expand your investment portfolio or live in one unit while generating income from the other, this property checks all the boxes.
-
2026-04-01$165,000 Active 1219-char remark
Show marketing remark (1219 chars)
Welcome to 38 Richlawn Ave — A duplex that features two spacious units, making it perfect for both investors and owner-occupants. The lower unit offers 3 bedrooms and 1 full bathroom, while the upper unit includes 2 bedrooms and 1 full bathroom, providing flexible living arrangements and strong rental potential. The property has seen several key updates, including a newer roof, newer windows, one newer furnace, and a newer hot water tank—giving peace of mind and minimizing major capital expenses. Inside, you’ll find updated flooring throughout, creating a clean and modern feel for tenants or future occupants. Step outside to a large backyard, ideal for entertaining, gardening, or simply enjoying outdoor space—an added bonus for both units. Located in a convenient Buffalo neighborhood, 38 Richlawn Ave offers easy access to local shops, restaurants, schools, and parks. Commuting is a breeze with nearby access to major roadways and public transportation, making this an attractive location for tenants and homeowners alike. Whether you’re looking to expand your investment portfolio or live in one unit while generating income from the other, this property checks all the boxes.
-
2021-01-08soldstatus $60,000
ⓘ Source: listings_history table (triggers on properties + properties_extension) + one-shot
backfill from property_details.listing_events for pre-trigger history.
Climate risk First Street
- Flood 1/10 Low FEMA zone X (unshaded) · 0% chance over 30 yrs
- Wildfire 1/10 Low
- Heat 2/10 Low 7 d/yr ≥93°F today · 14 d/yr by 30 yrs out
- Wind 1/10 Low
- Air quality 3/10 Moderate 2 unhealthy d/yr today · 3 by 30 yrs out
Nearby sold comps map
Loading sold comps map…
Walkable amenities ~0.75 mi
Loading nearby amenities…
Taxation est. · year 1
- Rental income
- $31,260
- − Mortgage interest
- −$9,243
- − Property taxes
- −$2,475
- − Insurance
- −$825
- − Repairs & maintenance
- −$2,501
- − Management
- −$2,501
- − Depreciation
- −$4,800
- Taxable income
- $8,916
- Est. tax owed @ 24.0%
- −$2,140
- After-tax cash flow
- $8,872/yr
For passive investors: Depreciation is non-cash, so a rental often shows a tax loss while cash-flowing — sheltering income. Rental losses are passive: they offset passive income freely, and up to $25,000/yr can offset ordinary (W-2) income if you actively participate and your MAGI is under $100k (phasing out to $0 by $150k); unused losses carry forward. On sale, claimed depreciation is recaptured at up to 25%, and gains may owe capital-gains tax (a 1031 exchange can defer both). Figures are a year-1 estimate at your 24.0% rate — not tax advice; consult a CPA.
Schools (NCES district)
- District
- Buffalo City School District
- NCES district ID
- 3605850
- Math proficiency
- 41% ▲ 11.00%
- Reading proficiency
- 40% ▲ 7.00%
- Median HH income
- $31,665
- Composite
- 33.17/100
- National rank
- #5544
- State rank
- #535 of 590 in NY
Livability — Buffalo
- Score
- 77/100
- State rank
- #195
- US rank
- #3011
Category grades
Schools grade is shown separately in the Schools card above.
Census & demographics
- Census place
- Buffalo, NY
- County
- Erie County · 714,559 people
- City population
- 440,021
- Metro
- Buffalo-Cheektowaga, NY
- Population (ZIP)
- 42,524
- Household income
- $44,955
- Rent vs Own
- Severe rent burden
- 2873.0
Population outlook (Erie County) Hauer SSP2
- Today (2025)
- 933,037 people
- By 2030
- 935,181 · +0.2%
- By 2040
- 928,531 · -0.5%
- By 2050
- 905,725 · -2.9%
- By 2075
- 834,037 · -10.6%
- By 2100
- 708,033 · -24.1%
Race, ethnicity, and origin ACS 2023
- Neighborhood character
- Predominantly Black (67%)
- Race & ethnicity
- Black 67% White 15% Asian 7% Hispanic / Latino 6% Two or more races 6%
- Hispanic origin (detail)
- Puerto Rican 4%
- Common ancestry
- Romanian 4% Lithuanian 1% Italian 1%
- Foreign-born
- 9% · Canada, China
- Languages at home
- 88% English-only · Other Indo-European 4% Spanish 4% Chinese 1%
Political lean MEDSL · Erie
- 2024 margin
- Lean D (+9.7) · D 54.8% · R 45.2%
- 2008→2024 swing
- -7.9pp toward R · 2008: 17.5pp · 2024: 9.7pp
- All cycles
- 2024: D+9.7 2020: D+14.7 2016: D+4.8 2012: D+15.6 2008: D+17.5
Not yet ingested
- Civics
- —
Market trends
- HPI YoY
- ▼ -126.29%
- Current HPI
- 295.2966
- Rent YoY
- ▲ 0.67%
- Metro
- Buffalo-Cheektowaga, NY
- State GDP YoY
- ▲ 2.60%
- F500 in state
- 92
Industry mix (Fortune 500 HQ in NY)
| Industry | F500 HQs | Revenue |
|---|---|---|
| Financial Services | 10 | $950B |
|
||
| Consumer Goods | 9 | $162B |
|
||
| Insurance | 4 | $225B |
|
||
| Telecommunications | 2 | $144B |
|
||
| Pharmaceuticals | 2 | $112B |
|
||
| Media / Entertainment | 2 | $69B |
|
||
Price history
+175.0% since first listed3 events — show timeline
- 2026-05-12 Pending — WNYREIS
- 2026-04-01 Listed $165,000 WNYREIS
- 2021-01-08 Sold (Public Records) $60,000 Public Records
Property tax history
+5.7%/yrLatest (2025): $219 · +0.0% YoY. Source: county tax records.
Cash-flow waterfall
monthlySold comps — $/sqft
last 12 mo · ≤1 miLoading sold comps…