5711 Gardens Dr · Desoto Lakes, FL
Flood risk 1/10 · Minimal
- FEMA flood zone
- X (unshaded)
- Chance of flooding over 30 yrs
- 0.0%
- Est. flood insurance / yr
- $507 – $1,088
Fire risk 1/10 · Minimal
- Est. fire insurance / yr
- $947 – $1,759
Heat risk 10/10 · Severe
- Hot days now (above 107°F)
- 7 days/yr
- Hot days in 30 yrs
- 30 days/yr
Wind risk 10/10 · Severe
- Chance of severe wind over 30 yrs
- 99.0%
Air-quality risk 2/10 · Minimal
- Unhealthy air days now
- 1 days/yr
- Unhealthy air days in 30 yrs
- 1 days/yr
Risk factors via First Street. Map © Google.
Why this score? — see what drove the C grade
The composite is a weighted blend of 9 inputs, each scored 0–100. Each bar is that input's sub-score; the figure is the points it added to the 100-point composite (weight × sub-score).
- Cash flow +25.2/30.0
- DSCR +8.3/10.0
- ARV discount +7.5/15.0
- 1% rule +6.5/10.0
- Schools +4.4/10.0
- Livability +3.9/5.0
- Condition / age +2.5/5.0
- Rent growth +1.5/5.0
- Appreciation +0.0/10.0
$160,000
🖨 Deal sheet 📄 Offer letter ✓ Due diligence
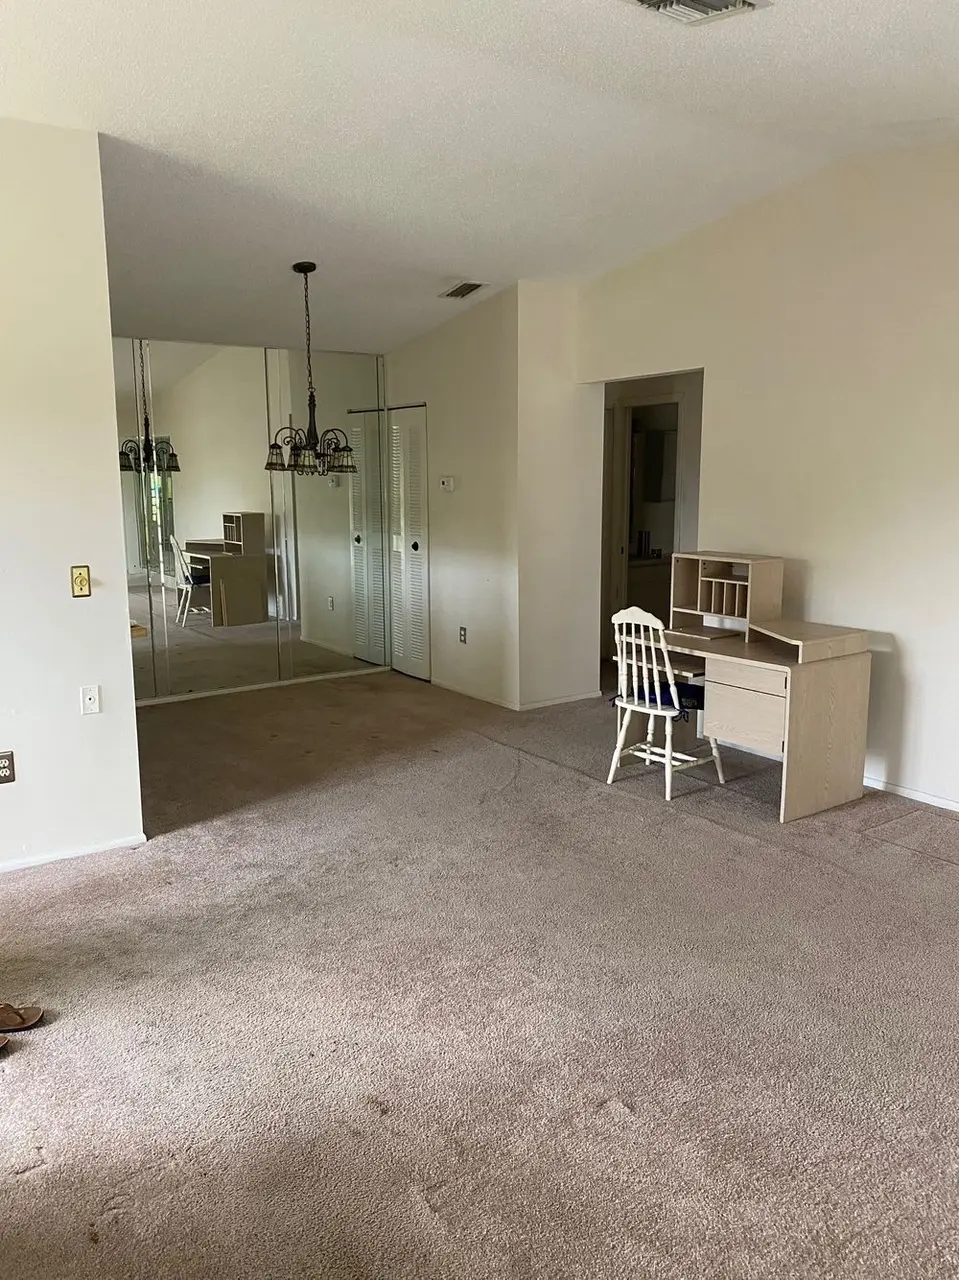
Listing remarks MLS
Large corner unit, new paint, new carpet, cathedral ceilings, pass-through breakfast bar, new water heater and newer appliances. Turnkey Furnished with hide-a-bed. Good storage and well run condo as sociation. Assigned parking and plentiful guest parking.
Key facts
- Built 1985
- Listed 14 days
Tags
Neighborhood map
What this means for you Summary
Snapshot
- This is a 1-bed/1.0-bath condo listed at $160k.
Deal economics
- At list price, monthly cash flow is $361 ($4k/yr) — positive.
- The deal already cash-flows at list — no discount required.
- Meets the 1% rule at list price ($2k rent vs $160k).
- Cap rate 9.0% vs local median 4.4% in Desoto Lakes — top-decile yield for the area; either an underpriced asset or a hidden risk that comps aren't pricing in. Stress-test before assuming the spread holds.
Location & tenants
- Location reads 77/100 on livability (#189 in FL, #3,003 nationally) — a middle-class / working-renter tenant base. Strengths: crime A+, housing A+, health & safety A-; Watch: schools C-, amenities F.
- Manatee (suburban): math 54% / reading 50% proficiency, ranked #26 of 73 in FL (top 36%) — acceptable for families but not a draw, mixed tenant base, ~2y average lease.
- Market conditions: Rents falling (-4.1%/yr); 386 active listings in the ZIP; 16 comparable units currently listed for rent nearby; rentals at typical pace (median 24d on market — plan ~3-4 weeks tenant-placement turnaround); solid renter incomes; 7,472 units permitted in Manatee County in 2024 (1,782 in 5+ unit buildings).
Forward outlook
- Local home prices are declining (-3.0%/yr); year-one equity from $1k of loan paydown is wiped out by about $5k of value loss. Plan a longer hold.
- Manatee County population projected at +43% by 2050 — long-run rental-demand tailwind backs the buy-and-hold thesis.
Negotiation context
- Only 14 days on market — expect competitive offers; lowballing is unlikely to land.
- 2 sale attempts since 20y ago with the ask held roughly flat each time — persistent listings suggest the price (not the market) is what's stuck; bring a comps-based counter.
Risks & watch-outs
- Climate carrying-cost: severe wind risk, 99% chance of damaging wind over 30y; extreme-heat days projected 7→30/yr by 2055 (HVAC capex compounding) — expect insurance premiums to compound above CPI over the hold.
Questions for the listing agent
- Any open or pending special assessments — roof, HVAC, plumbing, elevator, façade? What's the per-unit balance and payoff schedule, and is the seller paying it off at close or rolling it to the buyer?
- Is there a deadline driving the sale (1031 exchange, divorce, estate, relocation)? That informs how much negotiation room exists.
- What's the average days-on-market for RENTAL listings here right now (not sales)? A rising rental-DOM trend means longer vacancies and softer asking-rent achievability than the comps imply.
- What's the recent tenant-quality profile in this submarket — average credit score on applications, eviction rate, late-payment / NSF rate, and stable-employment percentage? A property-management company in the area should have these aggregated.
- How much new apartment / multifamily construction is in the pipeline within 1–3 miles? Heavy new supply (>2% of stock underway) typically softens rents 12–24 months out; light construction supports rent growth.
Investment metrics
- 1% rule
- 1.15% ✓
- Cap rate
- 9.00%
- Cash-on-cash
- 9.66%
- DSCR
- 1.43
- GRM
- 7.2
CMA / ARV
No comps found within radius.
Projected returns pro-forma
-3.0% appreciation · 0.0% rent growth · sell at horizon
- IRR
- -5.1%
- Equity multiple
- 0.81×
- Total profit
- $-8,327
- Equity at exit
- $23,857
- IRR
- 0.6%
- Equity multiple
- 1.03×
- Total profit
- $1,563
- Equity at exit
- $13,834
Cash invested: $44,800 (down + closing). Projections, not guarantees.
Landlord ↔ Tenant lean methodology
- Overall (STATE)
- 87 Strongly Landlord-Friendly
- State Florida
- 87 Strongly Landlord-Friendly · R+3
- County
- — inherits STATE
- City
- — inherits STATE
ZIP-level market 34243
- Home prices YoY
- -23.0%
- Rents YoY
- -4.1%
- Active inventory
- 386
- Price-to-rent
- 7.2×
Monthly cashflow live
- Estimated rent
- $1,841 high interval (Pro) →
- Mortgage (P&I)
- −$839
- Tax from tax record
- −$188 /mo · $2,258/yr
- Insurance
- −$67
- HOA
- −$0
- Vacancy / Maint / Mgmt
- −$387
- Net cashflow
- $361
Break-even live
UW: 25.0% down · 7.5% · 30yr · 1.5% tax · 5.0% vac · 8.0% maint · 8.0% mgmt
Financing live
Cash to close
- Down payment
- $40,000
- Closing costs
- $4,800
- Reserves months
- —
- Total cash needed
- —
Loan-product check · same deal, 3 products live
Conventional
25% down · 7.5% · 30yr
- Down + closing
- —
- Monthly P&I
- —
- Monthly cashflow
- —
- DSCR
- —
- Eligible?
- —
Personal DTI + credit; lowest rate.
DSCR
20% down · 8.5% · 30yr
- Down + closing
- —
- Monthly P&I
- —
- Monthly cashflow
- —
- DSCR
- —
- Eligible?
- —
No personal income docs; deal must DSCR.
Hard money
10% down · 12.0% · 12mo
- Down + closing
- —
- Monthly P&I
- —
- Monthly cashflow
- —
- DSCR
- —
- Eligible?
- —
Short-term bridge; refi at stabilization.
Rent comps 16 comps
| Address | Beds | Baths | Sqft | Rent | $/sqft | DOM | Units | Dist |
|---|---|---|---|---|---|---|---|---|
| 5735 Gardens Dr Unit 5735 Sarasota, FL | 2.0 | 1.0 | 1068 | $2,000 | $1.87 | 23d | 1 | 0.03mi |
| 5662 Gardens Dr #104 Sarasota, FL | 2.0 | 2.0 | 1068 | $1,950 | $1.83 | 23d | 1 | 0.11mi |
| 8445 Gardens Cir Sarasota, FL | 1.0–3.0 | 1.0–2.0 | 973 | $1,532 | $1.57 | 2d | 29 | 0.21mi |
| 6104 Turnbury Park Dr Sarasota, FL | 1.0–3.0 | 1.0–2.0 | 1065 | $1,584 | $1.49 | 1d | 29 | 0.29mi |
| 7886 Eagle Creek Dr Unit 7886 Sarasota, FL | 2.0 | 2.0 | 983 | $3,300 | $3.36 | 23d | 1 | 0.72mi |
| 7794 Eagle Creek Dr #7794 Sarasota, FL | 2.0 | 2.0 | 983 | $1,800 | $1.83 | 21d | 1 | 0.77mi |
| 7752 Eagle Creek Dr Unit 7752 Sarasota, FL | 2.0 | 2.0 | 983 | $1,650 | $1.68 | 16d | 1 | 0.82mi |
| 8121 45th Ct E Sarasota, FL | 2.0 | 2.0 | 1000 | $1,695 | $1.70 | 2d | 1 | 1.03mi |
| 7887 Lockwood Ridge Rd Sarasota, FL | 1.0–2.0 | 1.0–2.0 | 916 | $1,499 | $1.64 | 2d | 16 | 1.15mi |
| 7885 N Lockwood Ridge Rd Unit 315 Sarasota, FL | 1.0 | 1.0 | 656 | $1,649 | $2.51 | 23d | 1 | 1.20mi |
| 7885 N Lockwood Ridge Rd Sarasota, FL | 2.0 | 1.0 | 1025 | $1,749 | $1.71 | 23d | 1 | 1.20mi |
| 7351 W Country Club Dr N #202 Sarasota, FL | 2.0 | 2.0 | 1118 | $4,300 | $3.85 | 23d | 1 | 1.31mi |
| 7234 Eleanor Cir #203 Sarasota, FL | 2.0 | 2.0 | 1064 | $2,150 | $2.02 | 16d | 1 | 1.44mi |
| 7251 W Country Club Dr N #226 Sarasota, FL | 2.0 | 2.0 | 1118 | $2,000 | $1.79 | 23d | 1 | 1.45mi |
| 7231 W Country Club Dr N #232 Sarasota, FL | 2.0 | 2.0 | 909 | $2,000 | $2.20 | 23d | 1 | 1.47mi |
| 7211 W Country Club Dr N #133 Sarasota, FL | 2.0 | 2.0 | 909 | $1,500 | $1.65 | 11d | 1 | 1.49mi |
HOA detail condo
- Monthly dues
- $0 · $0/yr
- Likely covers
- waterparking
- Assessments
- None detected in remarks — confirm with the listing agent.
Listing history 11 events
-
2026-06-18days on market $160,000 Active 14 DOM
-
2026-06-17days on market $160,000 Active 13 DOM
-
2026-06-16days on market $160,000 Active 12 DOM
-
2026-06-15days on market $160,000 Active 11 DOM
-
2026-06-13days on market $160,000 Active 9 DOM
-
2026-06-13days on market $160,000 Active 8 DOM
-
2026-06-10days on market $160,000 Active 6 DOM
-
2026-06-09days on market $160,000 Active 5 DOM
-
2026-06-08days on market $160,000 Active 4 DOM
-
2026-06-08remarks 160-char remark
-
2026-06-08$160,000 Active 3 DOM
ⓘ Source: listings_history table (triggers on properties + properties_extension) + one-shot
backfill from property_details.listing_events for pre-trigger history.
Tax reassessment forecast FL · Resets to sale price
- Current annual tax
- $2,258 · $188/mo
- Projected year-2 tax
- $2,258 · $188/mo
- Expected delta
- $0/yr ($0/mo · 0.0%)
ⓘ Screening estimate from a state-policy table — verify with the county assessor before closing.
Climate risk First Street
- Flood 1/10 Low FEMA zone X (unshaded) · 0% chance over 30 yrs
- Wildfire 1/10 Low
- Heat 10/10 Extreme 7 d/yr ≥107°F today · 30 d/yr by 30 yrs out
- Wind 10/10 Extreme 99% chance of damaging wind over 30 yrs
- Air quality 2/10 Low 1 unhealthy d/yr today · 1 by 30 yrs out
Nearby sold comps map
Loading sold comps map…
Walkable amenities ~0.75 mi
Loading nearby amenities…
Taxation est. · year 1
- Rental income
- $22,095
- − Mortgage interest
- −$8,962
- − Property taxes
- −$2,258
- − Insurance
- −$800
- − Repairs & maintenance
- −$1,768
- − Management
- −$1,768
- − Depreciation
- −$4,655
- Taxable income
- $1,885
- Est. tax owed @ 24.0%
- −$452
- After-tax cash flow
- $3,876/yr
For passive investors: Depreciation is non-cash, so a rental often shows a tax loss while cash-flowing — sheltering income. Rental losses are passive: they offset passive income freely, and up to $25,000/yr can offset ordinary (W-2) income if you actively participate and your MAGI is under $100k (phasing out to $0 by $150k); unused losses carry forward. On sale, claimed depreciation is recaptured at up to 25%, and gains may owe capital-gains tax (a 1031 exchange can defer both). Figures are a year-1 estimate at your 24.0% rate — not tax advice; consult a CPA.
Schools (NCES district)
- District
- Manatee
- NCES district ID
- 1201230
- Math proficiency
- 54% ▼ -6.00%
- Reading proficiency
- 50% ▼ -2.00%
- Median HH income
- $49,607
- Composite
- 44.43/100
- National rank
- #2806
- State rank
- #26 of 73 in FL
Livability — Desoto Lakes
- Score
- 77/100
- State rank
- #189
- US rank
- #3003
Category grades
Schools grade is shown separately in the Schools card above.
Census & demographics
- County
- Manatee County · 416,364 people
- Metro
- North Port-Sarasota-Bradenton, FL
- Population (ZIP)
- 32,773
- Household income
- $81,219
- Rent vs Own
- Severe rent burden
- 1138.0
Population outlook (Manatee County) Hauer SSP2
- Today (2025)
- 447,342 people
- By 2030
- 488,911 · +9.3%
- By 2040
- 567,934 · +27.0%
- By 2050
- 637,995 · +42.6%
- By 2075
- 781,970 · +74.8%
- By 2100
- 848,272 · +89.6%
Race, ethnicity, and origin ACS 2023
- Neighborhood character
- Predominantly White (76%)
- Race & ethnicity
- White 76% Hispanic / Latino 14% Two or more races 11% Asian 3% Black 3%
- Hispanic origin (detail)
- Mexican 5% Puerto Rican 3% Cuban 1%
- Common ancestry
- Romanian 5% Lithuanian 3% Slovak 2%
- Foreign-born
- 16% · Canada, Vietnam, Jamaica
- Languages at home
- 81% English-only · Spanish 8% Russian/Polish/Slavic 3% Other Indo-European 3%
Political lean MEDSL · Manatee
- 2024 margin
- Strong R (+23.5) · D 37.9% · R 61.4%
- 2008→2024 swing
- -16.5pp toward R · 2008: -7.0pp · 2024: -23.5pp
- All cycles
- 2024: R+23.5 2020: R+16.1 2016: R+17.1 2012: R+12.5 2008: R+7.0
Not yet ingested
- Civics
- —
Market trends
- HPI YoY
- ▼ -83.67%
- Current HPI
- 280.5372
- Rent YoY
- ▼ -4.14%
- Metro
- North Port-Sarasota-Bradenton, FL
- State GDP YoY
- ▲ 3.28%
- F500 in state
- 36
Industry mix (Fortune 500 HQ in FL)
| Industry | F500 HQs | Revenue |
|---|---|---|
| Industrial Technology | 2 | $29B |
|
||
| Insurance | 2 | $17B |
|
||
| Retail | 1 | $60B |
|
||
| Technology Distribution | 1 | $58B |
|
||
| Homebuilding | 1 | $35B |
|
||
| Technology Manufacturing | 1 | $35B |
|
||
Price history
+220.0% since first listed8 events — show timeline
- 2026-06-04 Listed $160,000 ForSaleByOwner.com
- 2006-05-05 Sold (Public Records) $169,900 Public Records
- 2006-05-02 Sold (MLS) $169,900 Stellar MLS as Distributed by MLS Grid
- 2006-04-03 Listed $169,900 Stellar MLS as Distributed by MLS Grid
- 2005-03-10 Sold (Public Records) $132,000 Public Records
- 1998-12-23 Sold (Public Records) $54,000 Public Records
- 1994-07-14 Sold (Public Records) $49,000 Public Records
- 1990-12-31 Sold (Public Records) $50,000 Public Records
Property tax history
+7.9%/yrLatest (2025): $2,258 · -4.4% YoY. Source: county tax records.
Cash-flow waterfall
monthlySold comps — $/sqft
last 12 mo · ≤1 miLoading sold comps…