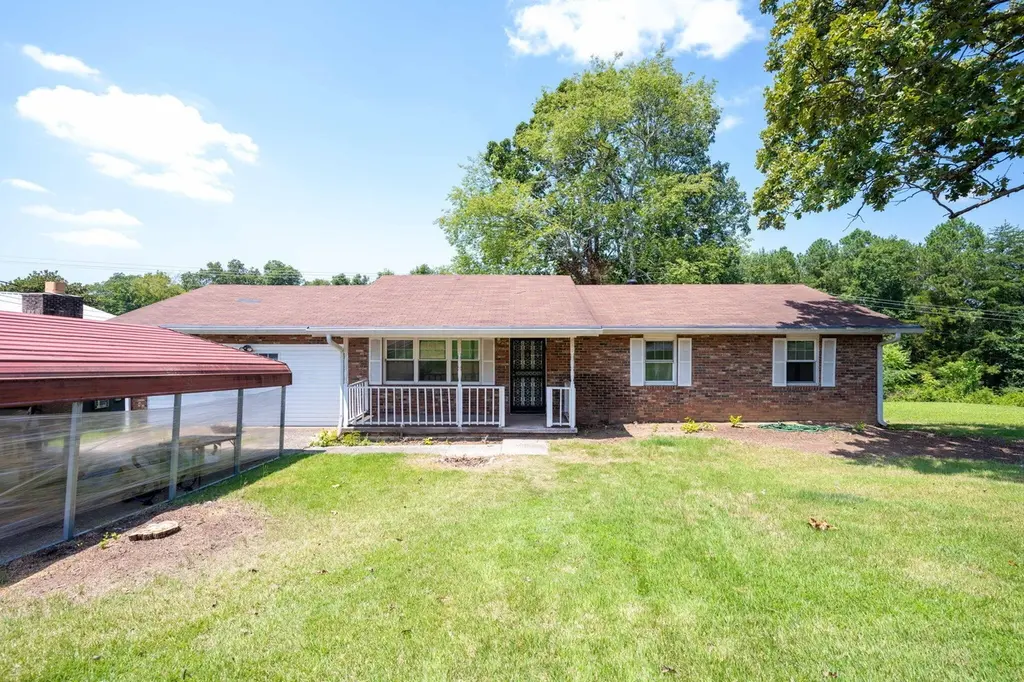
4803 Cordelia Ln · Chattanooga, TN
Flood risk 1/10 · Minimal
- FEMA flood zone
- X (unshaded)
- Chance of flooding over 30 yrs
- 0.0%
- Est. flood insurance / yr
- $507 – $1,088
Fire risk 3/10 · Minor
- Est. fire insurance / yr
- $949 – $1,763
Heat risk 6/10 · Moderate
- Hot days now (above 104°F)
- 7 days/yr
- Hot days in 30 yrs
- 19 days/yr
Wind risk 4/10 · Minor
- Chance of severe wind over 30 yrs
- 10.0%
Air-quality risk 3/10 · Minor
- Unhealthy air days now
- 2 days/yr
- Unhealthy air days in 30 yrs
- 2 days/yr
Risk factors via First Street. Map © Google.
Why this score? — see what drove the D+ grade
The composite is a weighted blend of 9 inputs, each scored 0–100. Each bar is that input's sub-score; the figure is the points it added to the 100-point composite (weight × sub-score).
- ARV discount +15.0/15.0
- Cash flow +14.4/30.0
- DSCR +4.4/10.0
- Livability +3.9/5.0
- 1% rule +3.0/10.0
- Schools +2.7/10.0
- Condition / age +2.5/5.0
- Rent growth +2.4/5.0
- Appreciation +0.0/10.0
$223,000
🖨 Deal sheet (PDF) 📄 Offer letter ✓ Due diligence
Listing remarks MLS
Great Investment Opportunity !! ALL brick , one level rancher is the one . For the investor or homeowner plenty of potential equity for a flip or buy and hold. The location is minutes from the mall, Volkswagen, Amazon and the lakes. Make this house your home !!
Key facts
- One level rancher
- 0.25 acre lot
- 2 parking spots
Tags
Property features AI
Exterior
- Parking: Detached parking; Carport with 2 spaces; 2 covered parking spaces (2 total)
- Security: Smoke detectors
- Utilities: Public water; Public sewer; Electricity available; Water available
- Home design: Residential property; Three or more levels; Existing construction
- Construction: Brick and other construction materials; Other roof; Block foundation
- Exterior features: 0.25-acre lot (approx. 90 x 126.7); Other lot features
Interior
- Kitchen: Microwave; Electric range; Dishwasher; Pantry
- Bedrooms: 3 bedrooms (all on the main level)
- Flooring: Carpet; Wood
- Bathrooms: 1 full bath; 1 half bath
- Heating & cooling: Central heating (electric); Central air conditioning (electric)
- Interior features: Open floorplan; Crawl space basement
Neighborhood map
What this means for you Summary
Snapshot
- This is a 3-bed/1.5-bath single-family listed at $223k.
Deal economics
- At list price, monthly cash flow is $43 ($517/yr) — positive.
- The deal already cash-flows at list — no discount required.
- To meet the 1% rule (rent ≥ 1% of price), the offer needs to be $178k (20.1% below list).
- Recommended offer: $178k (20.1% below list) — sets the bar for 1% rule.
- Cap rate 6.5% vs local median 3.4% in Chattanooga — top-decile yield for the area; either an underpriced asset or a hidden risk that comps aren't pricing in. Stress-test before assuming the spread holds.
Location & tenants
- Location reads 78/100 on livability (#3 in TN, #2,582 nationally) — a middle-class / working-renter tenant base. Strengths: amenities A+, commute A+, cost of living A+; Watch: employment D+, crime F.
- Hamilton County (urban): math 31% / reading 31% proficiency, ranked #42 of 139 in TN (top 30%) — families likely to look elsewhere, expect single-tenant / working-renter base with shorter leases.
- Zoned schools: Harrison Elementary (math 20% / reading 19%, grade F, #654 of 952 statewide, top 72%, 1,013 students, 0% FRL); Central High School (math 8% / reading 32%, grade F, #183 of 332 statewide, top 59%, 749 students, 0% FRL) — zoned schools average 0% FRL vs 52% district-wide (52 pts lower); this property's tenant base skews higher-income than the district average.
- Market conditions: Rents soft (-0.2%/yr); 99 active listings in the ZIP; 4 comparable units currently listed for rent nearby; rentals at typical pace (median 25d on market — plan ~3-4 weeks tenant-placement turnaround); 2,133 units permitted in Hamilton County in 2024 (405 in 5+ unit buildings).
- This rent runs 30% of the median local income ($71k/yr) — at the standard rent-burdened threshold; future hikes will face affordability resistance.
Forward outlook
- Local home prices are declining (-3.0%/yr); year-one equity from $2k of loan paydown is wiped out by about $7k of value loss. Plan a longer hold.
- Hamilton County population projected at +23% by 2050 — long-run rental-demand tailwind backs the buy-and-hold thesis.
Negotiation context
- It's been on market 56 days — a 3% lower offer ($216k) is reasonable based on typical stale-listing flexibility.
- 4 sale attempts since 2y ago with the ask held roughly flat each time — persistent listings suggest the price (not the market) is what's stuck; bring a comps-based counter.
Risks & watch-outs
- Climate carrying-cost: extreme-heat days projected 7→19/yr by 2055 (HVAC capex compounding) — expect insurance premiums to compound above CPI over the hold.
Questions for the listing agent
- It's been on market 56 days. Have you received any prior offers? Is the seller open to a 20% concession, seller financing, or rate buy-down credit?
- Built in 1968 — when were the roof, HVAC, electrical panel, plumbing, and water heater last replaced?
- Is there a deadline driving the sale (1031 exchange, divorce, estate, relocation)? That informs how much negotiation room exists.
- Schools are F-rated, which usually means shorter tenancies and higher turnover. Who's the typical renter profile here, and what's been the actual vacancy rate?
- Crime grade is F in this area — have there been break-ins, vandalism, or insurance claims at this property in the last 3 years? What carrier currently insures it and at what premium?
- The area grade is low — what's the realistic commute time and amenity access for the typical tenant pool here? Any planned neighborhood developments (good or bad) we should know about?
- What's the average days-on-market for RENTAL listings here right now (not sales)? A rising rental-DOM trend means longer vacancies and softer asking-rent achievability than the comps imply.
- What's the recent tenant-quality profile in this submarket — average credit score on applications, eviction rate, late-payment / NSF rate, and stable-employment percentage? A property-management company in the area should have these aggregated.
- How much new for-sale + rental construction is in the pipeline within 1–3 miles? Heavy new supply typically softens prices + rents 12–24 months out; constrained supply supports both.
Investment metrics
- 1% rule
- 0.80% ✗
- Cap rate
- 6.52%
- Cash-on-cash
- 0.83%
- DSCR
- 1.04
- GRM
- 10.4
CMA / ARV
- ARV (on-the-fly)
- $403,407
- Comps found
- 12
Show comp detail 12 sales within ~0.75 mi
| Address | Dist | Beds/Ba | Sqft | Sold | Price | $/sf | Match |
|---|---|---|---|---|---|---|---|
| 4703 Ranger Ln | 0.12mi | 3/3.0 | 1,732 (-4%) | 2mo | $181,500 | $105 | 80 |
| 5085 Oop Rd #34 | 0.69mi | 3/2.5 | 1,880 (+4%) | 3mo | $415,000 | $221 | 55 |
| 5012 Oop Rd | 0.69mi | 3/2.5 | 1,750 (-3%) | 6mo | $429,500 | $245 | 54 |
| 4573 Tricia Dr | 0.70mi | 3/2.5 | 1,860 (+3%) | 8mo | $290,000 | $156 | 52 |
| 5059 Oop Rd | 0.70mi | 3/2.0 | 1,740 (-4%) | 13mo | $428,000 | $246 | 48 |
| 5110 Oop Rd | 0.69mi | 3/2.5 | 1,900 (+5%) | 9mo | $429,500 | $226 | 48 |
| 6426 Rosemary Dr | 0.25mi | 3/2.5 | 1,545 (-15%) | 15mo | $345,000 | $223 | 47 |
| 4569 Tricia Dr | 0.69mi | 4/3.0 (+1) | 1,920 (+6%) | 3mo | $324,000 | $169 | 44 |
| 5031 Oop Rd | 0.72mi | 3/2.0 | 1,700 (-6%) | 13mo | $419,000 | $246 | 43 |
| 7648 Mallette Rd | 0.71mi | 4/3.0 (+1) | 1,861 (+3%) | 11mo | $335,000 | $180 | 42 |
| 5047 Oop Rd | 0.71mi | 3/2.0 | 1,700 (-6%) | 19mo | $406,000 | $239 | 39 |
| 4524 Dumac Rd | 0.69mi | 3/2.0 | 1,600 (-12%) | 18mo | $335,000 | $209 | 32 |
Match score weights: distance 35% · size 25% · config 20% · recency 20%. Top-matched comps best support the ARV.
Projected returns pro-forma
-3.0% appreciation · 0.0% rent growth · sell at horizon
- IRR
- -18.1%
- Equity multiple
- 0.38×
- Total profit
- $-38,696
- Equity at exit
- $33,250
- IRR
- -16.6%
- Equity multiple
- 0.19×
- Total profit
- $-50,675
- Equity at exit
- $19,281
Cash invested: $62,440 (down + closing). Projections, not guarantees.
Landlord ↔ Tenant lean methodology
- Overall (STATE)
- 87 Strongly Landlord-Friendly
- State Tennessee
- 87 Strongly Landlord-Friendly · R+13
- County
- — inherits STATE
- City
- — inherits STATE
ZIP-level market 37416
- Home prices YoY
- -30.5%
- Rents YoY
- -0.2%
- Active inventory
- 99
- Price-to-rent
- 10.4×
Monthly cashflow live
- Estimated rent
- $1,782 medium interval (Pro) →
- Mortgage (P&I)
- −$1,169
- Tax from tax record
- −$102 /mo · $1,226/yr
- Insurance
- −$93
- HOA
- −$0
- Vacancy / Maint / Mgmt
- −$374
- Net cashflow
- $43
Break-even live
Sensitivity live
| Price | -10% $169 | -5% $106 | +0% $43 | +5% $-20 | +10% $-83 |
|---|---|---|---|---|---|
| Rent | -10% $-98 | -5% $-27 | +0% $43 | +5% $113 | +10% $184 |
| Rate | -1.0pp $155 | -0.5pp $100 | base $43 | +0.5pp $-15 | +1.0pp $-74 |
UW: 25.0% down · 7.5% · 30yr · 1.5% tax · 5.0% vac · 8.0% maint · 8.0% mgmt
Financing live
Cash to close
- Down payment
- $55,750
- Closing costs
- $6,690
- Reserves months
- —
- Total cash needed
- —
Loan-product check · same deal, 3 products live
Conventional
25% down · 7.5% · 30yr
- Down + closing
- —
- Monthly P&I
- —
- Monthly cashflow
- —
- DSCR
- —
- Eligible?
- —
Personal DTI + credit; lowest rate.
DSCR
20% down · 8.5% · 30yr
- Down + closing
- —
- Monthly P&I
- —
- Monthly cashflow
- —
- DSCR
- —
- Eligible?
- —
No personal income docs; deal must DSCR.
Hard money
10% down · 12.0% · 12mo
- Down + closing
- —
- Monthly P&I
- —
- Monthly cashflow
- —
- DSCR
- —
- Eligible?
- —
Short-term bridge; refi at stabilization.
Rent comps 4 comps
| Address | Beds | Baths | Sqft | Rent | $/sqft | DOM | Units | Dist |
|---|---|---|---|---|---|---|---|---|
| 4089 Arbor Place Ln Chattanooga, TN | 2.0 | 1.5 | 2040 | $1,375 | $0.67 | 24d | 1 | 1.26mi |
| 4025 Oakwood Dr Chattanooga, TN | 1.0–3.0 | 1.0–2.0 | 997 | $1,685 | $1.69 | 15d | 14 | 1.34mi |
| 5270 Rotary Dr Chattanooga, TN | 2.0 | 1.0 | 1571 | $1,425 | $0.91 | 24d | 1 | 1.40mi |
| 6168 Foxboro DR Chattanooga, TN | 1.0–3.0 | 1.0–2.0 | 1093 | $2,496 | $2.28 | 15d | 37 | 1.47mi |
Listing history 26 events
-
2026-06-18days on market $223,000 Active 56 DOM
-
2026-06-17days on market $223,000 Active 55 DOM
-
2026-06-16days on market $223,000 Active 54 DOM
-
2026-06-15days on market $223,000 Active 53 DOM
-
2026-06-14days on market $223,000 Active 51 DOM
-
2026-06-10days on market $223,000 Active 48 DOM
-
2026-06-09days on market $223,000 Active 47 DOM
-
2026-06-08days on market $223,000 Active 46 DOM
-
2026-06-07days on market $223,000 Active 45 DOM
-
2026-06-05days on market $223,000 Active 42 DOM
-
2026-06-03days on market $223,000 Active 41 DOM
-
2026-06-02days on market $223,000 Active 40 DOM
-
2026-06-01days on market $223,000 Active 39 DOM
-
2026-05-31days on market $223,000 Active 38 DOM
-
2026-05-30days on market $223,000 Active 37 DOM
-
2026-04-23$223,000 Active
Show marketing remark (262 chars)
Great Investment Opportunity !! ALL brick , one level rancher is the one . For the investor or homeowner plenty of potential equity for a flip or buy and hold. The location is minutes from the mall, Volkswagen, Amazon and the lakes. Make this house your home !!
-
2026-04-23$223,000 Active 262-char remark
Show marketing remark (262 chars)
Great Investment Opportunity !! ALL brick , one level rancher is the one . For the investor or homeowner plenty of potential equity for a flip or buy and hold. The location is minutes from the mall, Volkswagen, Amazon and the lakes. Make this house your home !!
-
2026-04-01historical 261-char remark
Show marketing remark (261 chars)
Great Investment Opportunity !! ALL brick , one level rancher is the one . For the investor or homeowner plenty of potential equity for a flip or buy and hold. The location is minutes from the mall, Volkswagen, Amazon and the lakes. Make this house your home !!
-
2025-08-15status Active 261-char remark
Show marketing remark (261 chars)
Great Investment Opportunity !! ALL brick , one level rancher is the one . For the investor or homeowner plenty of potential equity for a flip or buy and hold. The location is minutes from the mall, Volkswagen, Amazon and the lakes. Make this house your home !!
-
2025-08-11historical 261-char remark
Show marketing remark (261 chars)
Great Investment Opportunity !! ALL brick , one level rancher is the one . For the investor or homeowner plenty of potential equity for a flip or buy and hold. The location is minutes from the mall, Volkswagen, Amazon and the lakes. Make this house your home !!
-
2024-12-16price $225,000
Show marketing remark (261 chars)
Great Investment Opportunity !! ALL brick , one level rancher is the one . For the investor or homeowner plenty of potential equity for a flip or buy and hold. The location is minutes from the mall, Volkswagen, Amazon and the lakes. Make this house your home !!
-
2024-12-16price $225,000 261-char remark
Show marketing remark (261 chars)
Great Investment Opportunity !! ALL brick , one level rancher is the one . For the investor or homeowner plenty of potential equity for a flip or buy and hold. The location is minutes from the mall, Volkswagen, Amazon and the lakes. Make this house your home !!
-
2024-11-20price $230,000
Show marketing remark (261 chars)
Great Investment Opportunity !! ALL brick , one level rancher is the one . For the investor or homeowner plenty of potential equity for a flip or buy and hold. The location is minutes from the mall, Volkswagen, Amazon and the lakes. Make this house your home !!
-
2024-11-20price $230,000 261-char remark
Show marketing remark (261 chars)
Great Investment Opportunity !! ALL brick , one level rancher is the one . For the investor or homeowner plenty of potential equity for a flip or buy and hold. The location is minutes from the mall, Volkswagen, Amazon and the lakes. Make this house your home !!
-
2024-09-29$240,000 Active 261-char remark
Show marketing remark (261 chars)
Great Investment Opportunity !! ALL brick , one level rancher is the one . For the investor or homeowner plenty of potential equity for a flip or buy and hold. The location is minutes from the mall, Volkswagen, Amazon and the lakes. Make this house your home !!
-
2024-08-26price $240,000
ⓘ Source: listings_history table (triggers on properties + properties_extension) + one-shot
backfill from property_details.listing_events for pre-trigger history.
Tax reassessment forecast TN · Resets to sale price
- Current annual tax
- $1,226 · $102/mo
- Projected year-2 tax
- $1,583 · $132/mo
- Expected delta
- +$357/yr (+$30/mo · 29.1%)
ⓘ Screening estimate from a state-policy table — verify with the county assessor before closing.
Climate risk First Street
- Flood 1/10 Low FEMA zone X (unshaded) · 0% chance over 30 yrs
- Wildfire 3/10 Moderate
- Heat 6/10 Major 7 d/yr ≥104°F today · 19 d/yr by 30 yrs out
- Wind 4/10 Moderate 10% chance of damaging wind over 30 yrs
- Air quality 3/10 Moderate 2 unhealthy d/yr today · 2 by 30 yrs out
Nearby sold comps map
Loading sold comps map…
Walkable amenities ~0.75 mi
Loading nearby amenities…
Taxation est. · year 1
- Rental income
- $21,381
- − Mortgage interest
- −$12,491
- − Property taxes
- −$1,226
- − Insurance
- −$1,115
- − Repairs & maintenance
- −$1,711
- − Management
- −$1,711
- − Depreciation
- −$6,487
- Taxable loss
- −$3,360
- Est. tax savings @ 24.0%
- +$806
- After-tax cash flow
- $1,323/yr
For passive investors: Depreciation is non-cash, so a rental often shows a tax loss while cash-flowing — sheltering income. Rental losses are passive: they offset passive income freely, and up to $25,000/yr can offset ordinary (W-2) income if you actively participate and your MAGI is under $100k (phasing out to $0 by $150k); unused losses carry forward. On sale, claimed depreciation is recaptured at up to 25%, and gains may owe capital-gains tax (a 1031 exchange can defer both). Figures are a year-1 estimate at your 24.0% rate — not tax advice; consult a CPA.
Schools (NCES district)
- District
- Hamilton County
- NCES district ID
- 4701590
- Math proficiency
- 31% ▼ -10.00%
- Reading proficiency
- 31% ▼ -3.00%
- Median HH income
- $47,456
- Composite
- 26.8/100
- National rank
- #7122
- State rank
- #42 of 139 in TN
Livability — Chattanooga
- Score
- 78/100
- State rank
- #3
- US rank
- #2582
Category grades
Schools grade is shown separately in the Schools card above.
Census & demographics
- Census place
- Chattanooga, TN
- County
- Hamilton County · 312,777 people
- City population
- 131,999
- Metro
- Chattanooga, TN-GA
- Population (ZIP)
- 13,919
- Household income
- $70,705
- Rent vs Own
- Severe rent burden
- 480.0
Population outlook (Hamilton County) Hauer SSP2
- Today (2025)
- 393,784 people
- By 2030
- 412,983 · +4.9%
- By 2040
- 449,502 · +14.1%
- By 2050
- 484,341 · +23.0%
- By 2075
- 565,746 · +43.7%
- By 2100
- 618,394 · +57.0%
Race, ethnicity, and origin ACS 2023
- Neighborhood character
- Diverse neighborhood (Simpson 0.59)
- Race & ethnicity
- White 47% Black 43% Two or more races 5% Hispanic / Latino 4% Asian 1%
- Common ancestry
- Hispanic 4% Italian 3% Slovak 1%
- Foreign-born
- 8% · Canada, South Korea
- Languages at home
- 89% English-only · Spanish 5% French/Haitian/Cajun 5% Other Indo-European 1%
Political lean MEDSL · Hamilton
- 2024 margin
- R (+13.1) · D 42.7% · R 55.7% · Other 1.6%
- 2008→2024 swing
- -1.2pp toward R · 2008: -11.8pp · 2024: -13.1pp
- All cycles
- 2024: R+13.1 2020: R+9.7 2016: R+16.6 2012: R+14.8 2008: R+11.8
Not yet ingested
- Civics
- —
Market trends
- HPI YoY
- ▼ -112.99%
- Current HPI
- 257.5129
- Rent YoY
- ▼ -0.22%
- Metro
- Chattanooga, TN-GA
- State GDP YoY
- ▲ 2.78%
- F500 in state
- 22
Industry mix (Fortune 500 HQ in TN)
| Industry | F500 HQs | Revenue |
|---|---|---|
| Healthcare | 3 | $91B |
|
||
| Retail | 3 | $72B |
|
||
| Transportation / Logistics | 1 | $88B |
|
||
| Paper / Packaging | 1 | $19B |
|
||
| Insurance | 1 | $13B |
|
||
| Energy | 1 | $12B |
|
||
Price history
-7.1% since first listed11 events — show timeline
- 2026-04-23 Listed $223,000 REALTRACS as Distributed by MLS Grid
- 2026-04-23 Listed $223,000 GCAR
- 2026-04-01 Listing Removed — REALTRACS as Distributed by MLS Grid
- 2025-08-15 Relisted — REALTRACS as Distributed by MLS Grid
- 2025-08-11 Listing Removed — REALTRACS as Distributed by MLS Grid
- 2024-12-16 Price Changed $225,000 GCAR
- 2024-12-16 Price Changed $225,000 REALTRACS as Distributed by MLS Grid
- 2024-11-20 Price Changed $230,000 GCAR
- 2024-11-20 Price Changed $230,000 REALTRACS as Distributed by MLS Grid
- 2024-09-29 Listed $240,000 REALTRACS as Distributed by MLS Grid
- 2024-08-26 Price Changed $240,000 GCAR
Property tax history
+4.4%/yrLatest (2025): $1,226 · +6.9% YoY. Source: county tax records.
Cash-flow waterfall
monthlySold comps — $/sqft
last 12 mo · ≤1 miLoading sold comps…