 Multi-family
144 Willow St #1 · Humble, TX
Flood risk No data
- FEMA flood zone
- —
- Chance of flooding over 30 yrs
- —
- Est. flood insurance / yr
- —
Fire risk No data
- Est. fire insurance / yr
- —
Heat risk No data
- Hot days now (above threshold)
- —
- Hot days in 30 yrs
- —
Wind risk No data
- Chance of severe wind over 30 yrs
- —
Air-quality risk No data
- Unhealthy air days now
- —
- Unhealthy air days in 30 yrs
- —
Risk factors via First Street. Map © Google.
Why this score? — see what drove the D grade
The composite is a weighted blend of 9 inputs, each scored 0–100. Each bar is that input's sub-score; the figure is the points it added to the 100-point composite (weight × sub-score).
- ARV discount +14.4/15.0
- Cash flow +7.0/30.0
- Appreciation +4.6/10.0
- Schools +3.9/10.0
- Livability +3.1/5.0
- Rent growth +3.0/5.0
- Condition / age +2.5/5.0
- 1% rule +2.3/10.0
- DSCR +1.2/10.0
$225,000
🖨 Deal sheet (PDF) 📄 Offer letter ✓ Due diligence
Multi-family units
County records classify this as Multi-Family (2-4 Unit). Listing-text estimate: 1 unit. estimate disagrees with records
Listing remarks MLS
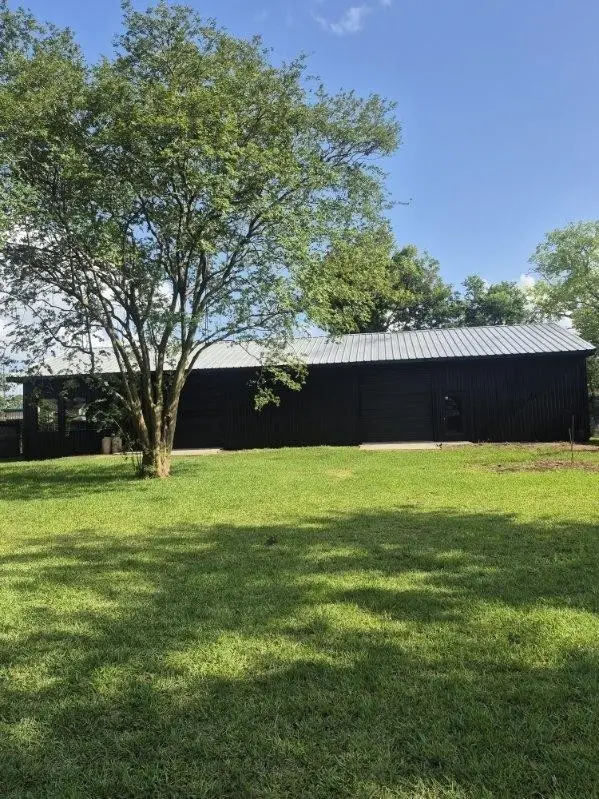
RESIDENTIAL STORAGE WAREHOUSE. ONE ROOM READY FOR BUILD OUT. APROX 30' X 19'. LOT APROX 100' X 124'.
Key facts
- 0.26 acre lot
- Built 1990
- Listed 246 days
Neighborhood map
What this means for you Summary
Snapshot
- This is a multifamily listed at $225k.
Deal economics
- At list price, monthly cash flow is $-331 ($-4k/yr) — negative.
- To cash-flow at today's rent, offer at most $167k (26.0% below list).
- To meet the 1% rule (rent ≥ 1% of price), the offer needs to be $164k (26.9% below list).
- Recommended offer: $164k (26.9% below list) — sets the bar for 1% rule.
Location & tenants
- Location reads 62/100 on livability (#961 in TX) — a middle-class / working-renter tenant base. Strengths: cost of living A+, housing A+; Watch: employment D+, crime F, amenities F.
- Humble ISD (urban): math 38% / reading 44% proficiency, ranked #262 of 826 in TX (top 32%) — families likely to look elsewhere, expect single-tenant / working-renter base with shorter leases.
- Zoned schools: Lakeland El (math 18% / reading 19%, grade F, #3,759 of 4,322 statewide, top 88%, 868 students, 90% FRL); Ross Sterling Middle (math 30% / reading 27%, grade F, #1,122 of 1,662 statewide, top 69%, 919 students, 85% FRL); Humble H S (math 15% / reading 31%, grade F, #1,348 of 1,632 statewide, top 83%, 2,867 students, 77% FRL) — zoned schools average 84% FRL vs 32% district-wide (52 pts higher); higher-poverty schools than district average — tighter screening recommended.
- Zoned-school proficiency averages 23% at this address vs 41% district-wide (-18 pts) — the specific schools serving this property underperform the Humble ISD average; the district grade overstates school quality for this exact location.
- Market conditions: Rents rising (+2.2%/yr); 312 active listings in the ZIP; 29,883 units permitted in Harris County in 2024 (8,621 in 5+ unit buildings).
- This rent runs 30% of the median local income ($65k/yr) — at the standard rent-burdened threshold; future hikes will face affordability resistance.
Forward outlook
- Local home prices are declining (-0.8%/yr); year-one equity from $2k of loan paydown is wiped out by about $2k of value loss. Plan a longer hold.
- Harris County population projected at +47% by 2050 — long-run rental-demand tailwind backs the buy-and-hold thesis.
Negotiation context
- It's been on market 246 days — a 12% lower offer ($198k) is reasonable based on typical stale-listing flexibility.
Questions for the listing agent
- What do current leases actually rent for vs. the listed asking? Can we see a recent rent roll and the last 12 months of T-12 income?
- It's been on market 246 days. Have you received any prior offers? Is the seller open to a 27% concession, seller financing, or rate buy-down credit?
- Why hasn't it sold? Are there any deal-killer items the seller is aware of (foundation, flood, title, zoning, code violations)?
- Is there a deadline driving the sale (1031 exchange, divorce, estate, relocation)? That informs how much negotiation room exists.
- Schools are D-rated, which usually means shorter tenancies and higher turnover. Who's the typical renter profile here, and what's been the actual vacancy rate?
- Crime grade is F in this area — have there been break-ins, vandalism, or insurance claims at this property in the last 3 years? What carrier currently insures it and at what premium?
- The area grade is low — what's the realistic commute time and amenity access for the typical tenant pool here? Any planned neighborhood developments (good or bad) we should know about?
- What's the average days-on-market for RENTAL listings here right now (not sales)? A rising rental-DOM trend means longer vacancies and softer asking-rent achievability than the comps imply.
- What's the recent tenant-quality profile in this submarket — average credit score on applications, eviction rate, late-payment / NSF rate, and stable-employment percentage? A property-management company in the area should have these aggregated.
- How much new apartment / multifamily construction is in the pipeline within 1–3 miles? Heavy new supply (>2% of stock underway) typically softens rents 12–24 months out; light construction supports rent growth.
Investment metrics
- 1% rule
- 0.73% ✗
- Cap rate
- 4.53%
- Cash-on-cash
- -6.30%
- DSCR
- 0.72
- GRM
- 11.4
CMA / ARV
- ARV (median comp)
- $265,562
- List price
- $225,000
- Delta
- -15.27%
- Verdict
- UNDERPRICED
- Comps
- 20 within 1.0 mi
Show comp detail 3 sales within ~0.75 mi
| Address | Dist | Beds/Ba | Sqft | Sold | Price | $/sf | Match |
|---|---|---|---|---|---|---|---|
| 416 S Avenue D Unit B | 0.44mi | 4/2.0 | 2,654 (+11%) | 10mo | $189,000 | $71 | 54 |
| 1404 Mcdugald Rd | 0.49mi | 3/2.0 | 2,138 (-11%) | 12mo | $297,000 | $139 | 49 |
| 1402 Mcdugald Rd | 0.48mi | 6/2.0 | 2,138 (-11%) | 12mo | $297,000 | $139 | 49 |
Match score weights: distance 35% · size 25% · config 20% · recency 20%. Top-matched comps best support the ARV.
Projected returns pro-forma
-0.77% appreciation · 2.17% rent growth · sell at horizon
- IRR
- -13.5%
- Equity multiple
- 0.41×
- Total profit
- $-37,014
- Equity at exit
- $56,754
- IRR
- -7.6%
- Equity multiple
- 0.30×
- Total profit
- $-43,859
- Equity at exit
- $61,702
Cash invested: $63,000 (down + closing). Projections, not guarantees.
Landlord ↔ Tenant lean methodology
- Overall (STATE)
- 87 Strongly Landlord-Friendly
- State Texas
- 87 Strongly Landlord-Friendly · R+5
- County
- — inherits STATE
- City
- — inherits STATE
ZIP-level market 77338
- Home prices YoY
- -0.3%
- Rents YoY
- 2.2%
- Active inventory
- 312
- Price-to-rent
- 11.4×
Monthly cashflow live
- Estimated rent
- $1,644 medium interval (Pro) →
- Mortgage (P&I)
- −$1,180
- Tax from tax record
- −$356 /mo · $4,271/yr
- Insurance
- −$94
- HOA
- −$0
- Vacancy / Maint / Mgmt
- −$345
- Net cashflow
- $-331
Break-even live
Sensitivity live
| Price | -10% $-204 | -5% $-267 | +0% $-331 | +5% $-395 | +10% $-458 |
|---|---|---|---|---|---|
| Rent | -10% $-461 | -5% $-396 | +0% $-331 | +5% $-266 | +10% $-201 |
| Rate | -1.0pp $-218 | -0.5pp $-274 | base $-331 | +0.5pp $-389 | +1.0pp $-449 |
UW: 25.0% down · 7.5% · 30yr · 1.5% tax · 5.0% vac · 8.0% maint · 8.0% mgmt
Financing live
Cash to close
- Down payment
- $56,250
- Closing costs
- $6,750
- Reserves months
- —
- Total cash needed
- —
Loan-product check · same deal, 3 products live
Conventional
25% down · 7.5% · 30yr
- Down + closing
- —
- Monthly P&I
- —
- Monthly cashflow
- —
- DSCR
- —
- Eligible?
- —
Personal DTI + credit; lowest rate.
DSCR
20% down · 8.5% · 30yr
- Down + closing
- —
- Monthly P&I
- —
- Monthly cashflow
- —
- DSCR
- —
- Eligible?
- —
No personal income docs; deal must DSCR.
Hard money
10% down · 12.0% · 12mo
- Down + closing
- —
- Monthly P&I
- —
- Monthly cashflow
- —
- DSCR
- —
- Eligible?
- —
Short-term bridge; refi at stabilization.
Listing history 20 events
-
2026-06-21days on market $225,000 Active 246 DOM
-
2026-06-18days on market $225,000 Active 243 DOM
-
2026-06-17days on market $225,000 Active 242 DOM
-
2026-06-16days on market $225,000 Active 241 DOM
-
2026-06-15days on market $225,000 Active 240 DOM
-
2026-06-13days on market $225,000 Active 238 DOM
-
2026-06-13days on market $225,000 Active 237 DOM
-
2026-06-09days on market $225,000 Active 234 DOM
-
2026-06-08days on market $225,000 Active 233 DOM
-
2026-06-07days on market $225,000 Active 232 DOM
-
2026-06-04days on market $225,000 Active 229 DOM
-
2026-06-03days on market $225,000 Active 228 DOM
-
2026-06-02days on market $225,000 Active 227 DOM
-
2026-06-01days on market $225,000 Active 226 DOM
-
2026-05-31days on market $225,000 Active 225 DOM
-
2026-04-29price $225,000 103-char remark
Show marketing remark (103 chars)
RESIDENTIAL STORAGE WAREHOUSE. ONE ROOM READY FOR BUILD OUT. APROX 30' X 19'. LOT APROX 100' X 124'.
-
2025-12-11price $250,000 103-char remark
Show marketing remark (103 chars)
RESIDENTIAL STORAGE WAREHOUSE. ONE ROOM READY FOR BUILD OUT. APROX 30' X 19'. LOT APROX 100' X 124'.
-
2025-10-18$275,000 Active 103-char remark
Show marketing remark (103 chars)
RESIDENTIAL STORAGE WAREHOUSE. ONE ROOM READY FOR BUILD OUT. APROX 30' X 19'. LOT APROX 100' X 124'.
-
2025-05-15soldstatus
-
1993-01-02soldstatus
ⓘ Source: listings_history table (triggers on properties + properties_extension) + one-shot
backfill from property_details.listing_events for pre-trigger history.
Tax reassessment forecast TX · Resets to sale price
- Current annual tax
- $4,271 · $356/mo
- Projected year-2 tax
- $4,271 · $356/mo
- Expected delta
- $0/yr ($0/mo · 0.0%)
ⓘ Screening estimate from a state-policy table — verify with the county assessor before closing.
Nearby sold comps map
Loading sold comps map…
Walkable amenities ~0.75 mi
Loading nearby amenities…
Taxation est. · year 1
- Rental income
- $19,726
- − Mortgage interest
- −$12,603
- − Property taxes
- −$4,271
- − Insurance
- −$1,125
- − Repairs & maintenance
- −$1,578
- − Management
- −$1,578
- − Depreciation
- −$6,545
- Taxable loss
- −$7,975
- Est. tax savings @ 24.0%
- +$1,914
- After-tax cash flow
- $-2,057/yr
For passive investors: Depreciation is non-cash, so a rental often shows a tax loss while cash-flowing — sheltering income. Rental losses are passive: they offset passive income freely, and up to $25,000/yr can offset ordinary (W-2) income if you actively participate and your MAGI is under $100k (phasing out to $0 by $150k); unused losses carry forward. On sale, claimed depreciation is recaptured at up to 25%, and gains may owe capital-gains tax (a 1031 exchange can defer both). Figures are a year-1 estimate at your 24.0% rate — not tax advice; consult a CPA.
Schools (NCES district)
- District
- Humble ISD
- NCES district ID
- 4823910
- Math proficiency
- 38% ▼ -11.00%
- Reading proficiency
- 44% ▼ -7.00%
- Median HH income
- $83,946
- Composite
- 38.55/100
- National rank
- #4171
- State rank
- #262 of 826 in TX
Livability — Humble
- Score
- 62/100
- State rank
- #961
- US rank
- #17060
Category grades
Schools grade is shown separately in the Schools card above.
Census & demographics
- Census place
- Humble, TX
- County
- Harris County · 4,702,590 people
- City population
- 109,766
- Metro
- Houston-The Woodlands-Sugar Land, TX
- Population (ZIP)
- 48,031
- Household income
- $64,755
- Rent vs Own
- Severe rent burden
- 2620.0
Population outlook (Harris County) Hauer SSP2
- Today (2025)
- 5,571,493 people
- By 2030
- 6,089,821 · +9.3%
- By 2040
- 7,142,806 · +28.2%
- By 2050
- 8,185,864 · +46.9%
- By 2075
- 10,574,329 · +89.8%
- By 2100
- 12,109,958 · +117.4%
Race, ethnicity, and origin ACS 2023
- Neighborhood character
- Diverse neighborhood (Simpson 0.69)
- Race & ethnicity
- Hispanic / Latino 41% Black 34% Two or more races 18% White 16% Asian 3%
- Hispanic origin (detail)
- Mexican 29% Puerto Rican 1%
- Common ancestry
- Lithuanian 4% Armenian 1% Serbian 1%
- Foreign-born
- 17% · Canada, Jamaica
- Languages at home
- 60% English-only · Spanish 35% Arabic 1% Other Indo-European 1%
Political lean MEDSL · Harris
- 2024 margin
- Lean D (+5.5) · D 52.0% · R 46.4% · Other 1.6%
- 2008→2024 swing
- +3.9pp toward D · 2008: 1.6pp · 2024: 5.5pp
- All cycles
- 2024: D+5.5 2020: D+13.3 2016: D+12.4 2012: D+0.1 2008: D+1.6
Not yet ingested
- Civics
- —
Market trends
- HPI YoY
- ▼ -0.77%
- Current HPI
- 245.7087
- Rent YoY
- ▲ 2.17%
- Metro
- Houston-The Woodlands-Sugar Land, TX
- State GDP YoY
- ▲ 3.95%
- F500 in state
- 110
Industry mix (Fortune 500 HQ in TX)
| Industry | F500 HQs | Revenue |
|---|---|---|
| Energy | 16 | $1,198B |
|
||
| Technology | 5 | $198B |
|
||
| Engineering / Construction | 4 | $72B |
|
||
| Energy Services | 3 | $60B |
|
||
| Utilities | 3 | $41B |
|
||
| Healthcare | 2 | $330B |
|
||
Price history
-18.2% since first listed5 events — show timeline
- 2026-04-29 Price Changed $225,000 HARMLS
- 2025-12-11 Price Changed $250,000 HARMLS
- 2025-10-18 Listed $275,000 HARMLS
- 2025-05-15 Sold (Public Records) — Public Records
- 1993-01-02 Sold (Public Records) — Public Records
Property tax history
+12.9%/yrLatest (2025): $4,271 · +51.3% YoY. Source: county tax records.
Cash-flow waterfall
monthlySold comps — $/sqft
last 12 mo · ≤1 miLoading sold comps…