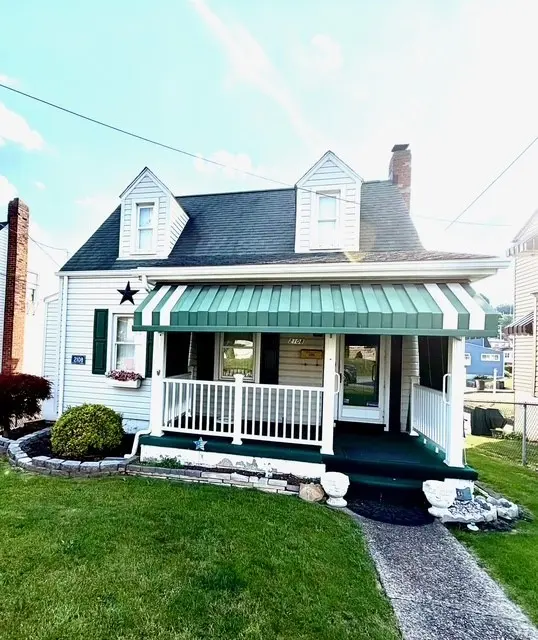
2108 Barnsdale Ave · McKeesport, PA
Flood risk 1/10 · Minimal
- FEMA flood zone
- X (unshaded)
- Chance of flooding over 30 yrs
- 0.0%
- Est. flood insurance / yr
- $473 – $860
Fire risk 1/10 · Minimal
- Est. fire insurance / yr
- $511 – $949
Heat risk 4/10 · Minor
- Hot days now (above 97°F)
- 7 days/yr
- Hot days in 30 yrs
- 18 days/yr
Wind risk 2/10 · Minimal
- Chance of severe wind over 30 yrs
- —
Air-quality risk 5/10 · Moderate
- Unhealthy air days now
- 9 days/yr
- Unhealthy air days in 30 yrs
- 11 days/yr
Risk factors via First Street. Map © Google.
Why this score? — see what drove the D+ grade
The composite is a weighted blend of 9 inputs, each scored 0–100. Each bar is that input's sub-score; the figure is the points it added to the 100-point composite (weight × sub-score).
- Cash flow +21.6/30.0
- DSCR +6.9/10.0
- 1% rule +5.3/10.0
- ARV discount +3.3/15.0
- Livability +3.3/5.0
- Rent growth +2.5/5.0
- Condition / age +2.5/5.0
- Schools +1.6/10.0
- Appreciation +0.0/10.0
$110,000
🖨 Deal sheet (PDF) 📄 Offer letter ✓ Due diligence
Listing remarks
Whether you're searching for your first home or looking for a property you can personalize and make your own, this charming 2-bedroom, 2-full-bath home is full of potential. The main level features a comfortable living room, dining room, kitchen, and a full bath, providing a functional layout for everyday living. Upstairs, you'll find two bedrooms and a second full bath. Enjoy your morning coffee or unwind in the evening on the inviting front porch, perfect for relaxing and spending time with family and friends. The integral one-car garage offers convenience and protection from the elements, while the backyard shed provides additional storage space for lawn equipment, bicycles, tools,
Key facts
- Front porch
- Near renzie park
- Backyard shed
Tags
Property features AI
Exterior
- Parking: Built-in attached garage (1 parking space)
- Utilities: Public water; Public sewer; Gas service
- Home design: Resale property
- Construction: Vinyl siding; Asphalt roof
- Exterior features: Small lot (approximately 0.09 acres)
Interior
- Kitchen: Kitchen with gas stove and refrigerator
- Bedrooms: Two bedrooms (both on the upper level)
- Flooring: Carpet; Vinyl flooring
- Bathrooms: Two full bathrooms
- Heating & cooling: Forced air heating (gas)
- Interior features: Unfinished walk-out basement
Neighborhood map
What this means for you Summary
Snapshot
- This is a 2-bed/2.0-bath single-family listed at $110k.
Deal economics
- At list price, monthly cash flow is $168 ($2k/yr) — positive.
- The deal already cash-flows at list — no discount required.
- Meets the 1% rule at list price ($1k rent vs $110k).
- Recommended offer: $108k (1.5% below list) — sets the bar for market timing.
- Cap rate 8.1% vs local median 10.2% in McKeesport — below-typical yield; the buyer is paying a premium for something (appreciation thesis, condition, location) that the cap rate doesn't capture.
Location & tenants
- Location reads 66/100 on livability (#1,089 in PA) — a middle-class / working-renter tenant base. Strengths: commute A+, cost of living A+, housing A+; Watch: health & safety D, crime F, amenities F.
- Mckeesport Area SD (suburban): math 11% / reading 28% proficiency, ranked #499 of 539 in PA (top 93%) — low school quality limits family demand, transient renter base, plan for 1-2y turnover; 66% free/reduced lunch — lower-income household profile, screen leases tightly.
- Zoned schools: Founders Hall Middle Sch (math 2% / reading 26%, grade F, #480 of 512 statewide, top 94%, 695 students, 100% FRL); Mckeesport Area Shs (math 22% / reading 30%, grade F, #372 of 437 statewide, top 86%, 1,045 students, 78% FRL) — zoned schools average 89% FRL vs 66% district-wide (23 pts higher); higher-poverty schools than district average — tighter screening recommended.
- Market conditions: 114 active listings in the ZIP; 11 comparable units currently listed for rent nearby; rentals at typical pace (median 26d on market — plan ~3-4 weeks tenant-placement turnaround); 45% of comp listings sitting > 30 days — soft ceiling on asking rent; lower-income renter base — watch delinquency; 2,996 units permitted in Allegheny County in 2024 (1,588 in 5+ unit buildings).
- This rent runs 38% of the median local income ($35k/yr) — at the standard rent-burdened threshold; future hikes will face affordability resistance.
Forward outlook
- Local home prices are declining (-3.0%/yr); year-one equity from $761 of loan paydown is wiped out by about $3k of value loss. Plan a longer hold.
Negotiation context
- It's been on market 15 days — a 2% lower offer ($108k) is reasonable based on typical stale-listing flexibility.
- Current owner paid $26k; list at $110k implies a 331% gain — meaningful room to come down on a strong offer.
Risks & watch-outs
- Watch-outs: built in 1940 — expect roof / HVAC / electrical / plumbing capex.
Questions for the listing agent
- Built in 1940 — when were the roof, HVAC, electrical panel, plumbing, and water heater last replaced?
- Is there a deadline driving the sale (1031 exchange, divorce, estate, relocation)? That informs how much negotiation room exists.
- Schools are D-rated, which usually means shorter tenancies and higher turnover. Who's the typical renter profile here, and what's been the actual vacancy rate?
- Crime grade is F in this area — have there been break-ins, vandalism, or insurance claims at this property in the last 3 years? What carrier currently insures it and at what premium?
- The area grade is low — what's the realistic commute time and amenity access for the typical tenant pool here? Any planned neighborhood developments (good or bad) we should know about?
- What's the average days-on-market for RENTAL listings here right now (not sales)? A rising rental-DOM trend means longer vacancies and softer asking-rent achievability than the comps imply.
- What's the recent tenant-quality profile in this submarket — average credit score on applications, eviction rate, late-payment / NSF rate, and stable-employment percentage? A property-management company in the area should have these aggregated.
- How much new for-sale + rental construction is in the pipeline within 1–3 miles? Heavy new supply typically softens prices + rents 12–24 months out; constrained supply supports both.
Investment metrics
- 1% rule
- 1.03% ✓
- Cap rate
- 8.12%
- Cash-on-cash
- 6.53%
- DSCR
- 1.29
- GRM
- 8.1
CMA / ARV
- ARV (on-the-fly)
- $100,548
- Comps found
- 12
Show comp detail 12 sales within ~0.75 mi
| Address | Dist | Beds/Ba | Sqft | Sold | Price | $/sf | Match |
|---|---|---|---|---|---|---|---|
| 2116 Barnsdale Ave | 0.01mi | 2/1.5 | 1,008 (-2%) | 4mo | $43,500 | $43 | 91 |
| 2101 Barnsdale Ave | 0.03mi | 2/2.0 | 928 (-10%) | 7mo | $45,500 | $49 | 77 |
| 1126 Monongahela Blvd | 0.52mi | 2/2.0 | 1,009 (-2%) | 2mo | $124,000 | $123 | 72 |
| 2112 Dalton | 0.10mi | 3/1.0 (+1) | 1,122 (+9%) | 3mo | $75,000 | $67 | 68 |
| 1707 Grandview Ave | 0.39mi | 2/1.0 | 1,120 (+9%) | 1mo | $110,000 | $98 | 62 |
| 717 King St | 0.57mi | 3/1.5 (+1) | 1,008 (-2%) | 4mo | $135,000 | $134 | 60 |
| 2619 Harrison St | 0.54mi | 2/1.0 | 955 (-7%) | 8mo | $69,900 | $73 | 53 |
| 1819 Craig St | 0.53mi | 3/1.5 (+1) | 1,080 (+5%) | 9mo | $139,900 | $130 | 52 |
| 2413 Banker St | 0.37mi | 3/2.0 (+1) | 1,134 (+10%) | 10mo | $137,000 | $121 | 52 |
| 2620 Kansas St | 0.62mi | 2/1.0 | 972 (-5%) | 8mo | $51,550 | $53 | 52 |
| 1211 Meadow St | 0.61mi | 3/1.0 (+1) | 992 (-3%) | 8mo | $56,915 | $57 | 50 |
| 2714 Kansas St | 0.68mi | 2/2.0 | 912 (-11%) | 11mo | $124,900 | $137 | 41 |
Match score weights: distance 35% · size 25% · config 20% · recency 20%. Top-matched comps best support the ARV.
Projected returns pro-forma
-3.0% appreciation · 3.0% rent growth · sell at horizon
- IRR
- -6.3%
- Equity multiple
- 0.77×
- Total profit
- $-7,154
- Equity at exit
- $16,401
- IRR
- 3.4%
- Equity multiple
- 1.24×
- Total profit
- $7,496
- Equity at exit
- $9,511
Cash invested: $30,800 (down + closing). Projections, not guarantees.
Landlord ↔ Tenant lean methodology
- Overall (STATE)
- 62 Landlord-Friendly
- State Pennsylvania
- 62 Landlord-Friendly · EVEN
- County
- — inherits STATE
- City
- — inherits STATE
ZIP-level market 15132
- Home prices YoY
- -32.9%
- Active inventory
- 114
- Price-to-rent
- 8.1×
Monthly cashflow live
- Estimated rent
- $1,128 high interval (Pro) →
- Mortgage (P&I)
- −$577
- Tax from tax record
- −$101 /mo · $1,207/yr
- Insurance
- −$46
- HOA
- −$0
- Vacancy / Maint / Mgmt
- −$237
- Net cashflow
- $168
Break-even live
Sensitivity live
| Price | -10% $230 | -5% $199 | +0% $168 | +5% $137 | +10% $105 |
|---|---|---|---|---|---|
| Rent | -10% $79 | -5% $123 | +0% $168 | +5% $212 | +10% $257 |
| Rate | -1.0pp $223 | -0.5pp $196 | base $168 | +0.5pp $139 | +1.0pp $110 |
UW: 25.0% down · 7.5% · 30yr · 1.5% tax · 5.0% vac · 8.0% maint · 8.0% mgmt
Financing live
Cash to close
- Down payment
- $27,500
- Closing costs
- $3,300
- Reserves months
- —
- Total cash needed
- —
Loan-product check · same deal, 3 products live
Conventional
25% down · 7.5% · 30yr
- Down + closing
- —
- Monthly P&I
- —
- Monthly cashflow
- —
- DSCR
- —
- Eligible?
- —
Personal DTI + credit; lowest rate.
DSCR
20% down · 8.5% · 30yr
- Down + closing
- —
- Monthly P&I
- —
- Monthly cashflow
- —
- DSCR
- —
- Eligible?
- —
No personal income docs; deal must DSCR.
Hard money
10% down · 12.0% · 12mo
- Down + closing
- —
- Monthly P&I
- —
- Monthly cashflow
- —
- DSCR
- —
- Eligible?
- —
Short-term bridge; refi at stabilization.
Rent comps 11 comps
| Address | Beds | Baths | Sqft | Rent | $/sqft | DOM | Units | Dist |
|---|---|---|---|---|---|---|---|---|
| 3710 Mayfair St McKeesport, PA | 3.0 | 1.5 | 1314 | $1,095 | $0.83 | 5d | 1 | 0.29mi |
| 3506 Mayfair St Unit B McKeesport, PA | 2.0 | 1.0 | 948 | $1,200 | $1.27 | 46d | 1 | 0.41mi |
| 1108 Prescott St White Oak, PA | 2.0 | 1.0 | 945 | $1,200 | $1.27 | 14d | 1 | 0.43mi |
| 1114-1116 Ohio St Unit 2R McKeesport, PA | 2.0 | 1.0 | 878 | $850 | $0.97 | 18d | 1 | 0.68mi |
| 1506 Freemont St McKeesport, PA | 3.0 | 2.0 | 1250 | $1,295 | $1.04 | 25d | 1 | 0.72mi |
| 1735 Ohio Ave Unit 6 White Oak, PA | 3.0 | 1.0 | 1034 | $1,200 | $1.16 | 46d | 1 | 0.85mi |
| 1217 Scott St McKeesport, PA | 3.0 | 1.0 | 1500 | $1,165 | $0.78 | 46d | 1 | 0.95mi |
| 152 Royal Oak Dr White Oak, PA | 1.0–2.0 | 1.0–2.0 | 930 | $1,445 | $1.55 | 0d | 9 | 0.96mi |
| 1827 California Ave Apt 2 Front Second Floor White Oak, PA | 1.0 | 1.0 | 750 | $900 | $1.20 | 16d | 1 | 0.99mi |
| 2918 Walnut St Apt 3 McKeesport, PA | 2.0 | 1.0 | 800 | $850 | $1.06 | 46d | 1 | 1.11mi |
| 311-313 24th St McKeesport, PA | 2.0 | 1.0 | 950 | $900 | $0.95 | 46d | 1 | 1.20mi |
Listing history 11 events
-
2026-06-21days on market $110,000 Active 15 DOM
-
2026-06-18days on market $110,000 Active 12 DOM
-
2026-06-17days on market $110,000 Active 11 DOM
-
2026-06-16days on market $110,000 Active 10 DOM
-
2026-06-15days on market $110,000 Active 9 DOM
-
2026-06-13days on market $110,000 Active 7 DOM
-
2026-06-13days on market $110,000 Active 6 DOM
-
2026-06-09days on market $110,000 Active 3 DOM
-
2026-06-08days on market $110,000 Active 2 DOM
-
2026-06-07remarks 699-char remark
-
2026-06-07$110,000 Active 1 DOM
ⓘ Source: listings_history table (triggers on properties + properties_extension) + one-shot
backfill from property_details.listing_events for pre-trigger history.
Tax reassessment forecast PA · Partial reset (capped growth)
- Current annual tax
- $1,207 · $101/mo
- Projected year-2 tax
- $1,472 · $123/mo
- Expected delta
- +$266/yr (+$22/mo · 22.0%)
ⓘ Screening estimate from a state-policy table — verify with the county assessor before closing.
Climate risk First Street
- Flood 1/10 Low FEMA zone X (unshaded) · 0% chance over 30 yrs
- Wildfire 1/10 Low
- Heat 4/10 Moderate 7 d/yr ≥97°F today · 18 d/yr by 30 yrs out
- Wind 2/10 Low
- Air quality 5/10 Major 9 unhealthy d/yr today · 11 by 30 yrs out
Nearby sold comps map
Loading sold comps map…
Walkable amenities ~0.75 mi
Loading nearby amenities…
Taxation est. · year 1
- Rental income
- $13,533
- − Mortgage interest
- −$6,162
- − Property taxes
- −$1,207
- − Insurance
- −$550
- − Repairs & maintenance
- −$1,083
- − Management
- −$1,083
- − Depreciation
- −$3,200
- Taxable income
- $249
- Est. tax owed @ 24.0%
- −$60
- After-tax cash flow
- $1,952/yr
For passive investors: Depreciation is non-cash, so a rental often shows a tax loss while cash-flowing — sheltering income. Rental losses are passive: they offset passive income freely, and up to $25,000/yr can offset ordinary (W-2) income if you actively participate and your MAGI is under $100k (phasing out to $0 by $150k); unused losses carry forward. On sale, claimed depreciation is recaptured at up to 25%, and gains may owe capital-gains tax (a 1031 exchange can defer both). Figures are a year-1 estimate at your 24.0% rate — not tax advice; consult a CPA.
Schools (NCES district)
- District
- Mckeesport Area SD
- NCES district ID
- 4214940
- Math proficiency
- 11% ▼ -9.00%
- Reading proficiency
- 28% ▼ -10.00%
- Median HH income
- $33,779
- Composite
- 15.88/100
- National rank
- #9257
- State rank
- #499 of 539 in PA
Livability — McKeesport
- Score
- 66/100
- State rank
- #1089
- US rank
- #12321
Category grades
Schools grade is shown separately in the Schools card above.
Census & demographics
- Census place
- McKeesport, PA
- County
- Allegheny County · 1,022,028 people
- City population
- 25,010
- Metro
- Pittsburgh, PA
- Population (ZIP)
- 18,898
- Household income
- $35,397
- Rent vs Own
- Severe rent burden
- 1239.0
Population outlook (Allegheny County) Hauer SSP2
- Today (2025)
- 1,250,282 people
- By 2030
- 1,256,482 · +0.5%
- By 2040
- 1,256,318 · +0.5%
- By 2050
- 1,244,169 · -0.5%
- By 2075
- 1,197,693 · -4.2%
- By 2100
- 1,093,187 · -12.6%
Race, ethnicity, and origin ACS 2023
- Neighborhood character
- Diverse neighborhood (Simpson 0.62)
- Race & ethnicity
- White 50% Black 35% Two or more races 10% Hispanic / Latino 4% Asian 1%
- Common ancestry
- Romanian 5% Serbian 2% Scotch-Irish 2%
- Foreign-born
- 2% · Canada, China
- Languages at home
- 96% English-only · Spanish 3%
Political lean MEDSL · Allegheny
- 2024 margin
- Strong D (+20.3) · D 59.7% · R 39.4%
- 2008→2024 swing
- +4.8pp toward D · 2008: 15.5pp · 2024: 20.3pp
- All cycles
- 2024: D+20.3 2020: D+20.4 2016: D+16.4 2012: D+14.4 2008: D+15.5
Not yet ingested
- Civics
- —
Market trends
- HPI YoY
- ▼ -71.01%
- Current HPI
- 145.195
- Rent YoY
- —
- Metro
- Pittsburgh, PA
- State GDP YoY
- ▲ 1.68%
- F500 in state
- 34
Industry mix (Fortune 500 HQ in PA)
| Industry | F500 HQs | Revenue |
|---|---|---|
| Healthcare | 2 | $309B |
|
||
| Insurance | 2 | $27B |
|
||
| Telecommunications / Media | 1 | $124B |
|
||
| Industrial Distribution | 1 | $22B |
|
||
| Financial Services | 1 | $20B |
|
||
| Chemicals / Materials | 1 | $18B |
|
||
Price history
+331.4% since first listed2 events — show timeline
- 2026-06-05 Listed $110,000 West Penn MLS
- 1986-10-27 Sold (Public Records) $25,500 Public Records
Property tax history
+5.1%/yrLatest (2026): $1,207 · +0.0% YoY. Source: county tax records.
Cash-flow waterfall
monthlySold comps — $/sqft
last 12 mo · ≤1 miLoading sold comps…