8410 SE 70th Ave · Newberry, FL
Flood risk 1/10 · Minimal
- FEMA flood zone
- X (unshaded)
- Chance of flooding over 30 yrs
- 0.0%
- Est. flood insurance / yr
- $507 – $1,088
Fire risk 4/10 · Minor
- Est. fire insurance / yr
- $947 – $1,759
Heat risk 8/10 · Major
- Hot days now (above 107°F)
- 5 days/yr
- Hot days in 30 yrs
- 16 days/yr
Wind risk 9/10 · Severe
- Chance of severe wind over 30 yrs
- 99.0%
Air-quality risk 2/10 · Minimal
- Unhealthy air days now
- 2 days/yr
- Unhealthy air days in 30 yrs
- 2 days/yr
Risk factors via First Street. Map © Google.
Why this score? — see what drove the C grade
The composite is a weighted blend of 9 inputs, each scored 0–100. Each bar is that input's sub-score; the figure is the points it added to the 100-point composite (weight × sub-score).
- Cash flow +21.0/30.0
- Appreciation +10.0/10.0
- DSCR +6.7/10.0
- Schools +5.3/10.0
- 1% rule +5.0/10.0
- Livability +3.4/5.0
- Rent growth +2.5/5.0
- Condition / age +2.5/5.0
- ARV discount +0.0/15.0
$179,900
🖨 Deal sheet 📄 Offer letter ✓ Due diligence
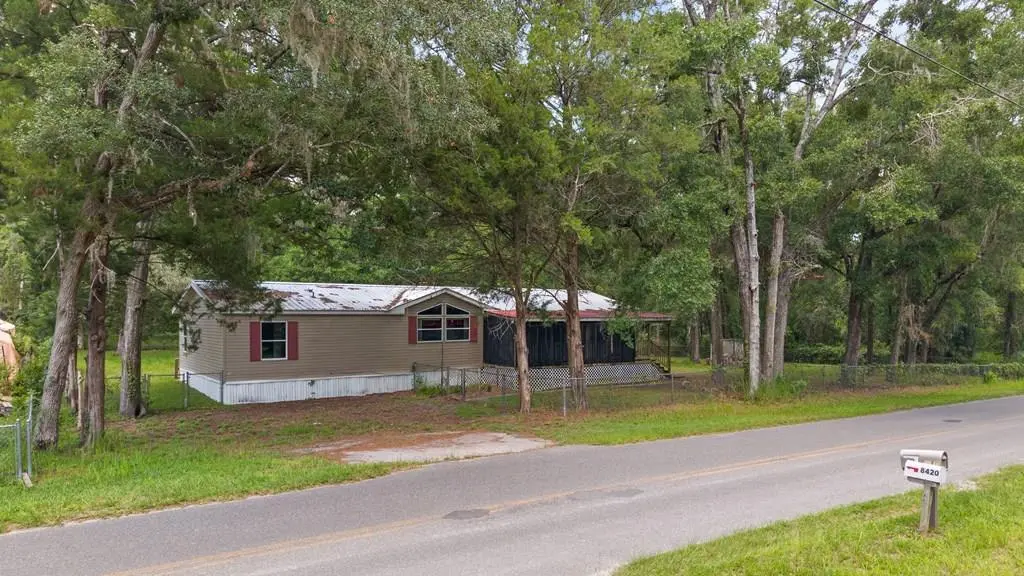
Listing remarks
Welcome to this 3-bedroom, 2-bath mobile home situated on a fully fenced, nearly -acre lot with both front and rear access—perfect for added convenience and flexibility. Ideally located just a short drive from Gainesville, you'll enjoy the best of country living while staying close to shopping, dining, and everyday amenities. Step inside to an open, inviting layout with plenty of space to make your own. Outside, the generous yard offers room for pets, gardening, or entertaining, along with a storage shed for tools and outdoor equipment. Whether you're searching for a starter home, investment opportunity, or a peaceful place to call your own, this property checks all the boxes. Schedul
Key facts
- 0.42 acre lot
- Built 1993
- Listed 44 days
Property features AI
Exterior
- Utilities: Private well water
- Home design: Residential mobile home; Located in Wacasassa Oaks
- Construction: Vinyl siding; Metal roof
- Exterior features: Covered porch/patio; Level, wooded lot
Interior
- Kitchen: Dishwasher; Refrigerator
- Flooring: Carpet; Laminate; Wood
- Bathrooms: 2 full bathrooms
- Interior features: Eat-in kitchen; Walk-in closets; 8 total rooms
Neighborhood map
What this means for you Summary
Snapshot
- This is a 3-bed/2.0-bath manufactured listed at $180k.
Deal economics
- At list price, monthly cash flow is $254 ($3k/yr) — positive.
- The deal already cash-flows at list — no discount required.
- To meet the 1% rule (rent ≥ 1% of price), the offer needs to be $180k (0.1% below list).
- Recommended offer: $175k (3.0% below list) — sets the bar for market timing.
- Cap rate 8.0% vs local median 4.2% in Newberry — top-decile yield for the area; either an underpriced asset or a hidden risk that comps aren't pricing in. Stress-test before assuming the spread holds.
Location & tenants
- Location reads 68/100 on livability (#524 in FL) — a middle-class / working-renter tenant base. Strengths: cost of living A+, housing A+, crime A-; Watch: health & safety D, amenities F, commute F.
- Gilchrist (rural): math 66% / reading 61% proficiency, ranked #9 of 73 in FL (top 12%) — acceptable for families but not a draw, mixed tenant base, ~2y average lease.
- Market conditions: 199 active listings in the ZIP; 94 units permitted in Gilchrist County in 2024 (0 in 5+ unit buildings).
Forward outlook
- In year one you build about $19k of equity ($1k loan paydown + $18k appreciation (10.0% local appreciation)).
- Gilchrist County population projected to shrink 6% by 2050 — rents likely to lag national; underwrite the cash flow, not the appreciation.
- At projected returns (10.0% appreciation + 3.0% rent growth), your $50k cash investment doubles in ~3 years — after that, you're playing with house money.
- By year 2, paydown + projected appreciation supports a ~$31k cash-out refi (75% LTV) — recoverable capital for the next deal without selling this one.
Negotiation context
- It's been on market 44 days — a 3% lower offer ($175k) is reasonable based on typical stale-listing flexibility.
- 4 sale attempts since 16y ago with the ask held roughly flat each time — persistent listings suggest the price (not the market) is what's stuck; bring a comps-based counter.
- Current owner paid $57k; list at $180k implies a 218% gain — meaningful room to come down on a strong offer.
Risks & watch-outs
- Climate carrying-cost: severe wind risk, 99% chance of damaging wind over 30y; extreme-heat days projected 5→16/yr by 2055 (HVAC capex compounding) — expect insurance premiums to compound above CPI over the hold.
Questions for the listing agent
- It's been on market 44 days. Have you received any prior offers? Is the seller open to a 3% concession, seller financing, or rate buy-down credit?
- Is there a deadline driving the sale (1031 exchange, divorce, estate, relocation)? That informs how much negotiation room exists.
- Schools are B-rated — typically a magnet for longer-tenancy family renters. What's the average tenant stay here, and is there a school-zone premium baked into asking?
- What's the average days-on-market for RENTAL listings here right now (not sales)? A rising rental-DOM trend means longer vacancies and softer asking-rent achievability than the comps imply.
- What's the recent tenant-quality profile in this submarket — average credit score on applications, eviction rate, late-payment / NSF rate, and stable-employment percentage? A property-management company in the area should have these aggregated.
- How much new for-sale + rental construction is in the pipeline within 1–3 miles? Heavy new supply typically softens prices + rents 12–24 months out; constrained supply supports both.
Investment metrics
- 1% rule
- 1.00% ✗
- Cap rate
- 7.99%
- Cash-on-cash
- 6.05%
- DSCR
- 1.27
- GRM
- 8.3
CMA / ARV
- ARV (median comp)
- $121,316
- List price
- $179,900
- Delta
- 48.29%
- Verdict
- OVERPRICED
- Comps
- 2 within 1.0 mi
Projected returns pro-forma
10.0% appreciation · 3.0% rent growth · sell at horizon
- IRR
- 28.7%
- Equity multiple
- 3.27×
- Total profit
- $114,121
- Equity at exit
- $162,068
- IRR
- 24.9%
- Equity multiple
- 7.42×
- Total profit
- $323,315
- Equity at exit
- $349,506
Cash invested: $50,372 (down + closing). Projections, not guarantees.
Landlord ↔ Tenant lean methodology
- Overall (STATE)
- 87 Strongly Landlord-Friendly
- State Florida
- 87 Strongly Landlord-Friendly · R+3
- County
- — inherits STATE
- City
- — inherits STATE
ZIP-level market 32693
- Home prices YoY
- 14.8%
- Active inventory
- 199
- Price-to-rent
- 8.3×
Monthly cashflow live
- Estimated rent
- $1,797 medium interval (Pro) →
- Mortgage (P&I)
- −$943
- Tax from tax record
- −$147 /mo · $1,766/yr
- Insurance
- −$75
- HOA
- −$0
- Vacancy / Maint / Mgmt
- −$377
- Net cashflow
- $254
Break-even live
UW: 25.0% down · 7.5% · 30yr · 1.5% tax · 5.0% vac · 8.0% maint · 8.0% mgmt
Financing live
Cash to close
- Down payment
- $44,975
- Closing costs
- $5,397
- Reserves months
- —
- Total cash needed
- —
Loan-product check · same deal, 3 products live
Conventional
25% down · 7.5% · 30yr
- Down + closing
- —
- Monthly P&I
- —
- Monthly cashflow
- —
- DSCR
- —
- Eligible?
- —
Personal DTI + credit; lowest rate.
DSCR
20% down · 8.5% · 30yr
- Down + closing
- —
- Monthly P&I
- —
- Monthly cashflow
- —
- DSCR
- —
- Eligible?
- —
No personal income docs; deal must DSCR.
Hard money
10% down · 12.0% · 12mo
- Down + closing
- —
- Monthly P&I
- —
- Monthly cashflow
- —
- DSCR
- —
- Eligible?
- —
Short-term bridge; refi at stabilization.
Listing history 25 events
-
2026-06-18days on market $179,900 Active 44 DOM
-
2026-06-17days on market $179,900 Active 43 DOM
-
2026-06-16days on market $179,900 Active 42 DOM
-
2026-06-15price $179,900 Active 41 DOM
-
2026-06-15days on market $184,900 Active 41 DOM
-
2026-06-14days on market $184,900 Active 39 DOM
-
2026-06-13days on market $184,900 Active 38 DOM
-
2026-06-10days on market $184,900 Active 36 DOM
-
2026-06-09days on market $184,900 Active 35 DOM
-
2026-06-08days on market $184,900 Active 34 DOM
-
2026-06-07days on market $184,900 Active 33 DOM
-
2026-06-05days on market $184,900 Active 30 DOM
-
2026-06-02days on market $184,900 Active 28 DOM
-
2026-06-01days on market $184,900 Active 27 DOM
-
2026-05-31days on market $184,900 Active 26 DOM
-
2026-05-30days on market $184,900 Active 25 DOM
-
2026-05-05$184,900 Active 720-char remark
-
2025-08-28price $184,900
-
2025-06-30$199,000 Active
-
2024-08-28price $199,000
-
2024-04-16$219,900 Active
-
2014-08-28historical
-
2010-02-26$71,900
-
2004-11-22soldstatus $56,600
-
1979-10-01soldstatus $11,300
ⓘ Source: listings_history table (triggers on properties + properties_extension) + one-shot
backfill from property_details.listing_events for pre-trigger history.
Tax reassessment forecast FL · Resets to sale price
- Current annual tax
- $1,766 · $147/mo
- Projected year-2 tax
- $1,766 · $147/mo
- Expected delta
- $0/yr ($0/mo · 0.0%)
ⓘ Screening estimate from a state-policy table — verify with the county assessor before closing.
Climate risk First Street
- Flood 1/10 Low FEMA zone X (unshaded) · 0% chance over 30 yrs
- Wildfire 4/10 Moderate
- Heat 8/10 Severe 5 d/yr ≥107°F today · 16 d/yr by 30 yrs out
- Wind 9/10 Extreme 99% chance of damaging wind over 30 yrs
- Air quality 2/10 Low 2 unhealthy d/yr today · 2 by 30 yrs out
Nearby sold comps map
Loading sold comps map…
Walkable amenities ~0.75 mi
Loading nearby amenities…
Taxation est. · year 1
- Rental income
- $21,560
- − Mortgage interest
- −$10,077
- − Property taxes
- −$1,766
- − Insurance
- −$900
- − Repairs & maintenance
- −$1,725
- − Management
- −$1,725
- − Depreciation
- −$5,233
- Taxable income
- $134
- Est. tax owed @ 24.0%
- −$32
- After-tax cash flow
- $3,013/yr
For passive investors: Depreciation is non-cash, so a rental often shows a tax loss while cash-flowing — sheltering income. Rental losses are passive: they offset passive income freely, and up to $25,000/yr can offset ordinary (W-2) income if you actively participate and your MAGI is under $100k (phasing out to $0 by $150k); unused losses carry forward. On sale, claimed depreciation is recaptured at up to 25%, and gains may owe capital-gains tax (a 1031 exchange can defer both). Figures are a year-1 estimate at your 24.0% rate — not tax advice; consult a CPA.
Schools (NCES district)
- District
- Gilchrist
- NCES district ID
- 1200630
- Math proficiency
- 66% ▼ -4.00%
- Reading proficiency
- 61% ▼ -5.00%
- Median HH income
- $39,610
- Composite
- 53.01/100
- National rank
- #1522
- State rank
- #9 of 73 in FL
Livability — Newberry
- Score
- 68/100
- State rank
- #524
- US rank
- #9753
Category grades
Schools grade is shown separately in the Schools card above.
Census & demographics
- City population
- 17,704
- Population (ZIP)
- 11,692
Population outlook (Gilchrist County) Hauer SSP2
- Today (2025)
- 17,730 people
- By 2030
- 17,722 · +-0.0%
- By 2040
- 17,393 · -1.9%
- By 2050
- 16,597 · -6.4%
- By 2075
- 14,300 · -19.3%
- By 2100
- 11,498 · -35.1%
Race, ethnicity, and origin ACS 2023
- Neighborhood character
- Predominantly White (82%)
- Race & ethnicity
- White 82% Hispanic / Latino 8% Two or more races 7% Black 5%
- Hispanic origin (detail)
- Mexican 2% Puerto Rican 3%
- Common ancestry
- Lithuanian 4% Slovak 3% Romanian 1%
- Foreign-born
- 4% · Canada
- Languages at home
- 94% English-only · Spanish 5%
Political lean MEDSL · Gilchrist
- 2024 margin
- Solid R (+68.0) · D 15.6% · R 83.6%
- 2008→2024 swing
- -21.2pp toward R · 2008: -46.8pp · 2024: -68.0pp
- All cycles
- 2024: R+68.0 2020: R+64.0 2016: R+62.8 2012: R+51.0 2008: R+46.8
Not yet ingested
- Civics
- —
Market trends
- HPI YoY
- ▲ 46.81%
- Current HPI
- 363.4299
- Rent YoY
- —
- Metro
- —
- State GDP YoY
- ▲ 3.28%
- F500 in state
- 36
Industry mix (Fortune 500 HQ in FL)
| Industry | F500 HQs | Revenue |
|---|---|---|
| Industrial Technology | 2 | $29B |
|
||
| Insurance | 2 | $17B |
|
||
| Retail | 1 | $60B |
|
||
| Technology Distribution | 1 | $58B |
|
||
| Homebuilding | 1 | $35B |
|
||
| Technology Manufacturing | 1 | $35B |
|
||
Price history
+1492.0% since first listed10 events — show timeline
- 2026-06-15 Price Changed $179,900 DGLMLS
- 2026-05-05 Listed $184,900 DGLMLS
- 2025-08-28 Price Changed $184,900 DGLMLS
- 2025-06-30 Listed $199,000 DGLMLS
- 2024-08-28 Price Changed $199,000 DGLMLS
- 2024-04-16 Listed $219,900 DGLMLS
- 2014-08-28 Listing Removed — Stellar MLS as Distributed by MLS Grid
- 2010-02-26 Listed $71,900 Stellar MLS as Distributed by MLS Grid
- 2004-11-22 Sold (Public Records) $56,600 Public Records
- 1979-10-01 Sold (Public Records) $11,300 Public Records
Property tax history
+7.8%/yrLatest (2025): $1,766 · +6.0% YoY. Source: county tax records.
Cash-flow waterfall
monthlySold comps — $/sqft
last 12 mo · ≤1 miLoading sold comps…