3572 W Ross Ave · Phoenix, AZ
Flood risk 1/10 · Minimal
- FEMA flood zone
- X (shaded)
- Chance of flooding over 30 yrs
- 0.0%
- Est. flood insurance / yr
- $507 – $1,088
Fire risk 5/10 · Moderate
- Est. fire insurance / yr
- $610 – $1,132
Heat risk 9/10 · Severe
- Hot days now (above 111°F)
- 7 days/yr
- Hot days in 30 yrs
- 19 days/yr
Wind risk 1/10 · Minimal
- Chance of severe wind over 30 yrs
- —
Air-quality risk 3/10 · Minor
- Unhealthy air days now
- 2 days/yr
- Unhealthy air days in 30 yrs
- 3 days/yr
Risk factors via First Street. Map © Google.
Why this score? — see what drove the F grade
The composite is a weighted blend of 9 inputs, each scored 0–100. Each bar is that input's sub-score; the figure is the points it added to the 100-point composite (weight × sub-score).
- Cash flow +12.4/30.0
- Schools +4.7/10.0
- Livability +3.8/5.0
- DSCR +3.7/10.0
- ARV discount +3.5/15.0
- Condition / age +2.5/5.0
- 1% rule +2.2/10.0
- Rent growth +1.9/5.0
- Appreciation +0.0/10.0
$269,900
🖨 Deal sheet (PDF) 📄 Offer letter ✓ Due diligence
Listing remarks MLS
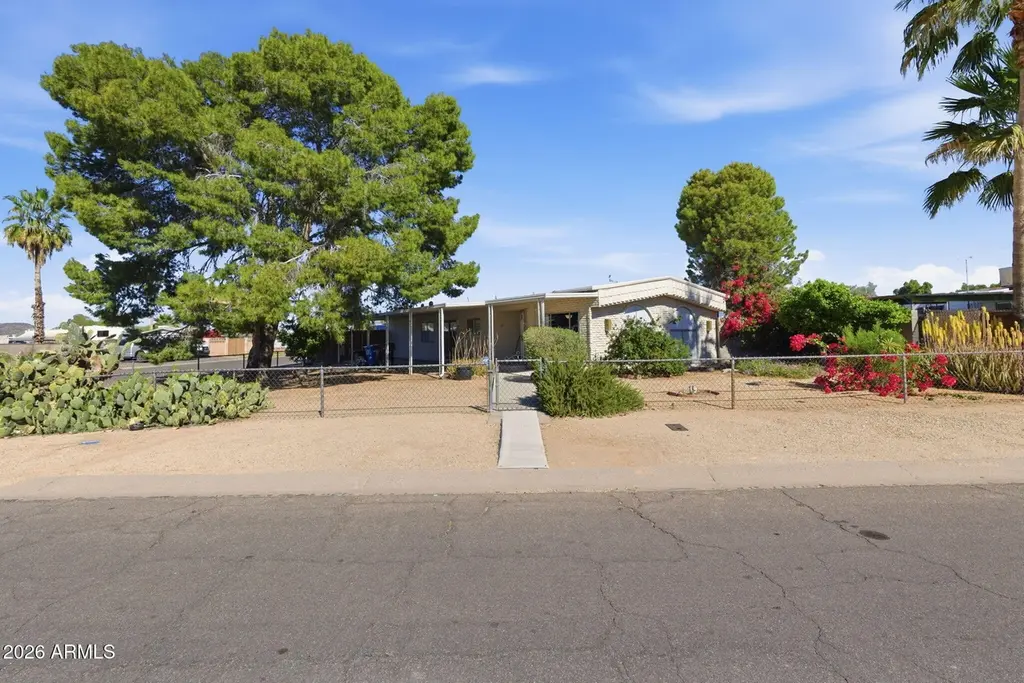
This Home in located in North Phoenix, has No HOA and is has been updated in the right places like a very large walk in closet for the Primary Bedroom. With mature trees, artificial turf and a RV gate, this is perfect for all you toys and your work equipment. Built 1973, so not FHA, VA or conventional loans. 21st Mortgage out of Knoxville, TN will lend on the property. The carport and garage work well as a workshop or two park your vehicles. The is a turn key home that is move in ready for the right cash buyer or getting a loan from 21st Mortgage. Come tour today and make this your own.
Key facts
- Carport
- Rv gate
- Artificial turf
Tags
Neighborhood map
What this means for you Summary
Snapshot
- This is a 2-bed/2.0-bath manufactured listed at $270k.
Deal economics
- At list price, monthly cash flow is $-43 ($-513/yr) — negative.
- To cash-flow at today's rent, offer at most $262k (2.8% below list).
- To meet the 1% rule (rent ≥ 1% of price), the offer needs to be $195k (27.9% below list).
- Recommended offer: $195k (27.9% below list) — sets the bar for 1% rule.
- Cap rate 6.1% vs local median 3.3% in Phoenix — top-decile yield for the area; either an underpriced asset or a hidden risk that comps aren't pricing in. Stress-test before assuming the spread holds.
Location & tenants
- Location reads 75/100 on livability (#16 in AZ, #3,924 nationally) — a middle-class / working-renter tenant base. Strengths: amenities A+, commute A+, housing A+; Watch: health & safety C-, crime F.
- Deer Valley Unified District (4246) (urban): math 50% / reading 55% proficiency, ranked #33 of 249 in AZ (top 13%) — acceptable for families but not a draw, mixed tenant base, ~2y average lease.
- Market conditions: Rents soft (-2.4%/yr); 303 active listings in the ZIP; 37 comparable units currently listed for rent nearby; rentals at typical pace (median 17d on market — plan ~3-4 weeks tenant-placement turnaround); solid renter incomes; 36,011 units permitted in Maricopa County in 2024 (12,801 in 5+ unit buildings).
Forward outlook
- Local home prices are declining (-3.0%/yr); year-one equity from $2k of loan paydown is wiped out by about $8k of value loss. Plan a longer hold.
- Maricopa County population projected at +38% by 2050 — long-run rental-demand tailwind backs the buy-and-hold thesis.
Negotiation context
- It's been on market 91 days — a 9% lower offer ($246k) is reasonable based on typical stale-listing flexibility.
- 2 sale attempts since 22y ago; this cycle's ask has dropped $30k (10%) from the opening price — seller is motivated, your offer sets the floor, not the list.
- Current owner paid $80k; list at $270k implies a 237% gain — meaningful room to come down on a strong offer.
Risks & watch-outs
- Climate carrying-cost: moderate wildfire risk; extreme-heat days projected 7→19/yr by 2055 (HVAC capex compounding) — expect insurance premiums to compound above CPI over the hold.
Questions for the listing agent
- What do current leases actually rent for vs. the listed asking? Can we see a recent rent roll and the last 12 months of T-12 income?
- It's been on market 91 days. Have you received any prior offers? Is the seller open to a 28% concession, seller financing, or rate buy-down credit?
- Built in 1973 — when were the roof, HVAC, electrical panel, plumbing, and water heater last replaced?
- Why hasn't it sold? Are there any deal-killer items the seller is aware of (foundation, flood, title, zoning, code violations)?
- Is there a deadline driving the sale (1031 exchange, divorce, estate, relocation)? That informs how much negotiation room exists.
- Crime grade is F in this area — have there been break-ins, vandalism, or insurance claims at this property in the last 3 years? What carrier currently insures it and at what premium?
- The area grade is low — what's the realistic commute time and amenity access for the typical tenant pool here? Any planned neighborhood developments (good or bad) we should know about?
- What's the average days-on-market for RENTAL listings here right now (not sales)? A rising rental-DOM trend means longer vacancies and softer asking-rent achievability than the comps imply.
- What's the recent tenant-quality profile in this submarket — average credit score on applications, eviction rate, late-payment / NSF rate, and stable-employment percentage? A property-management company in the area should have these aggregated.
- How much new for-sale + rental construction is in the pipeline within 1–3 miles? Heavy new supply typically softens prices + rents 12–24 months out; constrained supply supports both.
Investment metrics
- 1% rule
- 0.72% ✗
- Cap rate
- 6.10%
- Cash-on-cash
- -0.68%
- DSCR
- 0.97
- GRM
- 11.6
CMA / ARV
- ARV (median comp)
- $247,691
- List price
- $269,900
- Delta
- 8.97%
- Verdict
- FAIR
- Comps
- 10 within 1.0 mi
Show comp detail 10 sales within ~0.75 mi
| Address | Dist | Beds/Ba | Sqft | Sold | Price | $/sf | Match |
|---|---|---|---|---|---|---|---|
| 3613 W Ross Ave | 0.07mi | 3/2.0 (+1) | 1,466 (+2%) | 8mo | $308,000 | $210 | 83 |
| 3702 W Abraham Ln | 0.22mi | 2/2.0 | 1,512 (+5%) | 5mo | $245,000 | $162 | 77 |
| 3617 W Rose Garden Ln | 0.06mi | 3/2.0 (+1) | 1,499 (+4%) | 12mo | $315,000 | $210 | 75 |
| 3840 W Rose Garden Ln | 0.30mi | 2/2.0 | 1,441 (+0%) | 17mo | $330,000 | $229 | 72 |
| 3716 W Rose Garden Ln | 0.13mi | 3/2.0 (+1) | 1,296 (-10%) | 1mo | $338,000 | $261 | 71 |
| 3521 W Lone Cactus Dr | 0.20mi | 3/2.0 (+1) | 1,568 (+9%) | 3mo | $255,000 | $163 | 68 |
| 3557 W Ross Ave | 0.04mi | 3/2.0 (+1) | 1,568 (+9%) | 16mo | $265,000 | $169 | 65 |
| 3523 W Quail Ave | 0.15mi | 3/2.0 (+1) | 1,232 (-14%) | 6mo | $260,000 | $211 | 59 |
| 3850 W Abraham Ln | 0.30mi | 3/2.0 (+1) | 1,344 (-7%) | 18mo | $295,000 | $219 | 55 |
| 3810 W Mohawk Ln | 0.37mi | 2/2.0 | 1,616 (+12%) | 13mo | $310,000 | $192 | 51 |
Match score weights: distance 35% · size 25% · config 20% · recency 20%. Top-matched comps best support the ARV.
Projected returns pro-forma
-3.0% appreciation · 0.0% rent growth · sell at horizon
- IRR
- -20.4%
- Equity multiple
- 0.31×
- Total profit
- $-52,304
- Equity at exit
- $40,243
- IRR
- -20.4%
- Equity multiple
- 0.05×
- Total profit
- $-71,676
- Equity at exit
- $23,336
Cash invested: $75,572 (down + closing). Projections, not guarantees.
Landlord ↔ Tenant lean methodology
- Overall (STATE)
- 87 Strongly Landlord-Friendly
- State Arizona
- 87 Strongly Landlord-Friendly · R+3
- County
- — inherits STATE
- City
- — inherits STATE
ZIP-level market 85308
- Rents YoY
- -2.4%
- Active inventory
- 303
- Price-to-rent
- 11.6×
Monthly cashflow live
- Estimated rent
- $1,945 high interval (Pro) →
- Mortgage (P&I)
- −$1,415
- Tax from tax record
- −$52 /mo · $619/yr
- Insurance
- −$112
- HOA
- −$0
- Vacancy / Maint / Mgmt
- −$408
- Net cashflow
- $-43
Break-even live
Sensitivity live
| Price | -10% $110 | -5% $34 | +0% $-43 | +5% $-119 | +10% $-196 |
|---|---|---|---|---|---|
| Rent | -10% $-196 | -5% $-120 | +0% $-43 | +5% $34 | +10% $111 |
| Rate | -1.0pp $93 | -0.5pp $26 | base $-43 | +0.5pp $-113 | +1.0pp $-184 |
UW: 25.0% down · 7.5% · 30yr · 1.5% tax · 5.0% vac · 8.0% maint · 8.0% mgmt
Financing live
Cash to close
- Down payment
- $67,475
- Closing costs
- $8,097
- Reserves months
- —
- Total cash needed
- —
Loan-product check · same deal, 3 products live
Conventional
25% down · 7.5% · 30yr
- Down + closing
- —
- Monthly P&I
- —
- Monthly cashflow
- —
- DSCR
- —
- Eligible?
- —
Personal DTI + credit; lowest rate.
DSCR
20% down · 8.5% · 30yr
- Down + closing
- —
- Monthly P&I
- —
- Monthly cashflow
- —
- DSCR
- —
- Eligible?
- —
No personal income docs; deal must DSCR.
Hard money
10% down · 12.0% · 12mo
- Down + closing
- —
- Monthly P&I
- —
- Monthly cashflow
- —
- DSCR
- —
- Eligible?
- —
Short-term bridge; refi at stabilization.
Rent comps 37 comps
| Address | Beds | Baths | Sqft | Rent | $/sqft | DOM | Units | Dist |
|---|---|---|---|---|---|---|---|---|
| 21655 N 36th Ave #135 Glendale, AZ | 3.0 | 2.5 | 1457 | $2,100 | $1.44 | 22d | 1 | 0.33mi |
| 3732 W Firehawk Dr Glendale, AZ | 3.0 | 2.0 | 1254 | $1,929 | $1.54 | 0d | 1 | 0.36mi |
| 3425 W Deer Valley Rd Phoenix, AZ | 1.0–3.0 | 1.0–2.0 | 963 | $1,848 | $1.92 | 3d | 8 | 0.42mi |
| 3547 W Via del Sol Dr Glendale, AZ | 3.0 | 2.0 | 1720 | $2,300 | $1.34 | 5d | 1 | 0.43mi |
| 21812 N 36th Ln Glendale, AZ | 3.0 | 2.0 | 1138 | $1,811 | $1.59 | 25d | 1 | 0.43mi |
| 4039 W Salter Dr Glendale, AZ | 3.0 | 2.5 | 1689 | $2,485 | $1.47 | 44d | 1 | 0.54mi |
| 20601 N 33rd Ave Phoenix, AZ | 3.0 | 2.0 | 1085 | $2,100 | $1.94 | 25d | 1 | 0.54mi |
| 4039 W Salter Dr Glendale, AZ | 3.0 | 2.5 | 1689 | $2,210 | $1.31 | 21d | 1 | 0.54mi |
| 3711 W Blackhawk Dr Glendale, AZ | 3.0 | 2.0 | 1567 | $2,200 | $1.40 | 11d | 1 | 0.55mi |
| 3257 W Melinda Ln Phoenix, AZ | 3.0 | 2.0 | 1101 | $2,086 | $1.89 | 25d | 1 | 0.59mi |
| 3215 W Salter Dr Phoenix, AZ | 3.0 | 2.0 | 1451 | $2,145 | $1.48 | 13d | 1 | 0.59mi |
| 3215 W Salter Dr Phoenix, AZ | 3.0 | 2.0 | 1450 | $2,145 | $1.48 | 4d | 1 | 0.59mi |
| 20818 N 42nd Ave Glendale, AZ | 3.0 | 2.0 | 1701 | $3,000 | $1.76 | 44d | 1 | 0.70mi |
| 3049 W Covey Ln Phoenix, AZ | 3.0 | 2.0 | 1101 | $1,850 | $1.68 | 44d | 1 | 0.73mi |
| 20245 N 32nd Dr Phoenix, AZ | 1.0–2.0 | 1.0–2.0 | 834 | $1,530 | $1.83 | 0d | 13 | 0.75mi |
| 3011 W Zachary Dr Phoenix, AZ | 3.0 | 2.0 | 1324 | $1,945 | $1.47 | 8d | 1 | 0.81mi |
| 3338 W Tonto Ln Phoenix, AZ | 2.0 | 1.0 | 1206 | $1,375 | $1.14 | 8d | 1 | 0.94mi |
| 22052 N 30th Dr Phoenix, AZ | 3.0 | 2.5 | 1421 | $2,120 | $1.49 | 17d | 1 | 0.98mi |
| 22045 N 30th Dr Phoenix, AZ | 3.0 | 2.5 | 1421 | $1,999 | $1.41 | 44d | 1 | 1.00mi |
| 2902 W Irma Ln Phoenix, AZ | 3.0 | 2.0 | 1553 | $2,295 | $1.48 | 44d | 1 | 1.00mi |
| 3132 W Robin Ln Phoenix, AZ | 3.0 | 2.0 | 1086 | $1,781 | $1.64 | 13d | 1 | 1.02mi |
| 2811 W Deer Valley Rd Phoenix, AZ | 2.0 | 2.0 | 952 | $1,448 | $1.52 | 6d | 1 | 1.05mi |
| 2811 W Deer Valley Rd Phoenix, AZ | 2.0 | 2.0 | 952 | $1,527 | $1.60 | 44d | 1 | 1.05mi |
| 22022 N 29th Dr Phoenix, AZ | 3.0 | 2.0 | 1508 | $1,871 | $1.24 | 8d | 1 | 1.07mi |
| 20808 N 27th Ave Phoenix, AZ | 1.0–3.0 | 1.0–2.0 | 962 | $1,560 | $1.62 | 0d | 15 | 1.11mi |
| 2819 W Louise Dr Unit 2 Phoenix, AZ | 2.0 | 2.0 | 1750 | $1,850 | $1.06 | 25d | 1 | 1.12mi |
| 20018 N 43rd Ln Glendale, AZ | 3.0 | 2.0 | 1464 | $2,180 | $1.49 | 8d | 1 | 1.15mi |
| 22227 N 29th Dr Phoenix, AZ | 3.0 | 2.5 | 1558 | $1,899 | $1.22 | 25d | 1 | 1.17mi |
| 22125 N 29th Ave Phoenix, AZ | 2.0–4.0 | 2.5–4.0 | 1771 | $2,275 | $1.28 | 44d | 3 | 1.18mi |
| 19601 N 43rd Dr Glendale, AZ | 3.0 | 2.0 | 1145 | $2,000 | $1.75 | 44d | 1 | 1.30mi |
| 3010 W Yorkshire Dr Phoenix, AZ | 1.0–3.0 | 1.0–2.0 | 975 | $1,444 | $1.48 | 2d | 80 | 1.30mi |
| 4425 W Tonto Rd Glendale, AZ | 3.0 | 2.5 | 1585 | $2,014 | $1.27 | 25d | 1 | 1.36mi |
| 4545 W Beardsley Rd Glendale, AZ | 1.0–2.0 | 1.0–2.0 | 1012 | $1,836 | $1.81 | 0d | 16 | 1.37mi |
| 4461 W Tonto Rd Glendale, AZ | 3.0 | 2.5 | 1264 | $1,995 | $1.58 | 6d | 1 | 1.41mi |
| 4441 W Oraibi Dr Glendale, AZ | 3.0 | 2.5 | 1264 | $1,995 | $1.58 | 15d | 1 | 1.42mi |
| 2929 W Yorkshire Dr Phoenix, AZ | 1.0–3.0 | 1.0–2.0 | 915 | $1,498 | $1.64 | 19d | 2 | 1.44mi |
| 3411 W Morrow Dr #3 Phoenix, AZ | 2.0 | 1.5 | 1056 | $1,495 | $1.42 | 44d | 1 | 1.48mi |
Listing history 23 events
-
2026-06-18days on market $269,900 Active 91 DOM
-
2026-06-17days on market $269,900 Active 90 DOM
-
2026-06-16days on market $269,900 Active 89 DOM
-
2026-06-15days on market $269,900 Active 88 DOM
-
2026-06-13days on market $269,900 Active 86 DOM
-
2026-06-13days on market $269,900 Active 85 DOM
-
2026-06-09days on market $269,900 Active 82 DOM
-
2026-06-08days on market $269,900 Active 81 DOM
-
2026-06-07days on market $269,900 Active 80 DOM
-
2026-06-04days on market $269,900 Active 77 DOM
-
2026-06-03days on market $269,900 Active 76 DOM
-
2026-06-02days on market $269,900 Active 75 DOM
-
2026-06-01days on market $269,900 Active 74 DOM
-
2026-05-31days on market $269,900 Active 73 DOM
-
2026-05-12price $269,900 593-char remark
Show marketing remark (593 chars)
This Home in located in North Phoenix, has No HOA and is has been updated in the right places like a very large walk in closet for the Primary Bedroom. With mature trees, artificial turf and a RV gate, this is perfect for all you toys and your work equipment. Built 1973, so not FHA, VA or conventional loans. 21st Mortgage out of Knoxville, TN will lend on the property. The carport and garage work well as a workshop or two park your vehicles. The is a turn key home that is move in ready for the right cash buyer or getting a loan from 21st Mortgage. Come tour today and make this your own.
-
2026-05-06price $285,000 593-char remark
Show marketing remark (593 chars)
This Home in located in North Phoenix, has No HOA and is has been updated in the right places like a very large walk in closet for the Primary Bedroom. With mature trees, artificial turf and a RV gate, this is perfect for all you toys and your work equipment. Built 1973, so not FHA, VA or conventional loans. 21st Mortgage out of Knoxville, TN will lend on the property. The carport and garage work well as a workshop or two park your vehicles. The is a turn key home that is move in ready for the right cash buyer or getting a loan from 21st Mortgage. Come tour today and make this your own.
-
2026-03-25price $290,000 593-char remark
Show marketing remark (593 chars)
This Home in located in North Phoenix, has No HOA and is has been updated in the right places like a very large walk in closet for the Primary Bedroom. With mature trees, artificial turf and a RV gate, this is perfect for all you toys and your work equipment. Built 1973, so not FHA, VA or conventional loans. 21st Mortgage out of Knoxville, TN will lend on the property. The carport and garage work well as a workshop or two park your vehicles. The is a turn key home that is move in ready for the right cash buyer or getting a loan from 21st Mortgage. Come tour today and make this your own.
-
2026-03-19$300,000 Active 593-char remark
Show marketing remark (593 chars)
This Home in located in North Phoenix, has No HOA and is has been updated in the right places like a very large walk in closet for the Primary Bedroom. With mature trees, artificial turf and a RV gate, this is perfect for all you toys and your work equipment. Built 1973, so not FHA, VA or conventional loans. 21st Mortgage out of Knoxville, TN will lend on the property. The carport and garage work well as a workshop or two park your vehicles. The is a turn key home that is move in ready for the right cash buyer or getting a loan from 21st Mortgage. Come tour today and make this your own.
-
2005-01-12soldstatus $80,000
-
2005-01-07soldstatus $80,000 263-char remark
Show marketing remark (263 chars)
GORGEOUS 2BEDR 2BATH HOME, MOVE-IN CONDITION, ON A LARGE CORNER LOT W/MATURE CITRUS TREES. STORAGE SHED AND A WORK SHOP, 2 COVERED PATIOS, CARPETED THROUGHOUT, NICE LARGE KITCHEN W/NEWER GAS COOKTOP AND LARGE REFRIGERATOR. SPA CONVEYS. DON'T LET THIS ONE PASS BY!
-
2004-12-16historical 263-char remark
Show marketing remark (263 chars)
GORGEOUS 2BEDR 2BATH HOME, MOVE-IN CONDITION, ON A LARGE CORNER LOT W/MATURE CITRUS TREES. STORAGE SHED AND A WORK SHOP, 2 COVERED PATIOS, CARPETED THROUGHOUT, NICE LARGE KITCHEN W/NEWER GAS COOKTOP AND LARGE REFRIGERATOR. SPA CONVEYS. DON'T LET THIS ONE PASS BY!
-
2004-10-25$87,500 263-char remark
Show marketing remark (263 chars)
GORGEOUS 2BEDR 2BATH HOME, MOVE-IN CONDITION, ON A LARGE CORNER LOT W/MATURE CITRUS TREES. STORAGE SHED AND A WORK SHOP, 2 COVERED PATIOS, CARPETED THROUGHOUT, NICE LARGE KITCHEN W/NEWER GAS COOKTOP AND LARGE REFRIGERATOR. SPA CONVEYS. DON'T LET THIS ONE PASS BY!
-
1982-03-03soldstatus $31,000
ⓘ Source: listings_history table (triggers on properties + properties_extension) + one-shot
backfill from property_details.listing_events for pre-trigger history.
Tax reassessment forecast AZ · Resets to sale price
- Current annual tax
- $619 · $52/mo
- Projected year-2 tax
- $1,781 · $148/mo
- Expected delta
- +$1,162/yr (+$97/mo · 187.7%)
ⓘ Screening estimate from a state-policy table — verify with the county assessor before closing.
Climate risk First Street
- Flood 1/10 Low FEMA zone X (shaded) · 0% chance over 30 yrs
- Wildfire 5/10 Major
- Heat 9/10 Extreme 7 d/yr ≥111°F today · 19 d/yr by 30 yrs out
- Wind 1/10 Low
- Air quality 3/10 Moderate 2 unhealthy d/yr today · 3 by 30 yrs out
Nearby sold comps map
Loading sold comps map…
Walkable amenities ~0.75 mi
Loading nearby amenities…
Taxation est. · year 1
- Rental income
- $23,342
- − Mortgage interest
- −$15,119
- − Property taxes
- −$619
- − Insurance
- −$1,350
- − Repairs & maintenance
- −$1,867
- − Management
- −$1,867
- − Depreciation
- −$7,852
- Taxable loss
- −$5,331
- Est. tax savings @ 24.0%
- +$1,280
- After-tax cash flow
- $767/yr
For passive investors: Depreciation is non-cash, so a rental often shows a tax loss while cash-flowing — sheltering income. Rental losses are passive: they offset passive income freely, and up to $25,000/yr can offset ordinary (W-2) income if you actively participate and your MAGI is under $100k (phasing out to $0 by $150k); unused losses carry forward. On sale, claimed depreciation is recaptured at up to 25%, and gains may owe capital-gains tax (a 1031 exchange can defer both). Figures are a year-1 estimate at your 24.0% rate — not tax advice; consult a CPA.
Schools (NCES district)
- District
- Deer Valley Unified District (4246)
- NCES district ID
- 0407750
- Math proficiency
- 50% ▼ -9.00%
- Reading proficiency
- 55% ▼ -6.00%
- Median HH income
- $72,516
- Composite
- 47.0/100
- National rank
- #2346
- State rank
- #33 of 249 in AZ
Livability — Phoenix
- Score
- 75/100
- State rank
- #16
- US rank
- #3924
Category grades
Schools grade is shown separately in the Schools card above.
Census & demographics
- Census place
- Phoenix, AZ
- County
- Maricopa County · 4,537,380 people
- City population
- 1,500,198
- Metro
- Phoenix-Mesa-Chandler, AZ
- Population (ZIP)
- 65,095
- Household income
- $95,247
- Rent vs Own
- Severe rent burden
- 1896.0
Population outlook (Maricopa County) Hauer SSP2
- Today (2025)
- 4,979,203 people
- By 2030
- 5,378,229 · +8.0%
- By 2040
- 6,156,598 · +23.6%
- By 2050
- 6,872,376 · +38.0%
- By 2075
- 8,401,270 · +68.7%
- By 2100
- 9,247,439 · +85.7%
Race, ethnicity, and origin ACS 2023
- Neighborhood character
- Predominantly White (70%)
- Race & ethnicity
- White 70% Hispanic / Latino 14% Two or more races 12% Asian 5% Black 2% Native American 1%
- Hispanic origin (detail)
- Mexican 11%
- Common ancestry
- Romanian 3% Lithuanian 3% Portuguese 2%
- Foreign-born
- 11% · Canada, China, South Korea
- Languages at home
- 84% English-only · Spanish 6% Other Indo-European 3% Russian/Polish/Slavic 2%
Political lean MEDSL · Maricopa
- 2024 margin
- Toss-up / Even · D 47.7% · R 51.2% · Other 1.1%
- 2008→2024 swing
- +7.1pp toward D · 2008: -10.6pp · 2024: -3.5pp
- All cycles
- 2024: R+3.5 2020: D+2.2 2016: R+3.5 2012: R+12.0 2008: R+10.6
Not yet ingested
- Civics
- —
Market trends
- HPI YoY
- ▼ -259.70%
- Current HPI
- 296.0366
- Rent YoY
- ▼ -2.39%
- Metro
- Phoenix-Mesa-Chandler, AZ
- State GDP YoY
- ▲ 4.54%
- F500 in state
- 20
Industry mix (Fortune 500 HQ in AZ)
| Industry | F500 HQs | Revenue |
|---|---|---|
| Technology | 2 | $13B |
|
||
| Mining / Metals | 1 | $23B |
|
||
| Environmental Services | 1 | $16B |
|
||
| Metals / Steel | 1 | $14B |
|
||
| Technology Distribution | 1 | $9B |
|
||
| Homebuilding | 1 | $8B |
|
||
Price history
+770.6% since first listed9 events — show timeline
- 2026-05-12 Price Changed $269,900 ARMLS
- 2026-05-06 Price Changed $285,000 ARMLS
- 2026-03-25 Price Changed $290,000 ARMLS
- 2026-03-19 Listed $300,000 ARMLS
- 2005-01-12 Sold (Public Records) $80,000 Public Records
- 2005-01-07 Sold (MLS) $80,000 ARMLS
- 2004-12-16 Listing Removed — ARMLS
- 2004-10-25 Listed $87,500 ARMLS
- 1982-03-03 Sold (Public Records) $31,000 Public Records
Property tax history
+6.0%/yrLatest (2025): $619 · +1.0% YoY. Source: county tax records.
Cash-flow waterfall
monthlySold comps — $/sqft
last 12 mo · ≤1 miLoading sold comps…