 🌊 Lakefront
1250 Yesica Ann Cir Unit E106 · Naples Park, FL
Flood risk 7/10 · Major
- FEMA flood zone
- X (shaded)
- Chance of flooding over 30 yrs
- 0.96%
- Est. flood insurance / yr
- $507 – $1,088
Fire risk 3/10 · Minor
- Est. fire insurance / yr
- $947 – $1,759
Heat risk 10/10 · Severe
- Hot days now (above 107°F)
- 8 days/yr
- Hot days in 30 yrs
- 34 days/yr
Wind risk 10/10 · Severe
- Chance of severe wind over 30 yrs
- 99.0%
Air-quality risk 2/10 · Minimal
- Unhealthy air days now
- 1 days/yr
- Unhealthy air days in 30 yrs
- 1 days/yr
Risk factors via First Street. Map © Google.
Why this score? — see what drove the C+ grade
The composite is a weighted blend of 9 inputs, each scored 0–100. Each bar is that input's sub-score; the figure is the points it added to the 100-point composite (weight × sub-score).
- Cash flow +23.1/30.0
- 1% rule +8.7/10.0
- ARV discount +7.5/15.0
- DSCR +7.4/10.0
- Schools +5.0/10.0
- Condition / age +3.8/5.0
- Livability +3.2/5.0
- Rent growth +2.2/5.0
- Appreciation +0.0/10.0
$299,000
🖨 Deal sheet (PDF) 📄 Offer letter ✓ Due diligence
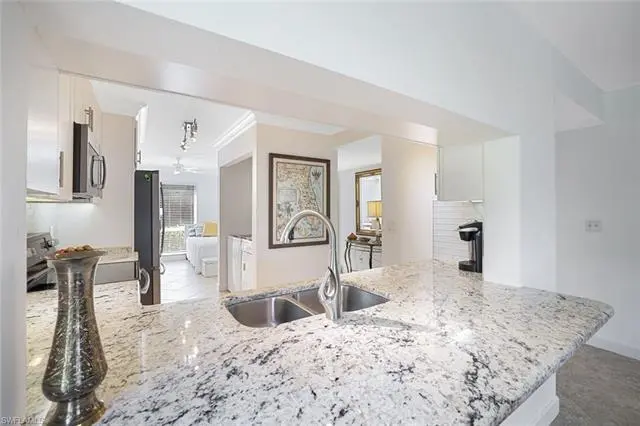
Listing remarks
Fabulous end unit with an extra window bringing in natural light and green space. Large neutral tile set on the diagonal, flows throughout the kitchen, great room, flex space and foyer. There is upgraded new carpet in both bedrooms. This modern kitchen has new cabinetry, lovely granite counters and extra custom built-ins. There is a separate flex space perfect for office/den or overflow sleeping area. The open and spacious feel is light, bright and airy. The Owner's suite has upgraded designer carpet, large walk-in closet & private bath. Pocket sliders to the lanai open up the bedroom to the lanai, blending the outdoors with inside. The large lanai is enclosed keeping it spotless duri
Key facts
- Green space
- Flex space
- Natural light
Tags
Property features AI
Finance
- Other: Development: Imperial Golf Estates — Abbey on the Lake; Sub-condo: Abbey on the Lake (Subdivision number 160600); Directions: Enter Imperial off US 41 1 mile north of Immokalee Rd; Abbey on the Lake will be on the left — turn right inside Abbey on the Lake; building on left
- HOA & community: Mandatory HOA with professional management; Quarterly condo fee of $1,899; Total annual recurring fees $7,596; Total one-time fees $100; HOA maintenance covers cable, irrigation water, lawn/land maintenance, legal/accounting, manager, master association fee, reserves, street lights, and street maintenance; Community amenities include pool, golf course, private membership, putting green, restaurant, streetlights, and underground utilities; Community type: gated (golf equity)
Exterior
- Parking: 1 assigned parking space
- Security: Gated community; Guard at gate
- Utilities: Central water; Central sewer; Cable available; Electric service (central)
- Home design: Residential end-unit; Low-rise (1-3 stories); Rear exposure facing southwest; Zero lot line
- Construction: Concrete block construction; Stucco exterior finish; Shingle roof; Built in 1991
- Exterior features: Automatic sprinkler system; Lake and water feature view; Lake/canal irrigation
Interior
- Kitchen: Pantry; Dishwasher; Microwave; Range; Refrigerator/Freezer
- Bedrooms: 2 bedrooms; First floor bedroom; Master bedroom on ground level; Split bedroom layout
- Flooring: Concrete; Tile
- Bathrooms: 2 full bathrooms; Master bath with shower only
- Heating & cooling: Central electric heat; Central electric cooling
- Interior features: Foyer; Smoke detectors; Walk-in closet; Window coverings; Great room floor plan; Pantry; Dining (family); Glass porch; Screened lanai/porch; Furnished
- Laundry & utility: Washer and dryer; Laundry in residence
Neighborhood map
What this means for you Summary
Snapshot
- This is a 2-bed/2.0-bath condo listed at $299k. Condition is rated good.
Deal economics
- At list price, monthly cash flow is $470 ($6k/yr) — positive.
- The deal already cash-flows at list — no discount required.
- Meets the 1% rule at list price ($4k rent vs $299k).
- Recommended offer: $295k (1.5% below list) — sets the bar for market timing.
Location & tenants
- Location reads 64/100 on livability (#696 in FL) — a middle-class / working-renter tenant base. Strengths: crime A+, housing A-, employment B+; Watch: health & safety D, amenities F, commute F.
- Collier (suburban): math 60% / reading 56% proficiency, ranked #16 of 73 in FL (top 22%) — acceptable for families but not a draw, mixed tenant base, ~2y average lease.
- Zoned schools: Naples Park Elementary School (math 67% / reading 57%, grade B, #608 of 2,144 statewide, top 29%, 395 students, 48% FRL); North Naples Middle School (math 79% / reading 73%, grade A, #34 of 571 statewide, top 6%, 903 students, 25% FRL); Lely High School (math 40% / reading 39%, grade F, #304 of 667 statewide, top 47%, 1,504 students, 54% FRL).
- Market conditions: Rents soft (-1.1%/yr); 595 active listings in the ZIP; 35 comparable units currently listed for rent nearby; rentals at typical pace (median 25d on market — plan ~3-4 weeks tenant-placement turnaround); solid renter incomes; 3,520 units permitted in Collier County in 2024 (959 in 5+ unit buildings).
- At $4,096/mo this rent would consume 50% of the median local household income ($98k/yr) (locally 1006% of renters already pay >50% of income on rent) — very limited rent-growth headroom before tenants either downsize or default.
Forward outlook
- Local home prices are declining (-3.0%/yr); year-one equity from $2k of loan paydown is wiped out by about $9k of value loss. Plan a longer hold.
- Collier County population projected at +30% by 2050 — long-run rental-demand tailwind backs the buy-and-hold thesis.
Negotiation context
- It's been on market 16 days — a 2% lower offer ($295k) is reasonable based on typical stale-listing flexibility.
- 2 sale attempts with the ask held roughly flat each time — persistent listings suggest the price (not the market) is what's stuck; bring a comps-based counter.
Risks & watch-outs
- Watch-outs: flood insurance adds $66/mo.
- Climate carrying-cost: major flood risk; severe wind risk, 99% chance of damaging wind over 30y; extreme-heat days projected 8→34/yr by 2055 (HVAC capex compounding) — expect insurance premiums to compound above CPI over the hold.
Questions for the listing agent
- What's the actual annual flood-insurance premium (NFIP or private), and is the property in a SFHA with mandatory coverage?
- What does the HOA fee cover, when was the last increase, and are there any pending special assessments or reserve-fund shortfalls?
- Any open or pending special assessments — roof, HVAC, plumbing, elevator, façade? What's the per-unit balance and payoff schedule, and is the seller paying it off at close or rolling it to the buyer?
- Is there a deadline driving the sale (1031 exchange, divorce, estate, relocation)? That informs how much negotiation room exists.
- Schools are F-rated, which usually means shorter tenancies and higher turnover. Who's the typical renter profile here, and what's been the actual vacancy rate?
- This sits on a lake — are riparian / water-frontage rights deeded with the parcel? Any dock permits, shoreline easements, or HOA water-use restrictions?
- What's the documented flood / surge / shoreline-erosion history here (FEMA AND non-FEMA — e.g., storm surge, creek backup, septic-field saturation)?
- Any water-quality or seasonal algae-bloom issues that affect tenant satisfaction or short-term-rental demand?
- What's the average days-on-market for RENTAL listings here right now (not sales)? A rising rental-DOM trend means longer vacancies and softer asking-rent achievability than the comps imply.
- What's the recent tenant-quality profile in this submarket — average credit score on applications, eviction rate, late-payment / NSF rate, and stable-employment percentage? A property-management company in the area should have these aggregated.
- How much new apartment / multifamily construction is in the pipeline within 1–3 miles? Heavy new supply (>2% of stock underway) typically softens rents 12–24 months out; light construction supports rent growth.
Investment metrics
- 1% rule
- 1.37% ✓
- Cap rate
- 8.45%
- Cash-on-cash
- 7.69%
- DSCR
- 1.34
- GRM
- 6.1
CMA / ARV
No comps found within radius.
Projected returns pro-forma
-3.0% appreciation · 0.0% rent growth · sell at horizon
- IRR
- -10.2%
- Equity multiple
- 0.64×
- Total profit
- $-30,016
- Equity at exit
- $44,582
- IRR
- -7.3%
- Equity multiple
- 0.62×
- Total profit
- $-31,970
- Equity at exit
- $25,852
Cash invested: $83,720 (down + closing). Projections, not guarantees.
Landlord ↔ Tenant lean methodology
- Overall (STATE)
- 87 Strongly Landlord-Friendly
- State Florida
- 87 Strongly Landlord-Friendly · R+3
- County
- — inherits STATE
- City
- — inherits STATE
ZIP-level market 34110
- Rents YoY
- -1.1%
- Active inventory
- 595
- Price-to-rent
- 6.1×
Monthly cashflow live
- Estimated rent
- $4,096 high interval (Pro) →
- Mortgage (P&I)
- −$1,568
- Tax est. 1.5%
- −$374 /mo · $4,485/yr
- Insurance
- −$125
- Flood insurance flood zone
- −$66 /mo · $798/yr
- HOA
- −$633
- Vacancy / Maint / Mgmt
- −$860
- Net cashflow
- $470
Break-even live
Sensitivity live
| Price | -10% $677 | -5% $574 | +0% $470 | +5% $367 | +10% $264 |
|---|---|---|---|---|---|
| Rent | -10% $147 | -5% $308 | +0% $470 | +5% $632 | +10% $794 |
| Rate | -1.0pp $621 | -0.5pp $546 | base $470 | +0.5pp $393 | +1.0pp $314 |
UW: 25.0% down · 7.5% · 30yr · 1.5% tax · 5.0% vac · 8.0% maint · 8.0% mgmt
Financing live
Cash to close
- Down payment
- $74,750
- Closing costs
- $8,970
- Reserves months
- —
- Total cash needed
- —
Loan-product check · same deal, 3 products live
Conventional
25% down · 7.5% · 30yr
- Down + closing
- —
- Monthly P&I
- —
- Monthly cashflow
- —
- DSCR
- —
- Eligible?
- —
Personal DTI + credit; lowest rate.
DSCR
20% down · 8.5% · 30yr
- Down + closing
- —
- Monthly P&I
- —
- Monthly cashflow
- —
- DSCR
- —
- Eligible?
- —
No personal income docs; deal must DSCR.
Hard money
10% down · 12.0% · 12mo
- Down + closing
- —
- Monthly P&I
- —
- Monthly cashflow
- —
- DSCR
- —
- Eligible?
- —
Short-term bridge; refi at stabilization.
Rent comps 35 comps
| Address | Beds | Baths | Sqft | Rent | $/sqft | DOM | Units | Dist |
|---|---|---|---|---|---|---|---|---|
| 1290 Yesica Ann Cir Unit G203 Naples, FL | 2.0 | 2.0 | 1245 | $6,000 | $4.82 | 15d | 1 | 0.08mi |
| 1290 Yesica Ann Cir Unit G-105 Naples, FL | 2.0 | 2.0 | 1168 | $5,500 | $4.71 | 15d | 1 | 0.08mi |
| 1190 Yesica Ann Cir Unit B101 Naples, FL | 2.0 | 2.0 | 1245 | $2,500 | $2.01 | 15d | 1 | 0.13mi |
| 1150 Yesica Ann Cir Unit A205 Naples, FL | 2.0 | 2.0 | 1300 | $6,000 | $4.62 | 15d | 1 | 0.18mi |
| 1351 Park Lake Dr Unit 14R Naples, FL | 2.0 | 2.0 | 1400 | $2,200 | $1.57 | 15d | 1 | 0.23mi |
| 1120 Sarah Jean Cir Unit B205 Naples, FL | 3.0 | 2.0 | 1370 | $2,300 | $1.68 | 15d | 1 | 0.26mi |
| 1530 Imperial Golf Course Blvd #321 Naples, FL | 2.0 | 2.0 | 1400 | $2,100 | $1.50 | 25d | 1 | 0.40mi |
| 1520 Imperial Golf Course Blvd #211 Naples, FL | 2.0 | 2.0 | 1357 | $5,000 | $3.68 | 25d | 1 | 0.45mi |
| 953 Bunker Hill Dr Naples, FL | 2.0 | 2.0 | 1100 | $3,200 | $2.91 | 15d | 1 | 0.52mi |
| 1790 Imperial Golf Course Blvd Unit A205 Naples, FL | 2.0 | 2.0 | 1183 | $2,300 | $1.94 | 15d | 1 | 0.61mi |
| 1337 Center Ln Naples, FL | 3.0 | 2.0 | 1500 | $4,300 | $2.87 | 25d | 1 | 0.68mi |
| 830 Wiggins Pass Rd #10 Naples, FL | 1.0 | 1.0 | 800 | $1,350 | $1.69 | 25d | 1 | 0.70mi |
| 13140 Hamilton Harbour Dr Unit F4 Naples, FL | 2.0 | 2.0 | 1340 | $5,500 | $4.10 | 25d | 1 | 0.70mi |
| 975 Tarpon Cove Dr #204 Naples, FL | 3.0 | 2.0 | 1340 | $5,500 | $4.10 | 15d | 1 | 0.79mi |
| 752 Wiggins Lake Dr #102 Naples, FL | 2.0 | 2.0 | 1402 | $2,375 | $1.69 | 22d | 1 | 0.83mi |
| 757 Wiggins Lake Dr #106 Naples, FL | 3.0 | 2.0 | 1374 | $6,000 | $4.37 | 15d | 1 | 0.84mi |
| 757 Wiggins Lake Dr #106 Naples, FL | 3.0 | 2.0 | 1374 | $6,000 | $4.37 | 25d | 1 | 0.84mi |
| 760 Wiggins Lake Dr #205 Naples, FL | 2.0 | 2.0 | 1179 | $5,500 | $4.66 | 25d | 1 | 0.86mi |
| 1282 Belaire Ct Naples, FL | 3.0 | 3.5 | 1495 | $9,500 | $6.35 | 25d | 1 | 0.91mi |
| 1025 Tarpon Cove Dr #203 Naples, FL | 2.0 | 2.0 | 1225 | $5,500 | $4.49 | 15d | 1 | 0.91mi |
| 437 Wiggins Lake Ct #201 Naples, FL | 2.0 | 2.0 | 1283 | $4,500 | $3.51 | 25d | 1 | 0.94mi |
| 1130 Turtle Creek Blvd Naples, FL | 1.0–2.0 | 1.0–2.0 | 800 | $2,145 | $2.68 | 15d | 22 | 0.96mi |
| 774 Wiggins Lake Dr #106 Naples, FL | 3.0 | 2.0 | 1374 | $6,500 | $4.73 | 25d | 1 | 0.96mi |
| 651 Wiggins Lake Dr #102 Naples, FL | 2.0 | 2.0 | 1487 | $6,500 | $4.37 | 25d | 1 | 1.01mi |
| 480 Bermuda Cove Way Unit 1-104 Naples, FL | 2.0 | 2.0 | 1372 | $4,250 | $3.10 | 25d | 1 | 1.21mi |
| 241 Palm River Blvd Unit C202 Naples, FL | 2.0 | 2.0 | 1430 | $3,500 | $2.45 | 25d | 1 | 1.23mi |
| 240 Palm River Blvd Unit C102 Naples, FL | 2.0 | 2.0 | 1440 | $2,995 | $2.08 | 25d | 1 | 1.28mi |
| 360 Horse Creek Dr Naples, FL | 2.0 | 2.0 | 1589 | $5,250 | $3.30 | 15d | 4 | 1.34mi |
| 340 Horse Creek Dr #304 Naples, FL | 2.0 | 2.0 | 1326 | $2,950 | $2.22 | 25d | 1 | 1.38mi |
| 320 Horse Creek Dr #105 Naples, FL | 2.0 | 2.0 | 1326 | $5,600 | $4.22 | 25d | 1 | 1.41mi |
| 729 Palm View Dr Unit D4 Naples, FL | 2.0 | 2.0 | 1133 | $2,250 | $1.99 | 25d | 1 | 1.43mi |
| 681 Palm View Dr Naples, FL | 2.0 | 2.0 | 1240 | $2,100 | $1.69 | 15d | 1 | 1.44mi |
| 300 Horse Creek Dr #408 Naples, FL | 2.0 | 2.0 | 1434 | $5,500 | $3.84 | 25d | 1 | 1.45mi |
| 186 Pebble Shores Dr #103 Naples, FL | 2.0 | 2.0 | 1042 | $2,500 | $2.40 | 25d | 1 | 1.48mi |
| 15985 Arbor View Blvd Naples, FL | 2.0–4.0 | 2.0 | 1208 | $1,848 | $1.53 | 15d | 14 | 1.50mi |
HOA detail condo
- Monthly dues
- $633 · $7,596/yr
- Assessments
- None detected in remarks — confirm with the listing agent.
Listing history 11 events
-
2026-06-21days on market $299,000 Active 16 DOM
-
2026-06-18days on market $299,000 Active 13 DOM
-
2026-06-17days on market $299,000 Active 12 DOM
-
2026-06-16days on market $299,000 Active 11 DOM
-
2026-06-15days on market $299,000 Active 10 DOM
-
2026-06-14days on market $299,000 Active 8 DOM
-
2026-06-10days on market $299,000 Active 5 DOM
-
2026-06-09days on market $299,000 Active 4 DOM
-
2026-06-08days on market $299,000 Active 3 DOM
-
2026-06-07remarks 695-char remark
-
2026-06-07$299,000 Active 2 DOM
ⓘ Source: listings_history table (triggers on properties + properties_extension) + one-shot
backfill from property_details.listing_events for pre-trigger history.
Climate risk First Street
- Flood 7/10 Severe FEMA zone X (shaded) · 96% chance over 30 yrs
- Wildfire 3/10 Moderate
- Heat 10/10 Extreme 8 d/yr ≥107°F today · 34 d/yr by 30 yrs out
- Wind 10/10 Extreme 99% chance of damaging wind over 30 yrs
- Air quality 2/10 Low 1 unhealthy d/yr today · 1 by 30 yrs out
Nearby sold comps map
Loading sold comps map…
Walkable amenities ~0.75 mi
Loading nearby amenities…
Taxation est. · year 1
- Rental income
- $49,154
- − Mortgage interest
- −$16,749
- − Property taxes
- −$4,485
- − Insurance
- −$2,292
- − Repairs & maintenance
- −$3,932
- − Management
- −$3,932
- − HOA
- −$7,596
- − Depreciation
- −$8,698
- Taxable income
- $1,469
- Est. tax owed @ 24.0%
- −$353
- After-tax cash flow
- $5,290/yr
For passive investors: Depreciation is non-cash, so a rental often shows a tax loss while cash-flowing — sheltering income. Rental losses are passive: they offset passive income freely, and up to $25,000/yr can offset ordinary (W-2) income if you actively participate and your MAGI is under $100k (phasing out to $0 by $150k); unused losses carry forward. On sale, claimed depreciation is recaptured at up to 25%, and gains may owe capital-gains tax (a 1031 exchange can defer both). Figures are a year-1 estimate at your 24.0% rate — not tax advice; consult a CPA.
Condition & rehab AI · 13 photos
This end-unit condo is in good condition with upgrades in the kitchen and bathrooms. It has a good curb appeal and a spacious lanai with a view of the water.
Value-add opportunities
- Resale Paint touch-ups — Fresh paint can enhance the home's curb appeal and make it more attractive to potential buyers.
- Both Landscaping improvements — Enhancing the landscaping can improve the home's curb appeal and increase its rental value.
Renovation cost estimate screening
Value-add ROI direction
- Resale Paint touch-ups — Fresh paint can enhance the home's curb appeal and make it more attractive to potential buyers. ↑
- Both Landscaping improvements — Enhancing the landscaping can improve the home's curb appeal and increase its rental value. ↑
ⓘ Cost ranges are severity-bucket heuristics (US national rule-of-thumb). Get contractor quotes + a written scope before underwriting a rehab budget.
Schools (NCES district)
- District
- Collier
- NCES district ID
- 1200330
- Math proficiency
- 60% ▼ -4.00%
- Reading proficiency
- 56% ▼ -2.00%
- Median HH income
- $58,275
- Composite
- 50.23/100
- National rank
- #1892
- State rank
- #16 of 73 in FL
Livability — Naples Park
- Score
- 64/100
- State rank
- #696
- US rank
- #14564
Category grades
Schools grade is shown separately in the Schools card above.
Census & demographics
- County
- Collier County · 396,295 people
- Metro
- Naples-Marco Island, FL
- Population (ZIP)
- 25,630
- Household income
- $97,564
- Rent vs Own
- Severe rent burden
- 1006.0
Population outlook (Collier County) Hauer SSP2
- Today (2025)
- 420,858 people
- By 2030
- 450,054 · +6.9%
- By 2040
- 502,232 · +19.3%
- By 2050
- 544,932 · +29.5%
- By 2075
- 627,203 · +49.0%
- By 2100
- 659,015 · +56.6%
Race, ethnicity, and origin ACS 2023
- Neighborhood character
- Predominantly White (84%)
- Race & ethnicity
- White 84% Hispanic / Latino 10% Two or more races 9% Asian 2% Black 1%
- Hispanic origin (detail)
- Mexican 2% Puerto Rican 1% Cuban 3%
- Common ancestry
- Romanian 4% Lithuanian 3% Slovak 2%
- Foreign-born
- 11% · Canada, South Korea
- Languages at home
- 87% English-only · Spanish 7% Other Indo-European 3% French/Haitian/Cajun 1%
Political lean MEDSL · Collier
- 2024 margin
- Solid R (+33.1) · D 33.1% · R 66.2%
- 2008→2024 swing
- -10.6pp toward R · 2008: -22.5pp · 2024: -33.1pp
- All cycles
- 2024: R+33.1 2020: R+24.7 2016: R+26.0 2012: R+30.1 2008: R+22.5
Not yet ingested
- Civics
- —
Market trends
- HPI YoY
- ▼ -172.68%
- Current HPI
- 267.4644
- Rent YoY
- ▼ -1.06%
- Metro
- Naples-Marco Island, FL
- State GDP YoY
- ▲ 3.28%
- F500 in state
- 36
Industry mix (Fortune 500 HQ in FL)
| Industry | F500 HQs | Revenue |
|---|---|---|
| Industrial Technology | 2 | $29B |
|
||
| Insurance | 2 | $17B |
|
||
| Retail | 1 | $60B |
|
||
| Technology Distribution | 1 | $58B |
|
||
| Homebuilding | 1 | $35B |
|
||
| Technology Manufacturing | 1 | $35B |
|
||
Price history
-5.1% since first listed4 events — show timeline
- 2026-06-05 Listed $299,000 NAPLESMLS
- 2026-04-14 Listing Removed — NAPLESMLS
- 2026-03-23 Price Changed $299,900 NAPLESMLS
- 2026-02-16 Listed $315,000 NAPLESMLS
Cash-flow waterfall
monthlySold comps — $/sqft
last 12 mo · ≤1 miLoading sold comps…