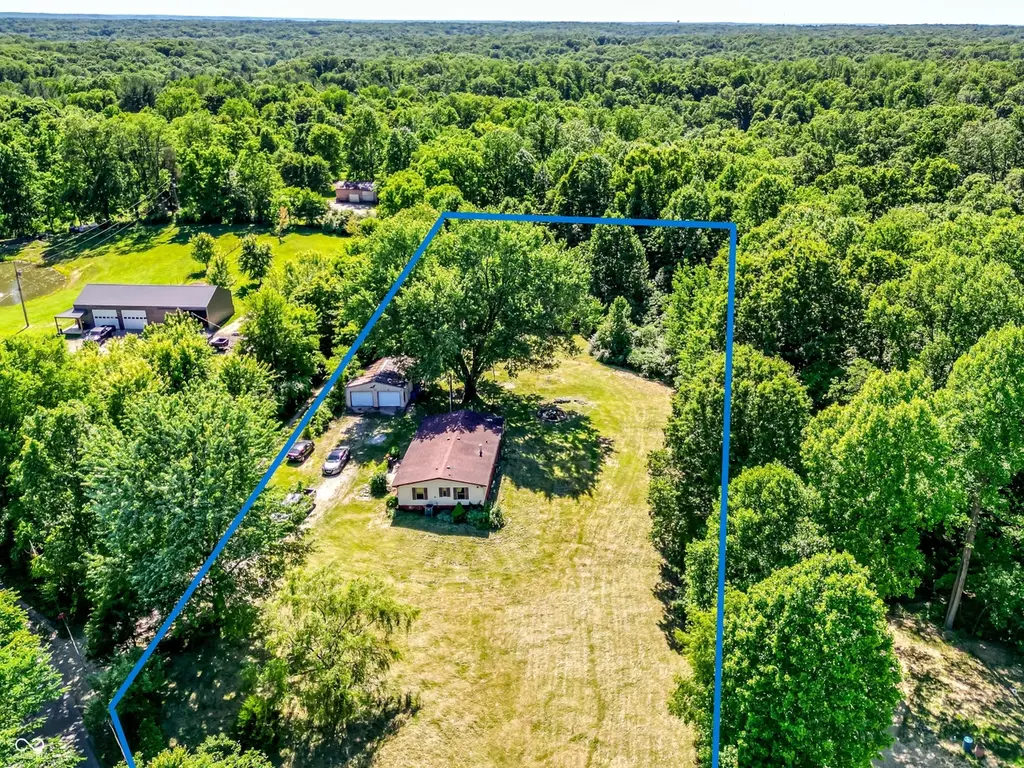
8730 Sweetwater Trl · Cordry Sweetwater Lakes, IN
Flood risk 1/10 · Minimal
- FEMA flood zone
- X (unshaded)
- Chance of flooding over 30 yrs
- 0.0%
- Est. flood insurance / yr
- $507 – $1,088
Fire risk 3/10 · Minor
- Est. fire insurance / yr
- $717 – $1,331
Heat risk 3/10 · Minor
- Hot days now (above 102°F)
- 7 days/yr
- Hot days in 30 yrs
- 19 days/yr
Wind risk 2/10 · Minimal
- Chance of severe wind over 30 yrs
- 1.0%
Air-quality risk 2/10 · Minimal
- Unhealthy air days now
- 1 days/yr
- Unhealthy air days in 30 yrs
- 2 days/yr
Risk factors via First Street. Map © Google.
Why this score? — see what drove the B- grade
The composite is a weighted blend of 9 inputs, each scored 0–100. Each bar is that input's sub-score; the figure is the points it added to the 100-point composite (weight × sub-score).
- Cash flow +30.0/30.0
- DSCR +10.0/10.0
- 1% rule +8.4/10.0
- ARV discount +7.5/15.0
- Schools +3.7/10.0
- Livability +3.4/5.0
- Rent growth +2.5/5.0
- Condition / age +2.5/5.0
- Appreciation +0.0/10.0
$89,900
🖨 Deal sheet 📄 Offer letter ✓ Due diligence
Listing remarks MLS
Home needs work. Large 2 car detached garage. Home is sold as-is. Proof of funds or pre-approval letter must accompany all offers.
Key facts
- Newer furnace
- Attached workshop
- Central air
Tags
Property features AI
Exterior
- Parking: Detached 3-car garage (864 sq ft)
- Utilities: Private water; Septic sewage
- Home design: Manufactured home; Attached property; Single-story
- Construction: Block foundation; Other construction materials
- Exterior features: Approximately 2 acres (1–3 acres range)
Interior
- Kitchen: Kitchen on main level
- Bedrooms: Three bedrooms on the main level; Primary bedroom includes a sitting room
- Bathrooms: Two full bathrooms; Primary bathroom with full shower stall
- Heating & cooling: Electric forced-air heating; Central air conditioning
- Interior features: Built-in features; Water heater
- Laundry & utility: In-unit laundry plus common laundry
Neighborhood map
What this means for you Summary
Snapshot
- This is a 3-bed/2.0-bath manufactured listed at $90k.
Deal economics
- At list price, monthly cash flow is $429 ($5k/yr) — positive.
- The deal already cash-flows at list — no discount required.
- Meets the 1% rule at list price ($1k rent vs $90k).
- Cap rate 12.0% vs local median 1.2% in Cordry Sweetwater Lakes — top-decile yield for the area; either an underpriced asset or a hidden risk that comps aren't pricing in. Stress-test before assuming the spread holds.
Location & tenants
- Location reads 67/100 on livability (#255 in IN) — a middle-class / working-renter tenant base. Strengths: crime A+, employment A+, housing A+; Watch: amenities F, commute F, health & safety F.
- Brown County School Corporation (rural): math 37% / reading 48% proficiency, ranked #113 of 301 in IN (top 38%) — families likely to look elsewhere, expect single-tenant / working-renter base with shorter leases.
- Zoned schools: Brown County High School (math 27% / reading 67%, grade D-, #143 of 369 statewide, top 44%, 509 students, 48% FRL).
- Market conditions: 76 active listings in the ZIP; 76 units permitted in Brown County in 2024 (0 in 5+ unit buildings).
Forward outlook
- Local home prices are declining (-3.0%/yr); year-one equity from $622 of loan paydown is wiped out by about $3k of value loss. Plan a longer hold.
- Brown County population projected at -12% by 2050 — secular population decline; favor cash flow + early exit over multi-decade hold.
- At projected returns (-3.0% appreciation + 3.0% rent growth), your $25k cash investment doubles in ~6 years — after that, you're playing with house money.
Negotiation context
- Only 5 days on market — expect competitive offers; lowballing is unlikely to land.
- 2 sale attempts since 23y ago with the ask held roughly flat each time — persistent listings suggest the price (not the market) is what's stuck; bring a comps-based counter.
- Current owner paid $19k; list at $90k implies a 376% gain — meaningful room to come down on a strong offer.
Questions for the listing agent
- Is there a deadline driving the sale (1031 exchange, divorce, estate, relocation)? That informs how much negotiation room exists.
- Schools are F-rated, which usually means shorter tenancies and higher turnover. Who's the typical renter profile here, and what's been the actual vacancy rate?
- What's the average days-on-market for RENTAL listings here right now (not sales)? A rising rental-DOM trend means longer vacancies and softer asking-rent achievability than the comps imply.
- What's the recent tenant-quality profile in this submarket — average credit score on applications, eviction rate, late-payment / NSF rate, and stable-employment percentage? A property-management company in the area should have these aggregated.
- How much new for-sale + rental construction is in the pipeline within 1–3 miles? Heavy new supply typically softens prices + rents 12–24 months out; constrained supply supports both.
Investment metrics
- 1% rule
- 1.34% ✓
- Cap rate
- 12.02%
- Cash-on-cash
- 20.44%
- DSCR
- 1.91
- GRM
- 6.2
CMA / ARV
No comps found within radius.
Projected returns pro-forma
-3.0% appreciation · 3.0% rent growth · sell at horizon
- IRR
- 12.7%
- Equity multiple
- 1.50×
- Total profit
- $12,702
- Equity at exit
- $13,404
- IRR
- 21.6%
- Equity multiple
- 2.83×
- Total profit
- $46,061
- Equity at exit
- $7,773
Cash invested: $25,172 (down + closing). Projections, not guarantees.
Landlord ↔ Tenant lean methodology
- Overall (STATE)
- 90 Strongly Landlord-Friendly
- State Indiana
- 90 Strongly Landlord-Friendly · R+11
- County
- — inherits STATE
- City
- — inherits STATE
ZIP-level market 46164
- Active inventory
- 76
- Price-to-rent
- 6.2×
Monthly cashflow live
- Estimated rent
- $1,208 medium interval (Pro) →
- Mortgage (P&I)
- −$471
- Tax from tax record
- −$17 /mo · $200/yr
- Insurance
- −$37
- HOA
- −$0
- Vacancy / Maint / Mgmt
- −$254
- Net cashflow
- $429
Break-even live
UW: 25.0% down · 7.5% · 30yr · 1.5% tax · 5.0% vac · 8.0% maint · 8.0% mgmt
Financing live
Cash to close
- Down payment
- $22,475
- Closing costs
- $2,697
- Reserves months
- —
- Total cash needed
- —
Loan-product check · same deal, 3 products live
Conventional
25% down · 7.5% · 30yr
- Down + closing
- —
- Monthly P&I
- —
- Monthly cashflow
- —
- DSCR
- —
- Eligible?
- —
Personal DTI + credit; lowest rate.
DSCR
20% down · 8.5% · 30yr
- Down + closing
- —
- Monthly P&I
- —
- Monthly cashflow
- —
- DSCR
- —
- Eligible?
- —
No personal income docs; deal must DSCR.
Hard money
10% down · 12.0% · 12mo
- Down + closing
- —
- Monthly P&I
- —
- Monthly cashflow
- —
- DSCR
- —
- Eligible?
- —
Short-term bridge; refi at stabilization.
Listing history 5 events
-
2026-06-09statusdays on market $89,900 Pending 5 DOM
-
2026-06-08days on market $89,900 Active 4 DOM
-
2026-06-07days on market $89,900 Active 3 DOM
-
2026-06-05remarks 699-char remark
-
2026-06-05$89,900 Active 1 DOM
ⓘ Source: listings_history table (triggers on properties + properties_extension) + one-shot
backfill from property_details.listing_events for pre-trigger history.
Tax reassessment forecast IN · Partial reset (capped growth)
- Current annual tax
- $200 · $17/mo
- Projected year-2 tax
- $482 · $40/mo
- Expected delta
- +$282/yr (+$23/mo · 140.8%)
ⓘ Screening estimate from a state-policy table — verify with the county assessor before closing.
Climate risk First Street
- Flood 1/10 Low FEMA zone X (unshaded) · 0% chance over 30 yrs
- Wildfire 3/10 Moderate
- Heat 3/10 Moderate 7 d/yr ≥102°F today · 19 d/yr by 30 yrs out
- Wind 2/10 Low 100% chance of damaging wind over 30 yrs
- Air quality 2/10 Low 1 unhealthy d/yr today · 2 by 30 yrs out
Nearby sold comps map
Loading sold comps map…
Walkable amenities ~0.75 mi
Loading nearby amenities…
Taxation est. · year 1
- Rental income
- $14,497
- − Mortgage interest
- −$5,036
- − Property taxes
- −$200
- − Insurance
- −$450
- − Repairs & maintenance
- −$1,160
- − Management
- −$1,160
- − Depreciation
- −$2,615
- Taxable income
- $3,877
- Est. tax owed @ 24.0%
- −$930
- After-tax cash flow
- $4,215/yr
For passive investors: Depreciation is non-cash, so a rental often shows a tax loss while cash-flowing — sheltering income. Rental losses are passive: they offset passive income freely, and up to $25,000/yr can offset ordinary (W-2) income if you actively participate and your MAGI is under $100k (phasing out to $0 by $150k); unused losses carry forward. On sale, claimed depreciation is recaptured at up to 25%, and gains may owe capital-gains tax (a 1031 exchange can defer both). Figures are a year-1 estimate at your 24.0% rate — not tax advice; consult a CPA.
Schools (NCES district)
- District
- Brown County School Corporation
- NCES district ID
- 1800960
- Math proficiency
- 37% ▼ -15.00%
- Reading proficiency
- 48% ▼ -6.00%
- Median HH income
- $53,070
- Composite
- 36.82/100
- National rank
- #4563
- State rank
- #113 of 301 in IN
Livability — Cordry Sweetwater Lakes
- Score
- 67/100
- State rank
- #255
- US rank
- #10835
Category grades
Schools grade is shown separately in the Schools card above.
Census & demographics
- City population
- 3,991
- Population (ZIP)
- 3,991
Population outlook (Brown County) Hauer SSP2
- Today (2025)
- 14,677 people
- By 2030
- 14,458 · -1.5%
- By 2040
- 13,727 · -6.5%
- By 2050
- 12,841 · -12.5%
- By 2075
- 11,232 · -23.5%
- By 2100
- 9,129 · -37.8%
Race, ethnicity, and origin ACS 2023
- Neighborhood character
- Predominantly White (96%)
- Race & ethnicity
- White 96% Two or more races 2% Pacific Islander 1%
- Common ancestry
- Romanian 3% Lithuanian 2% Slovak 2%
- Foreign-born
- 1% · Canada
- Languages at home
- 98% English-only · Spanish 2%
Political lean MEDSL · Brown
- 2024 margin
- Solid R (+32.6) · D 32.8% · R 65.5% · Other 1.7%
- 2008→2024 swing
- -30.1pp toward R · 2008: -2.5pp · 2024: -32.6pp
- All cycles
- 2024: R+32.6 2020: R+30.5 2016: R+31.6 2012: R+16.8 2008: R+2.5
Not yet ingested
- Civics
- —
Market trends
- HPI YoY
- ▼ -129.89%
- Current HPI
- 218.3894
- Rent YoY
- —
- Metro
- —
- State GDP YoY
- ▲ 2.90%
- F500 in state
- 18
Industry mix (Fortune 500 HQ in IN)
| Industry | F500 HQs | Revenue |
|---|---|---|
| Industrial Machinery | 2 | $37B |
|
||
| Healthcare | 1 | $177B |
|
||
| Pharmaceuticals | 1 | $45B |
|
||
| Metals / Steel | 1 | $18B |
|
||
| Agriculture | 1 | $17B |
|
||
| Packaging | 1 | $12B |
|
||
Price history
+375.7% since first listed3 events — show timeline
- 2026-06-04 Listed $89,900 MIBOR as Distributed by MLS Grid
- 2003-05-22 Sold (MLS) $18,900 MIBOR as Distributed by MLS Grid
- 2003-04-28 Listed $18,900 MIBOR as Distributed by MLS Grid
Property tax history
-10.5%/yrLatest (2025): $200 · -2.4% YoY. Source: county tax records.
Cash-flow waterfall
monthlySold comps — $/sqft
last 12 mo · ≤1 miLoading sold comps…