 16-Plex
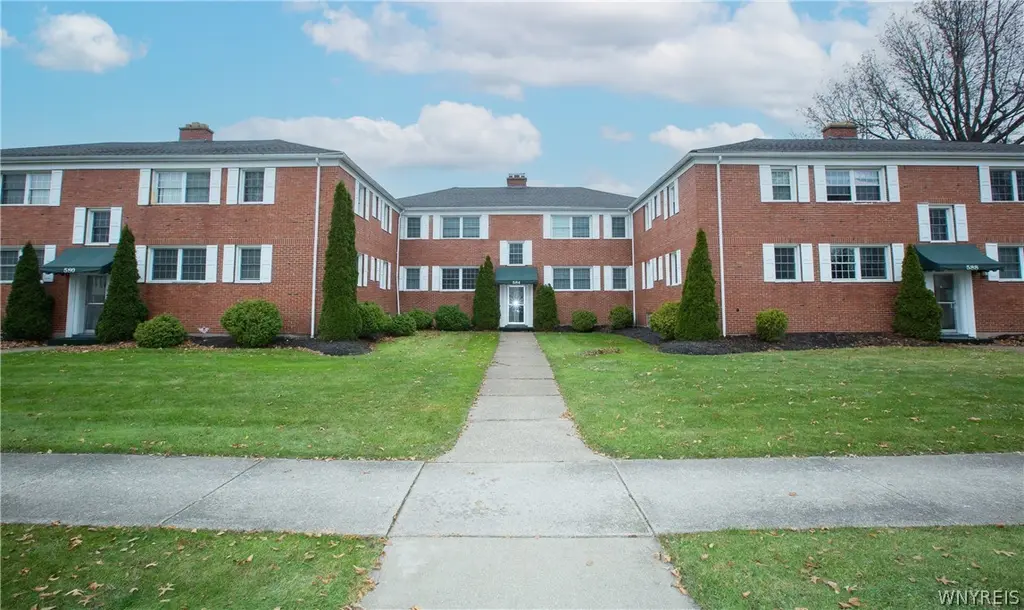
580 Starin Ave · Buffalo, NY
Flood risk 1/10 · Minimal
- FEMA flood zone
- X (unshaded)
- Chance of flooding over 30 yrs
- 0.0%
- Est. flood insurance / yr
- $473 – $860
Fire risk 1/10 · Minimal
- Est. fire insurance / yr
- $691 – $1,283
Heat risk 3/10 · Minor
- Hot days now (above 92°F)
- 7 days/yr
- Hot days in 30 yrs
- 15 days/yr
Wind risk 1/10 · Minimal
- Chance of severe wind over 30 yrs
- —
Air-quality risk 3/10 · Minor
- Unhealthy air days now
- 2 days/yr
- Unhealthy air days in 30 yrs
- 3 days/yr
Risk factors via First Street. Map © Google.
Why this score? — see what drove the B- grade
The composite is a weighted blend of 9 inputs, each scored 0–100. Each bar is that input's sub-score; the figure is the points it added to the 100-point composite (weight × sub-score).
- Cash flow +30.0/30.0
- DSCR +10.0/10.0
- 1% rule +8.5/10.0
- ARV discount +7.5/15.0
- Livability +3.9/5.0
- Rent growth +3.4/5.0
- Schools +3.3/10.0
- Condition / age +2.5/5.0
- Appreciation +0.0/10.0
$1,760,000
🖨 Deal sheet (PDF) 📄 Offer letter ✓ Due diligence
Multi-family units
County records classify this as Multi-Family (5+ Unit). Listing-text estimate: 16 units. confirmed
5+ unit building — per-unit beds/baths from public records are typically unavailable; the breakdown below (if shown) is an estimate from the listing text.
Listing remarks
Situated in North Buffalo this 16-unit apartment building has received over $180,000 in capital improvements since purchase. 10 of the 16 units have been renovated with Quartz countertops and tile bathrooms. All brick exterior with newer windows. 100% occupancy with a long history of strong occupancy. 12 garage spots with 8 additional parking spots. Attractive landscaping and professionally management help secure long term tenants.
Key facts
- 0.6 acre lot
- Garage
- Built 1949
Property features AI
Finance
- Financial info: Gross income reported at $215,700; Operating expenses reported at $49,468; Operating expenses include accounting, electric, fuel, insurance, legal, maintenance, professional management, snow removal, trash, water/sewer
- HOA & community: Storage facilities available; Owner pays grounds care, garage, heat, hot water, trash collection, water; Rent includes common area maintenance, heat, hot water, parking, trash collection, water
Exterior
- Parking: Garage parking; Three or more parking spaces
- Utilities: Electricity connected; Public water connected; Sewer connected
- Home design: Multi-family property with 16 total units; 2 stories; Existing (previously built)
- Construction: Brick construction; Blown-in insulation; Asphalt roof
- Exterior features: Blacktop driveway; Concrete driveway; Corner, rectangular lot; dimensions approximately 200 x 130
Interior
- Kitchen: Electric cooktop; Refrigerator
- Bedrooms: 16-unit building (number of bedrooms per unit not specified)
- Flooring: Hardwood; Tile; Varies by unit
- Heating & cooling: Gas heating; Hot water heat
- Interior features: Full basement; Hardwood and tile flooring; varies by unit; Electric cooktop; Gas water heater; Refrigerator
- Laundry & utility: Gas water heater
Neighborhood map
What this means for you Summary
Snapshot
- This is a 16 × 2-bed/1-bath units multifamily listed at $1.76M.
Deal economics
- At list price, monthly cash flow is $8k ($100k/yr) — positive. Per door: $522/mo.
- The deal already cash-flows at list — no discount required.
- Meets the 1% rule at list price ($24k rent vs $1.76M).
- Recommended offer: $1.73M (1.5% below list) — sets the bar for market timing.
- Cap rate 12.0% vs local median 8.1% in Buffalo — top-decile yield for the area; either an underpriced asset or a hidden risk that comps aren't pricing in. Stress-test before assuming the spread holds.
Location & tenants
- Location reads 77/100 on livability (#195 in NY, #3,011 nationally) — a middle-class / working-renter tenant base. Strengths: commute A+, housing A+, health & safety A+; Watch: crime F, employment D-.
- Buffalo City School District (urban): math 41% / reading 40% proficiency, ranked #535 of 590 in NY (top 91%) — families likely to look elsewhere, expect single-tenant / working-renter base with shorter leases; 75% free/reduced lunch — lower-income household profile, screen leases tightly.
- Zoned schools: International School (math 8% / reading 17%, grade F, #2,048 of 2,108 statewide, top 97%, 981 students, 92% FRL); Hutchinson Central Technical High School (math 96% / reading 32%, grade B-, #807 of 1,100 statewide, top 73%, 1,175 students, 78% FRL).
- Market conditions: Rents rising (+3.6%/yr); 92 active listings in the ZIP; 1,244 units permitted in Erie County in 2024 (563 in 5+ unit buildings).
- At $23,763/mo this rent would consume 410% of the median local household income ($70k/yr) (locally 1831% of renters already pay >50% of income on rent) — very limited rent-growth headroom before tenants either downsize or default.
Forward outlook
- Local home prices are declining (-3.0%/yr); year-one equity from $12k of loan paydown is wiped out by about $53k of value loss. Plan a longer hold.
- At projected returns (-3.0% appreciation + 3.6% rent growth), your $493k cash investment doubles in ~6 years — after that, you're playing with house money.
Negotiation context
- It's been on market 18 days — a 2% lower offer ($1.73M) is reasonable based on typical stale-listing flexibility.
- Current owner paid $1.20M; 47% above their basis — modest negotiation headroom, anchor on the comps not their cost.
Risks & watch-outs
- Watch-outs: built in 1949 — expect roof / HVAC / electrical / plumbing capex.
Questions for the listing agent
- Can we see the unit-by-unit rent roll, current vacancy, and any below-market leases? What's the average tenancy length?
- What capital expenditures (roof, boiler, parking lot, exteriors) have been made in the last 5 years, and what's planned in the next 2?
- Built in 1949 — when were the roof, HVAC, electrical panel, plumbing, and water heater last replaced?
- Is there a deadline driving the sale (1031 exchange, divorce, estate, relocation)? That informs how much negotiation room exists.
- Crime grade is F in this area — have there been break-ins, vandalism, or insurance claims at this property in the last 3 years? What carrier currently insures it and at what premium?
- What's the average days-on-market for RENTAL listings here right now (not sales)? A rising rental-DOM trend means longer vacancies and softer asking-rent achievability than the comps imply.
- What's the recent tenant-quality profile in this submarket — average credit score on applications, eviction rate, late-payment / NSF rate, and stable-employment percentage? A property-management company in the area should have these aggregated.
- How much new apartment / multifamily construction is in the pipeline within 1–3 miles? Heavy new supply (>2% of stock underway) typically softens rents 12–24 months out; light construction supports rent growth.
Investment metrics
- 1% rule
- 1.35% ✓
- Cap rate
- 11.99%
- Cash-on-cash
- 20.33%
- DSCR
- 1.90
- GRM
- 6.2
CMA / ARV
No comps found within radius.
Projected returns pro-forma
-3.0% appreciation · 3.65% rent growth · sell at horizon
- IRR
- 13.2%
- Equity multiple
- 1.53×
- Total profit
- $261,594
- Equity at exit
- $262,422
- IRR
- 22.5%
- Equity multiple
- 2.98×
- Total profit
- $974,795
- Equity at exit
- $152,173
Cash invested: $492,800 (down + closing). Projections, not guarantees.
Landlord ↔ Tenant lean methodology
- Overall (STATE)
- 15 Strongly Tenant-Friendly
- State New York
- 15 Strongly Tenant-Friendly · D+10
- County
- — inherits STATE
- City
- — inherits STATE
ZIP-level market 14216
- Rents YoY
- 3.6%
- Active inventory
- 92
- Price-to-rent
- 98.8×
Monthly cashflow live
- Estimated rent
- $23,763 high interval (Pro) →
- Mortgage (P&I)
- −$9,230
- Tax from tax record
- −$459 /mo · $5,509/yr
- Insurance
- −$733
- HOA
- −$0
- Lot rent
- −$0
- Vacancy / Maint / Mgmt
- −$4,990
- Net cashflow
- $8,351
Break-even live
Sensitivity live
| Price | -10% $9,347 | -5% $8,849 | +0% $8,351 | +5% $7,853 | +10% $7,354 |
|---|---|---|---|---|---|
| Rent | -10% $6,473 | -5% $7,412 | +0% $8,351 | +5% $9,289 | +10% $10,228 |
| Rate | -1.0pp $9,237 | -0.5pp $8,798 | base $8,351 | +0.5pp $7,895 | +1.0pp $7,431 |
16-unit breakdown (identical units grouped — click to expand)
| Units | Beds | Baths | Est. rent |
|---|---|---|---|
| 16× units | 2 | 1 | $23,760 |
| #1 | 2 | 1 | $1,485 |
| #2 | 2 | 1 | $1,485 |
| #3 | 2 | 1 | $1,485 |
| #4 | 2 | 1 | $1,485 |
| #5 | 2 | 1 | $1,485 |
| #6 | 2 | 1 | $1,485 |
| #7 | 2 | 1 | $1,485 |
| #8 | 2 | 1 | $1,485 |
| #9 | 2 | 1 | $1,485 |
| #10 | 2 | 1 | $1,485 |
| #11 | 2 | 1 | $1,485 |
| #12 | 2 | 1 | $1,485 |
| #13 | 2 | 1 | $1,485 |
| #14 | 2 | 1 | $1,485 |
| #15 | 2 | 1 | $1,485 |
| #16 | 2 | 1 | $1,485 |
| Total (16 units) | $23,763 | ||
UW: 25.0% down · 7.5% · 30yr · 1.5% tax · 5.0% vac · 8.0% maint · 8.0% mgmt
Financing live
Cash to close
- Down payment
- $440,000
- Closing costs
- $52,800
- Reserves months
- —
- Total cash needed
- —
Loan-product check · same deal, 3 products live
Conventional
25% down · 7.5% · 30yr
- Down + closing
- —
- Monthly P&I
- —
- Monthly cashflow
- —
- DSCR
- —
- Eligible?
- —
Personal DTI + credit; lowest rate.
DSCR
20% down · 8.5% · 30yr
- Down + closing
- —
- Monthly P&I
- —
- Monthly cashflow
- —
- DSCR
- —
- Eligible?
- —
No personal income docs; deal must DSCR.
Hard money
10% down · 12.0% · 12mo
- Down + closing
- —
- Monthly P&I
- —
- Monthly cashflow
- —
- DSCR
- —
- Eligible?
- —
Short-term bridge; refi at stabilization.
Listing history 5 events
-
2026-04-28status Pending
-
2026-04-10$1,760,000 Active
-
2019-09-30soldstatus $1,200,000
-
2012-05-23soldstatus $672,000
-
1997-03-25soldstatus $720,000
ⓘ Source: listings_history table (triggers on properties + properties_extension) + one-shot
backfill from property_details.listing_events for pre-trigger history.
Tax reassessment forecast NY · Partial reset (capped growth)
- Current annual tax
- $5,509 · $459/mo
- Projected year-2 tax
- $17,627 · $1,469/mo
- Expected delta
- +$12,117/yr (+$1,010/mo · 219.9%)
ⓘ Screening estimate from a state-policy table — verify with the county assessor before closing.
Climate risk First Street
- Flood 1/10 Low FEMA zone X (unshaded) · 0% chance over 30 yrs
- Wildfire 1/10 Low
- Heat 3/10 Moderate 7 d/yr ≥92°F today · 15 d/yr by 30 yrs out
- Wind 1/10 Low
- Air quality 3/10 Moderate 2 unhealthy d/yr today · 3 by 30 yrs out
Nearby sold comps map
Loading sold comps map…
Walkable amenities ~0.75 mi
Loading nearby amenities…
Taxation est. · year 1
- Rental income
- $285,156
- − Mortgage interest
- −$98,587
- − Property taxes
- −$5,509
- − Insurance
- −$8,800
- − Repairs & maintenance
- −$22,812
- − Management
- −$22,812
- − Depreciation
- −$51,200
- Taxable income
- $75,434
- Est. tax owed @ 24.0%
- −$18,104
- After-tax cash flow
- $82,104/yr
For passive investors: Depreciation is non-cash, so a rental often shows a tax loss while cash-flowing — sheltering income. Rental losses are passive: they offset passive income freely, and up to $25,000/yr can offset ordinary (W-2) income if you actively participate and your MAGI is under $100k (phasing out to $0 by $150k); unused losses carry forward. On sale, claimed depreciation is recaptured at up to 25%, and gains may owe capital-gains tax (a 1031 exchange can defer both). Figures are a year-1 estimate at your 24.0% rate — not tax advice; consult a CPA.
Schools (NCES district)
- District
- Buffalo City School District
- NCES district ID
- 3605850
- Math proficiency
- 41% ▲ 11.00%
- Reading proficiency
- 40% ▲ 7.00%
- Median HH income
- $31,665
- Composite
- 33.17/100
- National rank
- #5544
- State rank
- #535 of 590 in NY
Livability — Buffalo
- Score
- 77/100
- State rank
- #195
- US rank
- #3011
Category grades
Schools grade is shown separately in the Schools card above.
Census & demographics
- Census place
- Buffalo, NY
- County
- Erie County · 714,559 people
- City population
- 440,021
- Metro
- Buffalo-Cheektowaga, NY
- Population (ZIP)
- 22,849
- Household income
- $69,629
- Rent vs Own
- Severe rent burden
- 1831.0
Population outlook (Erie County) Hauer SSP2
- Today (2025)
- 933,037 people
- By 2030
- 935,181 · +0.2%
- By 2040
- 928,531 · -0.5%
- By 2050
- 905,725 · -2.9%
- By 2075
- 834,037 · -10.6%
- By 2100
- 708,033 · -24.1%
Race, ethnicity, and origin ACS 2023
- Neighborhood character
- Predominantly White (72%)
- Race & ethnicity
- White 72% Black 16% Hispanic / Latino 7% Two or more races 5% Asian 1%
- Hispanic origin (detail)
- Puerto Rican 5%
- Common ancestry
- Romanian 10% Iranian 2% Lithuanian 1%
- Foreign-born
- 5% · Canada, China
- Languages at home
- 90% English-only · Spanish 5% French/Haitian/Cajun 1% Other Indo-European 1%
Political lean MEDSL · Erie
- 2024 margin
- Lean D (+9.7) · D 54.8% · R 45.2%
- 2008→2024 swing
- -7.9pp toward R · 2008: 17.5pp · 2024: 9.7pp
- All cycles
- 2024: D+9.7 2020: D+14.7 2016: D+4.8 2012: D+15.6 2008: D+17.5
Not yet ingested
- Civics
- —
Market trends
- HPI YoY
- ▼ -264.53%
- Current HPI
- 421.1138
- Rent YoY
- ▲ 3.65%
- Metro
- Buffalo-Cheektowaga, NY
- State GDP YoY
- ▲ 2.60%
- F500 in state
- 92
Industry mix (Fortune 500 HQ in NY)
| Industry | F500 HQs | Revenue |
|---|---|---|
| Financial Services | 10 | $950B |
|
||
| Consumer Goods | 9 | $162B |
|
||
| Insurance | 4 | $225B |
|
||
| Telecommunications | 2 | $144B |
|
||
| Pharmaceuticals | 2 | $112B |
|
||
| Media / Entertainment | 2 | $69B |
|
||
Price history
+144.4% since first listed5 events — show timeline
- 2026-04-28 Pending — WNYREIS
- 2026-04-10 Listed $1,760,000 WNYREIS
- 2019-09-30 Sold (Public Records) $1,200,000 Public Records
- 2012-05-23 Sold (Public Records) $672,000 Public Records
- 1997-03-25 Sold (Public Records) $720,000 Public Records
Property tax history
+7.6%/yrLatest (2025): $5,509 · +0.0% YoY. Source: county tax records.
Cash-flow waterfall
monthlySold comps — $/sqft
last 12 mo · ≤1 miLoading sold comps…