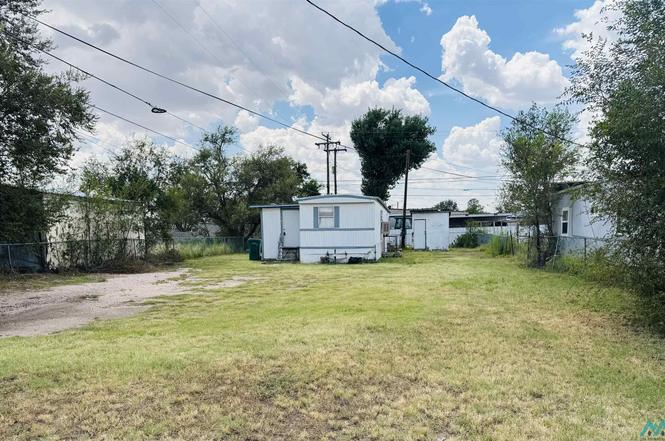
1010 S 5th St · Lovington, NM
Flood risk 1/10 · Minimal
- FEMA flood zone
- X (unshaded)
- Chance of flooding over 30 yrs
- 0.0%
- Est. flood insurance / yr
- $507 – $1,088
Fire risk 10/10 · Severe
- Est. fire insurance / yr
- $706 – $1,312
Heat risk 5/10 · Moderate
- Hot days now (above 99°F)
- 7 days/yr
- Hot days in 30 yrs
- 18 days/yr
Wind risk 2/10 · Minimal
- Chance of severe wind over 30 yrs
- 1.0%
Air-quality risk 1/10 · Minimal
- Unhealthy air days now
- 0 days/yr
- Unhealthy air days in 30 yrs
- 0 days/yr
Risk factors via First Street. Map © Google.
Why this score? — see what drove the B grade
The composite is a weighted blend of 9 inputs, each scored 0–100. Each bar is that input's sub-score; the figure is the points it added to the 100-point composite (weight × sub-score).
- Cash flow +30.0/30.0
- 1% rule +10.0/10.0
- DSCR +10.0/10.0
- ARV discount +7.5/15.0
- Schools +5.0/10.0
- Livability +3.3/5.0
- Rent growth +2.5/5.0
- Condition / age +2.5/5.0
- Appreciation +0.0/10.0
$55,000
🖨 Deal sheet (PDF) 📄 Offer letter ✓ Due diligence
Listing remarks
Spacious lot with mobile home to convey. Call for more details!
Key facts
- Spacious lot
- 7,000 sq ft lot
- Built 1972
Tags
Property features AI
Finance
- Financial info: Annual tax amount listed
Exterior
- Parking: No garage
- Utilities: Public water; Sewer connected; Electricity connected
- Home design: Manufactured home (single wide); Residential property
- Construction: Manufactured structure
- Exterior features: Lot approximately 50 x 140 feet (about 0.16 acres); Public water; Sewer connected; Electricity connected
Interior
- Bathrooms: 1 full bathroom
- Heating & cooling: No heating listed
- Interior features: One full bathroom; No central heating
Neighborhood map
What this means for you Summary
Snapshot
- This is a 2-bed/1.0-bath single-family listed at $55k.
Deal economics
- At list price, monthly cash flow is $613 ($7k/yr) — positive.
- The deal already cash-flows at list — no discount required.
- Meets the 1% rule at list price ($1k rent vs $55k).
- Recommended offer: $48k (12.0% below list) — sets the bar for market timing.
Location & tenants
- Location reads 66/100 on livability (#33 in NM) — a middle-class / working-renter tenant base. Strengths: cost of living A+, housing A+; Watch: crime F, amenities F, commute F.
- Zoned schools: Llano Elementary (325 students, 99% FRL); Taylor Middle (527 students, 99% FRL); Lovington High (math 44% / reading 54%, grade D, #51 of 110 statewide, top 50%, 737 students, 100% FRL).
- Market conditions: 72 active listings in the ZIP; 172 units permitted in Lea County in 2024 (0 in 5+ unit buildings).
Forward outlook
- Local home prices are declining (-3.0%/yr); year-one equity from $380 of loan paydown is wiped out by about $2k of value loss. Plan a longer hold.
- Lea County population projected at +50% by 2050 — long-run rental-demand tailwind backs the buy-and-hold thesis.
- At projected returns (-3.0% appreciation + 3.0% rent growth), your $15k cash investment doubles in ~3 years — after that, you're playing with house money.
Negotiation context
- It's been on market 242 days — a 12% lower offer ($48k) is reasonable based on typical stale-listing flexibility.
- 3 sale attempts; this cycle's ask has dropped $25k (31%) from the opening price — seller is motivated, your offer sets the floor, not the list.
Risks & watch-outs
- Climate carrying-cost: severe wildfire risk; extreme-heat days projected 7→18/yr by 2055 (HVAC capex compounding) — expect insurance premiums to compound above CPI over the hold.
Questions for the listing agent
- It's been on market 242 days. Have you received any prior offers? Is the seller open to a 12% concession, seller financing, or rate buy-down credit?
- Built in 1972 — when were the roof, HVAC, electrical panel, plumbing, and water heater last replaced?
- Why hasn't it sold? Are there any deal-killer items the seller is aware of (foundation, flood, title, zoning, code violations)?
- Is there a deadline driving the sale (1031 exchange, divorce, estate, relocation)? That informs how much negotiation room exists.
- Schools are B-rated — typically a magnet for longer-tenancy family renters. What's the average tenant stay here, and is there a school-zone premium baked into asking?
- Crime grade is F in this area — have there been break-ins, vandalism, or insurance claims at this property in the last 3 years? What carrier currently insures it and at what premium?
- What's the average days-on-market for RENTAL listings here right now (not sales)? A rising rental-DOM trend means longer vacancies and softer asking-rent achievability than the comps imply.
- What's the recent tenant-quality profile in this submarket — average credit score on applications, eviction rate, late-payment / NSF rate, and stable-employment percentage? A property-management company in the area should have these aggregated.
- How much new for-sale + rental construction is in the pipeline within 1–3 miles? Heavy new supply typically softens prices + rents 12–24 months out; constrained supply supports both.
Investment metrics
- 1% rule
- 2.29% ✓
- Cap rate
- 19.66%
- Cash-on-cash
- 47.75%
- DSCR
- 3.12
- GRM
- 3.6
CMA / ARV
No comps found within radius.
Projected returns pro-forma
-3.0% appreciation · 3.0% rent growth · sell at horizon
- IRR
- 45.2%
- Equity multiple
- 2.96×
- Total profit
- $30,136
- Equity at exit
- $8,201
- IRR
- 51.1%
- Equity multiple
- 5.97×
- Total profit
- $76,575
- Equity at exit
- $4,755
Cash invested: $15,400 (down + closing). Projections, not guarantees.
Landlord ↔ Tenant lean methodology
- Overall (STATE)
- 55 Moderately Landlord-Leaning
- State New Mexico
- 55 Moderately Landlord-Leaning · D+3
- County
- — inherits STATE
- City
- — inherits STATE
ZIP-level market 88260
- Active inventory
- 72
- Price-to-rent
- 3.6×
Monthly cashflow live
- Estimated rent
- $1,257 medium interval (Pro) →
- Mortgage (P&I)
- −$288
- Tax est. 1.5%
- −$69 /mo · $825/yr
- Insurance
- −$23
- HOA
- −$0
- Vacancy / Maint / Mgmt
- −$264
- Net cashflow
- $613
Break-even live
Sensitivity live
| Price | -10% $651 | -5% $632 | +0% $613 | +5% $594 | +10% $575 |
|---|---|---|---|---|---|
| Rent | -10% $514 | -5% $563 | +0% $613 | +5% $662 | +10% $712 |
| Rate | -1.0pp $640 | -0.5pp $627 | base $613 | +0.5pp $599 | +1.0pp $584 |
UW: 25.0% down · 7.5% · 30yr · 1.5% tax · 5.0% vac · 8.0% maint · 8.0% mgmt
Financing live
Cash to close
- Down payment
- $13,750
- Closing costs
- $1,650
- Reserves months
- —
- Total cash needed
- —
Loan-product check · same deal, 3 products live
Conventional
25% down · 7.5% · 30yr
- Down + closing
- —
- Monthly P&I
- —
- Monthly cashflow
- —
- DSCR
- —
- Eligible?
- —
Personal DTI + credit; lowest rate.
DSCR
20% down · 8.5% · 30yr
- Down + closing
- —
- Monthly P&I
- —
- Monthly cashflow
- —
- DSCR
- —
- Eligible?
- —
No personal income docs; deal must DSCR.
Hard money
10% down · 12.0% · 12mo
- Down + closing
- —
- Monthly P&I
- —
- Monthly cashflow
- —
- DSCR
- —
- Eligible?
- —
Short-term bridge; refi at stabilization.
Listing history 9 events
-
2026-05-10status Pending
-
2026-04-27status Active
-
2026-04-09status Pending
-
2026-02-13status Active
-
2026-02-13price $55,000
-
2026-02-10historical
-
2025-12-12price $60,000
-
2025-08-20$80,000 Active
-
1993-09-03soldstatus
ⓘ Source: listings_history table (triggers on properties + properties_extension) + one-shot
backfill from property_details.listing_events for pre-trigger history.
Climate risk First Street
- Flood 1/10 Low FEMA zone X (unshaded) · 0% chance over 30 yrs
- Wildfire 10/10 Extreme
- Heat 5/10 Major 7 d/yr ≥99°F today · 18 d/yr by 30 yrs out
- Wind 2/10 Low 100% chance of damaging wind over 30 yrs
- Air quality 1/10 Low 0 unhealthy d/yr today · 0 by 30 yrs out
Nearby sold comps map
Loading sold comps map…
Walkable amenities ~0.75 mi
Loading nearby amenities…
Taxation est. · year 1
- Rental income
- $15,082
- − Mortgage interest
- −$3,081
- − Property taxes
- −$825
- − Insurance
- −$275
- − Repairs & maintenance
- −$1,207
- − Management
- −$1,207
- − Depreciation
- −$1,600
- Taxable income
- $6,888
- Est. tax owed @ 24.0%
- −$1,653
- After-tax cash flow
- $5,700/yr
For passive investors: Depreciation is non-cash, so a rental often shows a tax loss while cash-flowing — sheltering income. Rental losses are passive: they offset passive income freely, and up to $25,000/yr can offset ordinary (W-2) income if you actively participate and your MAGI is under $100k (phasing out to $0 by $150k); unused losses carry forward. On sale, claimed depreciation is recaptured at up to 25%, and gains may owe capital-gains tax (a 1031 exchange can defer both). Figures are a year-1 estimate at your 24.0% rate — not tax advice; consult a CPA.
Schools (NCES district)
No district data.
Livability — Lovington
- Score
- 66/100
- State rank
- #33
- US rank
- #11541
Category grades
Schools grade is shown separately in the Schools card above.
Census & demographics
- Census place
- Lovington, NM
- Population (ZIP)
- 15,410
Population outlook (Lea County) Hauer SSP2
- Today (2025)
- 84,268 people
- By 2030
- 91,695 · +8.8%
- By 2040
- 108,366 · +28.6%
- By 2050
- 126,264 · +49.8%
- By 2075
- 170,606 · +102.5%
- By 2100
- 199,235 · +136.4%
Race, ethnicity, and origin ACS 2023
- Neighborhood character
- Predominantly Hispanic (66%)
- Race & ethnicity
- Hispanic / Latino 66% White 31% Two or more races 26% Black 2%
- Hispanic origin (detail)
- Mexican 63%
- Common ancestry
- Lithuanian 1% Portuguese 1% Serbian 1%
- Foreign-born
- 21% · Canada
- Languages at home
- 51% English-only · Spanish 49%
Political lean MEDSL · Lea
- 2024 margin
- Solid R (+61.6) · D 18.5% · R 80.1% · Other 1.3%
- 2008→2024 swing
- -17.4pp toward R · 2008: -44.2pp · 2024: -61.6pp
- All cycles
- 2024: R+61.6 2020: R+59.6 2016: R+48.5 2012: R+49.7 2008: R+44.2
Not yet ingested
- Civics
- —
Market trends
- HPI YoY
- ▼ -124.50%
- Current HPI
- 92.2391
- Rent YoY
- —
- Metro
- —
- State GDP YoY
- —
- F500 in state
- 0
Price history
-31.2% since first listed9 events — show timeline
- 2026-05-10 Pending — NMMLS
- 2026-04-27 Relisted — NMMLS
- 2026-04-09 Pending — NMMLS
- 2026-02-13 Relisted — NMMLS
- 2026-02-13 Price Changed $55,000 NMMLS
- 2026-02-10 Delisted — NMMLS
- 2025-12-12 Price Changed $60,000 NMMLS
- 2025-08-20 Listed $80,000 NMMLS
- 1993-09-03 Sold (Public Records) — Public Records
Property tax history
+3.4%/yrLatest (2025): $52 · +0.8% YoY. Source: county tax records.
Cash-flow waterfall
monthlySold comps — $/sqft
last 12 mo · ≤1 miLoading sold comps…