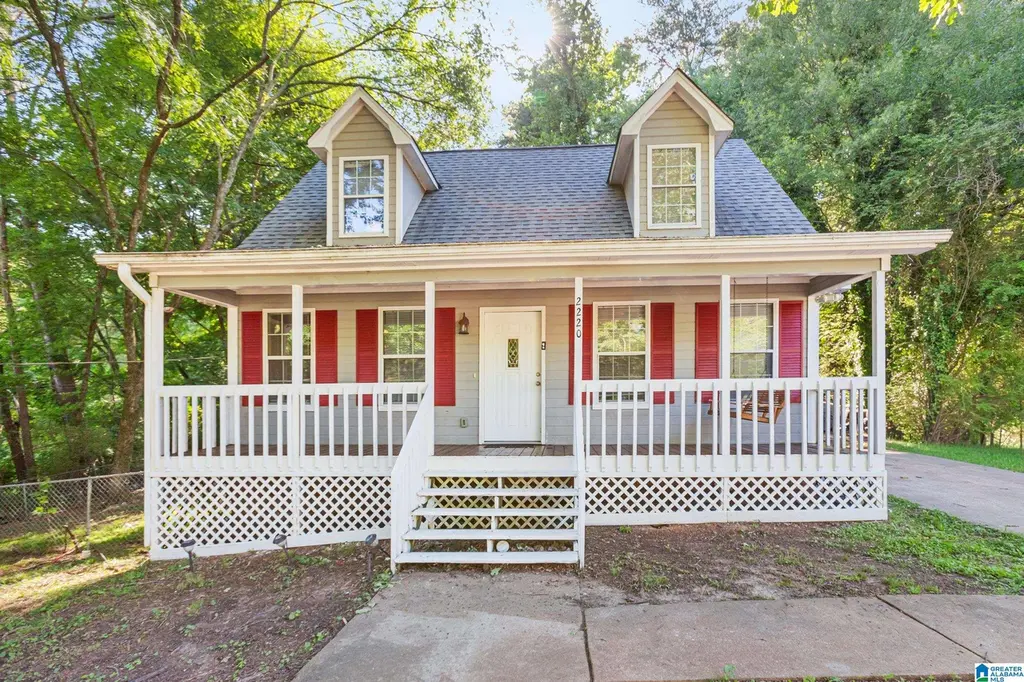
2220 Reed Rd · Center Point, AL
Flood risk 1/10 · Minimal
- FEMA flood zone
- X (unshaded)
- Chance of flooding over 30 yrs
- 0.0%
- Est. flood insurance / yr
- $507 – $1,088
Fire risk 3/10 · Minor
- Est. fire insurance / yr
- $916 – $1,700
Heat risk 5/10 · Moderate
- Hot days now (above 105°F)
- 7 days/yr
- Hot days in 30 yrs
- 17 days/yr
Wind risk 6/10 · Moderate
- Chance of severe wind over 30 yrs
- 27.0%
Air-quality risk 5/10 · Moderate
- Unhealthy air days now
- 7 days/yr
- Unhealthy air days in 30 yrs
- 9 days/yr
Risk factors via First Street. Map © Google.
Why this score? — see what drove the D+ grade
The composite is a weighted blend of 9 inputs, each scored 0–100. Each bar is that input's sub-score; the figure is the points it added to the 100-point composite (weight × sub-score).
- ARV discount +15.0/15.0
- Cash flow +14.5/30.0
- DSCR +4.4/10.0
- Rent growth +3.3/5.0
- Livability +3.2/5.0
- 1% rule +2.9/10.0
- Condition / age +2.5/5.0
- Schools +1.8/10.0
- Appreciation +0.0/10.0
$180,000
🖨 Deal sheet 📄 Offer letter ✓ Due diligence
Listing remarks MLS
Adorable 3 bedroom, 2 bath home nestled in the Centerwood Subdivision. Spend your mornings swinging on the covered front porch. Host weekend BBQ’s in the spacious, fenced in, backyard w/ open deck & custom made bench. Use the large shed for storage or a workshop. First floor totally renovated in 2014 & Trane HVAC installed in 2016. Appliances are stainless steel, including new, fingerprint resistant dishwasher & over-the-range microwave. Charming dining nook w/ tray ceiling. New roof to both the house & shed were recently installed. This home won’t last long! Only thing missing, is you!
Key facts
- Covered porch
- Spacious yard
- Front porch
Tags
Property features AI
Exterior
- Parking: Attached parking; Driveway parking; 2-space carport
- Utilities: Underground utilities; Public water; Septic system; Electric water heater; Internet service available
- Home design: Existing construction; Siding (wood); Crawl space foundation
- Construction: Wood siding
- Exterior features: Fenced yard; Storage building; Workshop (exterior); Open patio; Open deck
Interior
- Kitchen: Laminate countertops; Convection oven; Electric cooktop; Built-in dishwasher
- Bedrooms: Master bedroom on main level; Additional bedrooms on upper level
- Flooring: Carpet; Hardwood laminate
- Bathrooms: 2 full bathrooms; Separate vanities; Shared bath; Tub/shower combo; Linen closet; Split bedrooms
- Heating & cooling: Electric heating; Electric cooling
- Interior features: Trey ceilings; Workshop (exterior)
- Laundry & utility: Washer hookup; Electric dryer hookup; Laundry closet on main level; Pull-down attic
Neighborhood map
What this means for you Summary
Snapshot
- This is a 3-bed/2.0-bath single-family listed at $180k.
Deal economics
- At list price, monthly cash flow is $41 ($489/yr) — positive.
- The deal already cash-flows at list — no discount required.
- To meet the 1% rule (rent ≥ 1% of price), the offer needs to be $142k (21.3% below list).
- Recommended offer: $142k (21.3% below list) — sets the bar for 1% rule.
Location & tenants
- Location reads 63/100 on livability (#193 in AL) — a middle-class / working-renter tenant base. Strengths: cost of living A+, commute A, housing A; Watch: crime D, amenities F, employment F.
- Jefferson County (suburban): math 9% / reading 32% proficiency, ranked #104 of 129 in AL (top 81%) — low school quality limits family demand, transient renter base, plan for 1-2y turnover.
- Zoned schools: Chalkville Elementary School (math 6% / reading 16%, grade F, #560 of 627 statewide, top 90%, 854 students, 79% FRL); Claychalkville High School (math 6% / reading 9%, grade F, #261 of 305 statewide, top 87%, 1,361 students, 56% FRL) — zoned schools average 67% FRL vs 49% district-wide (19 pts higher); higher-poverty schools than district average — tighter screening recommended.
- Market conditions: Rents rising (+3.0%/yr); 334 active listings in the ZIP; 40 comparable units currently listed for rent nearby; rentals lingering (median 44d on market — plan ~5-8 weeks vacancy on turnover, expect pricing pressure); 50% of comp listings sitting > 30 days — soft ceiling on asking rent; 2,114 units permitted in Jefferson County in 2024 (556 in 5+ unit buildings).
- This rent runs 32% of the median local income ($53k/yr) — at the standard rent-burdened threshold; future hikes will face affordability resistance.
Forward outlook
- Local home prices are declining (-3.0%/yr); year-one equity from $1k of loan paydown is wiped out by about $5k of value loss. Plan a longer hold.
- Jefferson County population projected to shrink 4% by 2050 — rents likely to lag national; underwrite the cash flow, not the appreciation.
Negotiation context
- Only 13 days on market — expect competitive offers; lowballing is unlikely to land.
- 3 sale attempts since 5y ago with the ask held roughly flat each time — persistent listings suggest the price (not the market) is what's stuck; bring a comps-based counter.
Risks & watch-outs
- Climate carrying-cost: major wind risk, 27% chance of damaging wind over 30y; extreme-heat days projected 7→17/yr by 2055 (HVAC capex compounding) — expect insurance premiums to compound above CPI over the hold.
Questions for the listing agent
- Is there a deadline driving the sale (1031 exchange, divorce, estate, relocation)? That informs how much negotiation room exists.
- Schools are F-rated, which usually means shorter tenancies and higher turnover. Who's the typical renter profile here, and what's been the actual vacancy rate?
- Crime grade is D in this area — have there been break-ins, vandalism, or insurance claims at this property in the last 3 years? What carrier currently insures it and at what premium?
- The area grade is low — what's the realistic commute time and amenity access for the typical tenant pool here? Any planned neighborhood developments (good or bad) we should know about?
- What's the average days-on-market for RENTAL listings here right now (not sales)? A rising rental-DOM trend means longer vacancies and softer asking-rent achievability than the comps imply.
- What's the recent tenant-quality profile in this submarket — average credit score on applications, eviction rate, late-payment / NSF rate, and stable-employment percentage? A property-management company in the area should have these aggregated.
- How much new for-sale + rental construction is in the pipeline within 1–3 miles? Heavy new supply typically softens prices + rents 12–24 months out; constrained supply supports both.
Investment metrics
- 1% rule
- 0.79% ✗
- Cap rate
- 6.56%
- Cash-on-cash
- 0.97%
- DSCR
- 1.04
- GRM
- 10.6
CMA / ARV
- ARV (on-the-fly)
- $219,660
- Comps found
- 12
Show comp detail 12 sales within ~0.75 mi
| Address | Dist | Beds/Ba | Sqft | Sold | Price | $/sf | Match |
|---|---|---|---|---|---|---|---|
| 2212 Shirley Dr | 0.06mi | 3/2.0 | 1,518 (-3%) | 5mo | $199,900 | $132 | 87 |
| 550 Samantha Cir | 0.48mi | 3/2.0 | 1,455 (-7%) | 1mo | $215,000 | $148 | 64 |
| 700 Gable Dr | 0.70mi | 3/2.0 | 1,596 (+2%) | 2mo | $245,000 | $154 | 63 |
| 2532 5th St NE | 0.74mi | 3/2.0 | 1,560 (-1%) | 3mo | $190,000 | $122 | 62 |
| 668 20th Ct NE | 0.31mi | 4/3.0 (+1) | 1,675 (+7%) | 5mo | $230,000 | $137 | 61 |
| 2304 Applewood Dr | 0.36mi | 3/2.0 | 1,742 (+11%) | 7mo | $255,000 | $146 | 59 |
| 2316 3rd Way NE | 0.65mi | 3/2.0 | 1,665 (+6%) | 5mo | $182,000 | $109 | 55 |
| 4558 Cantebury Ln | 0.67mi | 3/2.0 | 1,470 (-6%) | 4mo | $244,900 | $167 | 55 |
| 2236 2nd Pl NE | 0.74mi | 3/2.0 | 1,392 (-11%) | 3mo | $195,000 | $140 | 45 |
| 1149 Westridge Cir | 0.74mi | 3/2.0 | 1,365 (-13%) | 1mo | $238,000 | $174 | 43 |
| 5540 Matt Aaron Ln | 0.70mi | 2/2.0 (-1) | 1,761 (+12%) | 4mo | $190,000 | $108 | 38 |
| 2529 5th St | 0.70mi | 4/2.0 (+1) | 1,766 (+13%) | 4mo | $215,000 | $122 | 38 |
Match score weights: distance 35% · size 25% · config 20% · recency 20%. Top-matched comps best support the ARV.
Projected returns pro-forma
-3.0% appreciation · 3.04% rent growth · sell at horizon
- IRR
- -14.8%
- Equity multiple
- 0.47×
- Total profit
- $-26,597
- Equity at exit
- $26,839
- IRR
- -6.1%
- Equity multiple
- 0.60×
- Total profit
- $-19,912
- Equity at exit
- $15,563
Cash invested: $50,400 (down + closing). Projections, not guarantees.
Landlord ↔ Tenant lean methodology
- Overall (STATE)
- 90 Strongly Landlord-Friendly
- State Alabama
- 90 Strongly Landlord-Friendly · R+15
- County
- — inherits STATE
- City
- — inherits STATE
ZIP-level market 35215
- Home prices YoY
- -34.4%
- Rents YoY
- 3.0%
- Active inventory
- 334
- Price-to-rent
- 10.6×
Monthly cashflow live
- Estimated rent
- $1,416 high interval (Pro) →
- Mortgage (P&I)
- −$944
- Tax from tax record
- −$59 /mo · $712/yr
- Insurance
- −$75
- HOA
- −$0
- Vacancy / Maint / Mgmt
- −$297
- Net cashflow
- $41
Break-even live
UW: 25.0% down · 7.5% · 30yr · 1.5% tax · 5.0% vac · 8.0% maint · 8.0% mgmt
Financing live
Cash to close
- Down payment
- $45,000
- Closing costs
- $5,400
- Reserves months
- —
- Total cash needed
- —
Loan-product check · same deal, 3 products live
Conventional
25% down · 7.5% · 30yr
- Down + closing
- —
- Monthly P&I
- —
- Monthly cashflow
- —
- DSCR
- —
- Eligible?
- —
Personal DTI + credit; lowest rate.
DSCR
20% down · 8.5% · 30yr
- Down + closing
- —
- Monthly P&I
- —
- Monthly cashflow
- —
- DSCR
- —
- Eligible?
- —
No personal income docs; deal must DSCR.
Hard money
10% down · 12.0% · 12mo
- Down + closing
- —
- Monthly P&I
- —
- Monthly cashflow
- —
- DSCR
- —
- Eligible?
- —
Short-term bridge; refi at stabilization.
Rent comps 40 comps
| Address | Beds | Baths | Sqft | Rent | $/sqft | DOM | Units | Dist |
|---|---|---|---|---|---|---|---|---|
| 600 20th Ct NE Center Point, AL | 3.0 | 2.0 | 1878 | $1,650 | $0.88 | 23d | 1 | 0.12mi |
| 2232 6th St NE Center Point, AL | 3.0 | 1.0 | 1550 | $1,150 | $0.74 | 43d | 1 | 0.17mi |
| 856 Parkbrook Trl Birmingham, AL | 1.0–3.0 | 1.0–2.0 | 925 | $1,180 | $1.28 | 2d | 10 | 0.18mi |
| 2249 4th Place Cir NE Center Point, AL | 3.0 | 1.5 | 1400 | $1,400 | $1.00 | 43d | 1 | 0.31mi |
| 413 20th Ct NE Center Point, AL | 3.0 | 1.5 | 1540 | $1,375 | $0.89 | 43d | 1 | 0.32mi |
| 332 23rd Ave NE Center Point, AL | 3.0 | 1.0 | 1100 | $1,350 | $1.23 | 3d | 1 | 0.52mi |
| 1935 Springlake Ct Unit 1 Birmingham, AL | 2.0 | 1.5 | 1152 | $1,095 | $0.95 | 43d | 1 | 0.54mi |
| 2415 Ormond Dr Center Point, AL | 3.0 | 1.5 | 1194 | $1,295 | $1.08 | 43d | 1 | 0.62mi |
| 1845 Stonehenge Dr Birmingham, AL | 3.0 | 2.0 | 1358 | $1,323 | $0.97 | 14d | 1 | 0.62mi |
| 2229 3rd St NE Center Point, AL | 3.0 | 1.0 | 1215 | $1,125 | $0.93 | 23d | 1 | 0.64mi |
| 2245 3rd St NE Center Point, AL | 3.0 | 1.0 | 1150 | $1,100 | $0.96 | 23d | 1 | 0.65mi |
| 2324 3rd St NE Center Point, AL | 3.0 | 2.0 | 1329 | $1,300 | $0.98 | 23d | 1 | 0.74mi |
| 1819 Valley Run Cir Birmingham, AL | 4.0 | 2.5 | 1694 | $1,761 | $1.04 | 43d | 1 | 0.75mi |
| 2708 7th St NE Center Point, AL | 3.0 | 1.0 | 1451 | $1,150 | $0.79 | 43d | 1 | 0.78mi |
| 1817 Lyle Dr Birmingham, AL | 4.0 | 2.0 | 1361 | $1,605 | $1.18 | 23d | 1 | 0.83mi |
| 1761 Big Mountain Dr Birmingham, AL | 4.0 | 2.0 | 1632 | $1,575 | $0.97 | 44d | 1 | 0.93mi |
| 607 Country View Dr Birmingham, AL | 4.0 | 2.0 | 1568 | $1,550 | $0.99 | 23d | 1 | 0.99mi |
| 605 Country View Dr Birmingham, AL | 3.0 | 2.0 | 1698 | $1,560 | $0.92 | 43d | 1 | 1.00mi |
| 2655 6th St NE Center Point, AL | 3.0 | 2.0 | 1600 | $1,390 | $0.87 | 3d | 1 | 1.00mi |
| 2025 Brewster Rd Birmingham, AL | 3.0 | 2.0 | 1369 | $1,450 | $1.06 | 23d | 1 | 1.02mi |
| 1830 Christian St Birmingham, AL | 3.0 | 2.0 | 1468 | $1,375 | $0.94 | 3d | 1 | 1.05mi |
| 2629 Wood Dr NE Center Point, AL | 3.0 | 1.0 | 1203 | $1,250 | $1.04 | 43d | 1 | 1.06mi |
| 1720 2nd St NE Center Point, AL | 3.0 | 2.0 | 1100 | $1,400 | $1.27 | 43d | 1 | 1.08mi |
| 1700 Serene Dr Birmingham, AL | 4.0 | 1.5 | 1543 | $1,630 | $1.06 | 2d | 1 | 1.08mi |
| 5240 Jean Dr Pinson, AL | 4.0 | 2.0 | 1714 | $1,695 | $0.99 | 43d | 1 | 1.17mi |
| 1748 Sonia Dr Birmingham, AL | 4.0 | 2.0 | 1401 | $1,395 | $1.00 | 43d | 1 | 1.20mi |
| 5010 Darlene Dr Pinson, AL | 3.0 | 2.0 | 1914 | $1,550 | $0.81 | 23d | 1 | 1.20mi |
| 107 Sterling Ct NW Center Point, AL | 2.0 | 1.5–2.0 | 1026 | $1,062 | $1.04 | 3d | 4 | 1.20mi |
| 1760 Sonia Dr Birmingham, AL | 3.0 | 2.0 | 1550 | $1,635 | $1.05 | 1d | 1 | 1.24mi |
| 1808 Brewster Rd Birmingham, AL | 4.0 | 2.0 | 1548 | $1,515 | $0.98 | 43d | 1 | 1.25mi |
| 113 19th Ave NW Center Point, AL | 3.0 | 2.0 | 1407 | $1,250 | $0.89 | 11d | 1 | 1.26mi |
| 1905 2nd St NW Center Point, AL | 3.0 | 1.0 | 1258 | $1,395 | $1.11 | 43d | 1 | 1.29mi |
| 213 Meadwood Dr NE Center Point, AL | 3.0 | 1.0 | 1194 | $995 | $0.83 | 43d | 1 | 1.30mi |
| 127 Fox Hill Ct Center Point, AL | 3.0 | 2.0 | 1418 | $1,545 | $1.09 | 43d | 1 | 1.36mi |
| 1868 Carraway St Birmingham, AL | 3.0 | 2.0 | 1819 | $1,500 | $0.82 | 23d | 1 | 1.37mi |
| 5140 Hickory Dr NE Pinson, AL | 3.0 | 1.5 | 1518 | $1,465 | $0.97 | 21d | 1 | 1.38mi |
| 3309 Chase Ln Unit 3309 Birmingham, AL | 2.0 | 2.0 | 1068 | $1,000 | $0.94 | 43d | 1 | 1.40mi |
| 2245 3rd St NW Center Point, AL | 3.0 | 1.0 | 1156 | $1,100 | $0.95 | 23d | 1 | 1.42mi |
| 1628 1st St NW Center Point, AL | 3.0 | 1.0 | 1124 | $1,150 | $1.02 | 43d | 1 | 1.43mi |
| 305 18th Ct NW Center Point, AL | 3.0 | 1.5 | 1270 | $1,100 | $0.87 | 43d | 1 | 1.44mi |
Listing history 10 events
-
2026-06-18days on market $180,000 Active 13 DOM
-
2026-06-17days on market $180,000 Active 12 DOM
-
2026-06-16days on market $180,000 Active 11 DOM
-
2026-06-15days on market $180,000 Active 10 DOM
-
2026-06-13days on market $180,000 Active 8 DOM
-
2026-06-10days on market $180,000 Active 5 DOM
-
2026-06-09days on market $180,000 Active 4 DOM
-
2026-06-08days on market $180,000 Active 3 DOM
-
2026-06-07remarks 638-char remark
-
2026-06-07$180,000 Active 2 DOM
ⓘ Source: listings_history table (triggers on properties + properties_extension) + one-shot
backfill from property_details.listing_events for pre-trigger history.
Tax reassessment forecast AL · Resets to sale price
- Current annual tax
- $712 · $59/mo
- Projected year-2 tax
- $738 · $62/mo
- Expected delta
- +$26/yr (+$2/mo · 3.7%)
ⓘ Screening estimate from a state-policy table — verify with the county assessor before closing.
Climate risk First Street
- Flood 1/10 Low FEMA zone X (unshaded) · 0% chance over 30 yrs
- Wildfire 3/10 Moderate
- Heat 5/10 Major 7 d/yr ≥105°F today · 17 d/yr by 30 yrs out
- Wind 6/10 Major 27% chance of damaging wind over 30 yrs
- Air quality 5/10 Major 7 unhealthy d/yr today · 9 by 30 yrs out
Nearby sold comps map
Loading sold comps map…
Walkable amenities ~0.75 mi
Loading nearby amenities…
Taxation est. · year 1
- Rental income
- $16,997
- − Mortgage interest
- −$10,083
- − Property taxes
- −$712
- − Insurance
- −$900
- − Repairs & maintenance
- −$1,360
- − Management
- −$1,360
- − Depreciation
- −$5,236
- Taxable loss
- −$2,653
- Est. tax savings @ 24.0%
- +$637
- After-tax cash flow
- $1,126/yr
For passive investors: Depreciation is non-cash, so a rental often shows a tax loss while cash-flowing — sheltering income. Rental losses are passive: they offset passive income freely, and up to $25,000/yr can offset ordinary (W-2) income if you actively participate and your MAGI is under $100k (phasing out to $0 by $150k); unused losses carry forward. On sale, claimed depreciation is recaptured at up to 25%, and gains may owe capital-gains tax (a 1031 exchange can defer both). Figures are a year-1 estimate at your 24.0% rate — not tax advice; consult a CPA.
Schools (NCES district)
- District
- Jefferson County
- NCES district ID
- 0101920
- Math proficiency
- 9% ▼ -24.00%
- Reading proficiency
- 32% ▼ -5.00%
- Median HH income
- $51,712
- Composite
- 18.4/100
- National rank
- #8937
- State rank
- #104 of 129 in AL
Livability — Center Point
- Score
- 63/100
- State rank
- #193
- US rank
- #15671
Category grades
Schools grade is shown separately in the Schools card above.
Census & demographics
- Census place
- Center Point, AL
- County
- Jefferson County · 527,445 people
- City population
- 210,422
- Metro
- Birmingham-Hoover, AL
- Population (ZIP)
- 43,903
- Household income
- $52,793
- Rent vs Own
- Severe rent burden
- 1729.0
Population outlook (Jefferson County) Hauer SSP2
- Today (2025)
- 669,185 people
- By 2030
- 669,694 · +0.1%
- By 2040
- 661,388 · -1.2%
- By 2050
- 643,086 · -3.9%
- By 2075
- 577,267 · -13.7%
- By 2100
- 474,758 · -29.1%
Race, ethnicity, and origin ACS 2023
- Neighborhood character
- Predominantly Black (75%)
- Race & ethnicity
- Black 75% White 15% Hispanic / Latino 7% Two or more races 3%
- Hispanic origin (detail)
- Mexican 4%
- Common ancestry
- Lithuanian 1% Italian 1% Slovak 1%
- Foreign-born
- 4% · Canada
- Languages at home
- 92% English-only · Spanish 7%
Political lean MEDSL · Jefferson
- 2024 margin
- D (+10.4) · D 54.6% · R 44.2% · Other 1.2%
- 2008→2024 swing
- +5.4pp toward D · 2008: 5.1pp · 2024: 10.4pp
- All cycles
- 2024: D+10.4 2020: D+13.2 2016: D+7.2 2012: D+6.0 2008: D+5.1
Not yet ingested
- Civics
- —
Market trends
- HPI YoY
- ▼ -112.97%
- Current HPI
- 215.0607
- Rent YoY
- ▲ 3.04%
- Metro
- Birmingham-Hoover, AL
- State GDP YoY
- ▲ 2.94%
- F500 in state
- 4
Industry mix (Fortune 500 HQ in AL)
| Industry | F500 HQs | Revenue |
|---|---|---|
| Financial Services | 1 | $8B |
|
||
| Healthcare | 1 | $5B |
|
||
Price history
+164.7% since first listed12 events — show timeline
- 2026-06-05 Listed $180,000 Greater Alabama MLS
- 2021-07-01 Sold (Public Records) $157,000 Public Records
- 2021-06-30 Sold (MLS) $157,000 Greater Alabama MLS
- 2021-06-24 Contingent — Greater Alabama MLS
- 2021-06-22 Price Changed $155,900 Greater Alabama MLS
- 2021-06-22 Relisted — Greater Alabama MLS
- 2021-04-02 Contingent — Greater Alabama MLS
- 2021-04-01 Listed $155,000 Greater Alabama MLS
- 2021-03-29 Coming Soon $155,000 Greater Alabama MLS
- 2003-04-03 Sold (Public Records) $94,000 Public Records
- 1997-06-04 Sold (Public Records) $75,000 Public Records
- 1994-12-08 Sold (Public Records) $68,000 Public Records
Property tax history
+6.4%/yrLatest (2025): $712 · +7.5% YoY. Source: county tax records.
Cash-flow waterfall
monthlySold comps — $/sqft
last 12 mo · ≤1 miLoading sold comps…