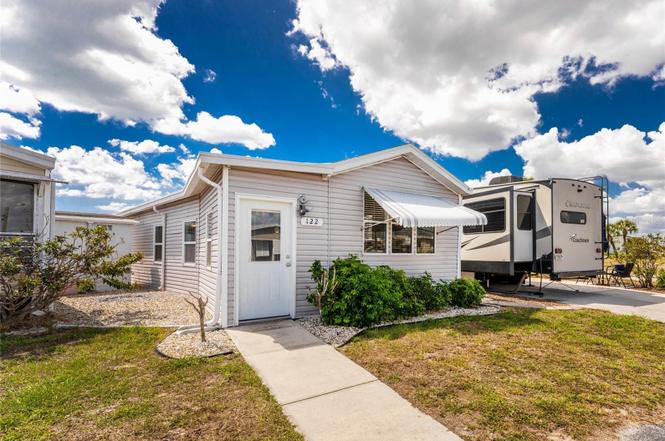
1475 Flamingo Dr #122 · Englewood, FL
Flood risk 7/10 · Major
- FEMA flood zone
- X (shaded)
- Chance of flooding over 30 yrs
- 0.95%
- Est. flood insurance / yr
- $507 – $1,088
Fire risk 5/10 · Moderate
- Est. fire insurance / yr
- $947 – $1,759
Heat risk 10/10 · Severe
- Hot days now (above 107°F)
- 7 days/yr
- Hot days in 30 yrs
- 29 days/yr
Wind risk 10/10 · Severe
- Chance of severe wind over 30 yrs
- 99.0%
Air-quality risk 2/10 · Minimal
- Unhealthy air days now
- 1 days/yr
- Unhealthy air days in 30 yrs
- 1 days/yr
Risk factors via First Street. Map © Google.
Why this score? — see what drove the B grade
The composite is a weighted blend of 9 inputs, each scored 0–100. Each bar is that input's sub-score; the figure is the points it added to the 100-point composite (weight × sub-score).
- Cash flow +30.0/30.0
- 1% rule +10.0/10.0
- DSCR +10.0/10.0
- ARV discount +7.5/15.0
- Schools +4.6/10.0
- Livability +3.7/5.0
- Rent growth +2.5/5.0
- Condition / age +2.5/5.0
- Appreciation +0.0/10.0
$69,900
🖨 Deal sheet (PDF) 📄 Offer letter ✓ Due diligence
Listing remarks MLS
Great location with lots of activities. - large vinyl enclosed lanai with inside utility room (lanai has various lengths & widths). Unit has been recently painted inside. Must see to appreciate.
Key facts
- Gated community
- Rear parking pad
- Private boat ramp
Tags
Property features AI
Finance
- Other: Unfurnished; Third-party listing
- Financial info: Total annual fees: $1,680; Lease restrictions apply
- HOA & community: Located in Holiday Travel Park (association: Holiday Travel Park/Peter Rivera) with buyer approval required; Monthly association fee: $140 (includes pool, grounds maintenance, management, pest control, private road, recreational facilities, sewer, trash, water); Community amenities include clubhouse, pool, recreation facilities, shuffleboard court, community mailbox; Senior community; pets allowed (max ~40 lbs); Deed restrictions; golf carts allowed
Exterior
- Parking: Private paved access; Private maintained road
- Utilities: Public water; Public sewer; Electricity available and connected; Cable available; Broadband/high-speed internet available; Water and sewer available/connected
- Home design: Manufactured home (double wide); One story; East-facing
- Construction: Vinyl siding; Metal and shingle roof; Crawlspace and slab foundation; Built in 1 structure totaling building area per public records
- Exterior features: Exterior lighting; Rain gutters; Outdoor storage / shed(s); Private boat ramp (canal access); In-ground heated gunite pool
Interior
- Kitchen: Range; Microwave; Refrigerator; Solid surface counters
- Bedrooms: 1 bedroom
- Flooring: Laminate; Tile
- Bathrooms: 1 full bathroom
- Heating & cooling: Central heating (electric); Central air conditioning
- Interior features: Built-in features; Ceiling fans; Solid surface counters; Thermostat; Vaulted ceilings; Window treatments (blinds, drapes)
- Laundry & utility: Washer; Dryer; Inside laundry in a laundry closet; Inside utility
Neighborhood map
What this means for you Summary
Snapshot
- This is a 2-bed/2.0-bath land listed at $70k.
Deal economics
- At list price, monthly cash flow is $374 ($4k/yr) — positive.
- The deal already cash-flows at list — no discount required.
- Meets the 1% rule at list price ($1k rent vs $70k).
- Recommended offer: $64k (9.0% below list) — sets the bar for market timing.
- Cap rate 13.9% vs local median 3.8% in Englewood — top-decile yield for the area; either an underpriced asset or a hidden risk that comps aren't pricing in. Stress-test before assuming the spread holds.
Location & tenants
- Location reads 73/100 on livability (#321 in FL) — a middle-class / working-renter tenant base. Strengths: housing A+, cost of living A, health & safety A; Watch: employment C-, amenities F, commute F.
- Charlotte (suburban): math 54% / reading 54% proficiency, ranked #22 of 73 in FL (top 30%) — acceptable for families but not a draw, mixed tenant base, ~2y average lease.
- Zoned schools: Vineland Elementary School (math 74% / reading 67%, grade A-, #333 of 2,144 statewide, top 16%, 579 students, 45% FRL); Lemon Bay High School (math 50% / reading 56%, grade C-, #148 of 667 statewide, top 23%, 1,360 students, 28% FRL) — zoned schools average 37% FRL vs 54% district-wide (17 pts lower); this property's tenant base skews higher-income than the district average.
- Market conditions: Rents soft (-0.1%/yr); 734 active listings in the ZIP; 4,585 units permitted in Charlotte County in 2024 (703 in 5+ unit buildings).
Forward outlook
- Local home prices are declining (-3.0%/yr); year-one equity from $483 of loan paydown is wiped out by about $2k of value loss. Plan a longer hold.
- Charlotte County population projected at +24% by 2050 — long-run rental-demand tailwind backs the buy-and-hold thesis.
- At projected returns (-3.0% appreciation + 0.0% rent growth), your $20k cash investment doubles in ~7 years — after that, you're playing with house money.
Negotiation context
- It's been on market 107 days — a 9% lower offer ($64k) is reasonable based on typical stale-listing flexibility.
- 2 sale attempts since 12y ago; this cycle's ask has dropped $8k (10%) from the opening price — seller is motivated, your offer sets the floor, not the list.
Risks & watch-outs
- Watch-outs: flood insurance adds $66/mo.
- Climate carrying-cost: major flood risk; severe wind risk, 99% chance of damaging wind over 30y; moderate wildfire risk; extreme-heat days projected 7→29/yr by 2055 (HVAC capex compounding) — expect insurance premiums to compound above CPI over the hold.
Questions for the listing agent
- It's been on market 107 days. Have you received any prior offers? Is the seller open to a 9% concession, seller financing, or rate buy-down credit?
- What's the actual annual flood-insurance premium (NFIP or private), and is the property in a SFHA with mandatory coverage?
- What does the HOA fee cover, when was the last increase, and are there any pending special assessments or reserve-fund shortfalls?
- Why hasn't it sold? Are there any deal-killer items the seller is aware of (foundation, flood, title, zoning, code violations)?
- Is there a deadline driving the sale (1031 exchange, divorce, estate, relocation)? That informs how much negotiation room exists.
- Schools are A-rated — typically a magnet for longer-tenancy family renters. What's the average tenant stay here, and is there a school-zone premium baked into asking?
- What's the average days-on-market for RENTAL listings here right now (not sales)? A rising rental-DOM trend means longer vacancies and softer asking-rent achievability than the comps imply.
- What's the recent tenant-quality profile in this submarket — average credit score on applications, eviction rate, late-payment / NSF rate, and stable-employment percentage? A property-management company in the area should have these aggregated.
- How much new for-sale + rental construction is in the pipeline within 1–3 miles? Heavy new supply typically softens prices + rents 12–24 months out; constrained supply supports both.
Investment metrics
- 1% rule
- 2.02% ✓
- Cap rate
- 13.85%
- Cash-on-cash
- 26.99%
- DSCR
- 2.20
- GRM
- 4.1
CMA / ARV
No comps found within radius.
Projected returns pro-forma
-3.0% appreciation · 0.0% rent growth · sell at horizon
- IRR
- 11.5%
- Equity multiple
- 1.44×
- Total profit
- $8,517
- Equity at exit
- $10,422
- IRR
- 17.2%
- Equity multiple
- 2.16×
- Total profit
- $22,792
- Equity at exit
- $6,044
Cash invested: $19,572 (down + closing). Projections, not guarantees.
Landlord ↔ Tenant lean methodology
- Overall (STATE)
- 87 Strongly Landlord-Friendly
- State Florida
- 87 Strongly Landlord-Friendly · R+3
- County
- — inherits STATE
- City
- — inherits STATE
ZIP-level market 34224
- Home prices YoY
- -18.9%
- Rents YoY
- -0.1%
- Active inventory
- 734
- Price-to-rent
- 4.1×
Monthly cashflow live
- Estimated rent
- $1,414 medium interval (Pro) →
- Mortgage (P&I)
- −$367
- Tax from tax record
- −$141 /mo · $1,694/yr
- Insurance
- −$29
- Flood insurance flood zone
- −$66 /mo · $798/yr
- HOA
- −$140
- Vacancy / Maint / Mgmt
- −$297
- Net cashflow
- $374
Break-even live
Sensitivity live
| Price | -10% $413 | -5% $394 | +0% $374 | +5% $354 | +10% $334 |
|---|---|---|---|---|---|
| Rent | -10% $262 | -5% $318 | +0% $374 | +5% $430 | +10% $485 |
| Rate | -1.0pp $409 | -0.5pp $392 | base $374 | +0.5pp $356 | +1.0pp $337 |
UW: 25.0% down · 7.5% · 30yr · 1.5% tax · 5.0% vac · 8.0% maint · 8.0% mgmt
Financing live
Cash to close
- Down payment
- $17,475
- Closing costs
- $2,097
- Reserves months
- —
- Total cash needed
- —
Loan-product check · same deal, 3 products live
Conventional
25% down · 7.5% · 30yr
- Down + closing
- —
- Monthly P&I
- —
- Monthly cashflow
- —
- DSCR
- —
- Eligible?
- —
Personal DTI + credit; lowest rate.
DSCR
20% down · 8.5% · 30yr
- Down + closing
- —
- Monthly P&I
- —
- Monthly cashflow
- —
- DSCR
- —
- Eligible?
- —
No personal income docs; deal must DSCR.
Hard money
10% down · 12.0% · 12mo
- Down + closing
- —
- Monthly P&I
- —
- Monthly cashflow
- —
- DSCR
- —
- Eligible?
- —
Short-term bridge; refi at stabilization.
HOA detail
- Monthly dues
- $140 · $1,680/yr
Listing history 22 events
-
2026-06-18days on market $69,900 Active 107 DOM
-
2026-06-17days on market $69,900 Active 106 DOM
-
2026-06-16days on market $69,900 Active 105 DOM
-
2026-06-15days on market $69,900 Active 104 DOM
-
2026-06-14days on market $69,900 Active 102 DOM
-
2026-06-13days on market $69,900 Active 101 DOM
-
2026-06-10days on market $69,900 Active 99 DOM
-
2026-06-09days on market $69,900 Active 98 DOM
-
2026-06-08days on market $69,900 Active 97 DOM
-
2026-06-07days on market $69,900 Active 96 DOM
-
2026-06-05days on market $69,900 Active 93 DOM
-
2026-06-03days on market $69,900 Active 92 DOM
-
2026-06-02days on market $69,900 Active 91 DOM
-
2026-06-01days on market $69,900 Active 90 DOM
-
2026-05-31days on market $69,900 Active 89 DOM
-
2026-05-30days on market $69,900 Active 88 DOM
-
2026-04-17price $69,900
-
2026-03-02$78,000 Active
-
2018-11-19soldstatus $70,000
-
2014-12-30soldstatus $44,000 Sold 200-char remark
Show marketing remark (200 chars)
Great location with lots of activities. - large vinyl enclosed lanai with inside utility room (lanai has various lengths & widths). Unit has been recently painted inside. Must see to appreciate.
-
2014-11-30status Pending 200-char remark
Show marketing remark (200 chars)
Great location with lots of activities. - large vinyl enclosed lanai with inside utility room (lanai has various lengths & widths). Unit has been recently painted inside. Must see to appreciate.
-
2014-11-14$45,900 Active 200-char remark
Show marketing remark (200 chars)
Great location with lots of activities. - large vinyl enclosed lanai with inside utility room (lanai has various lengths & widths). Unit has been recently painted inside. Must see to appreciate.
ⓘ Source: listings_history table (triggers on properties + properties_extension) + one-shot
backfill from property_details.listing_events for pre-trigger history.
Tax reassessment forecast FL · Resets to sale price
- Current annual tax
- $1,694 · $141/mo
- Projected year-2 tax
- $1,694 · $141/mo
- Expected delta
- $0/yr ($0/mo · 0.0%)
ⓘ Screening estimate from a state-policy table — verify with the county assessor before closing.
Climate risk First Street
- Flood 7/10 Severe FEMA zone X (shaded) · 95% chance over 30 yrs
- Wildfire 5/10 Major
- Heat 10/10 Extreme 7 d/yr ≥107°F today · 29 d/yr by 30 yrs out
- Wind 10/10 Extreme 99% chance of damaging wind over 30 yrs
- Air quality 2/10 Low 1 unhealthy d/yr today · 1 by 30 yrs out
Nearby sold comps map
Loading sold comps map…
Walkable amenities ~0.75 mi
Loading nearby amenities…
Taxation est. · year 1
- Rental income
- $16,968
- − Mortgage interest
- −$3,915
- − Property taxes
- −$1,694
- − Insurance
- −$1,147
- − Repairs & maintenance
- −$1,357
- − Management
- −$1,357
- − HOA
- −$1,680
- − Depreciation
- −$2,033
- Taxable income
- $3,784
- Est. tax owed @ 24.0%
- −$908
- After-tax cash flow
- $3,577/yr
For passive investors: Depreciation is non-cash, so a rental often shows a tax loss while cash-flowing — sheltering income. Rental losses are passive: they offset passive income freely, and up to $25,000/yr can offset ordinary (W-2) income if you actively participate and your MAGI is under $100k (phasing out to $0 by $150k); unused losses carry forward. On sale, claimed depreciation is recaptured at up to 25%, and gains may owe capital-gains tax (a 1031 exchange can defer both). Figures are a year-1 estimate at your 24.0% rate — not tax advice; consult a CPA.
Schools (NCES district)
- District
- Charlotte
- NCES district ID
- 1200240
- Math proficiency
- 54% ▼ -6.00%
- Reading proficiency
- 54% ▼ -1.00%
- Median HH income
- $44,864
- Composite
- 45.62/100
- National rank
- #2586
- State rank
- #22 of 73 in FL
Livability — Englewood
- Score
- 73/100
- State rank
- #321
- US rank
- #5655
Category grades
Schools grade is shown separately in the Schools card above.
Census & demographics
- Census place
- Englewood, FL
- County
- Charlotte County · 196,994 people
- Metro
- Punta Gorda, FL
- Population (ZIP)
- 15,536
- Household income
- $57,281
- Rent vs Own
- Severe rent burden
- 329.0
Population outlook (Charlotte County) Hauer SSP2
- Today (2025)
- 198,646 people
- By 2030
- 210,507 · +6.0%
- By 2040
- 230,857 · +16.2%
- By 2050
- 247,148 · +24.4%
- By 2075
- 281,777 · +41.8%
- By 2100
- 293,609 · +47.8%
Race, ethnicity, and origin ACS 2023
- Neighborhood character
- Predominantly White (92%)
- Race & ethnicity
- White 92% Two or more races 5% Hispanic / Latino 3% Asian 1%
- Common ancestry
- Romanian 4% Slovak 4% Lithuanian 4%
- Foreign-born
- 9% · Canada
- Languages at home
- 92% English-only · Other Indo-European 2% Spanish 2% German/W. Germanic 1%
Political lean MEDSL · Charlotte
- 2024 margin
- Solid R (+34.0) · D 32.7% · R 66.7%
- 2008→2024 swing
- -26.7pp toward R · 2008: -7.2pp · 2024: -34.0pp
- All cycles
- 2024: R+34.0 2020: R+26.6 2016: R+27.8 2012: R+14.3 2008: R+7.2
Not yet ingested
- Civics
- —
Market trends
- HPI YoY
- ▼ -75.76%
- Current HPI
- 325.0345
- Rent YoY
- ▼ -0.11%
- Metro
- Punta Gorda, FL
- State GDP YoY
- ▲ 3.28%
- F500 in state
- 36
Industry mix (Fortune 500 HQ in FL)
| Industry | F500 HQs | Revenue |
|---|---|---|
| Industrial Technology | 2 | $29B |
|
||
| Insurance | 2 | $17B |
|
||
| Retail | 1 | $60B |
|
||
| Technology Distribution | 1 | $58B |
|
||
| Homebuilding | 1 | $35B |
|
||
| Technology Manufacturing | 1 | $35B |
|
||
Price history
+52.3% since first listed6 events — show timeline
- 2026-04-17 Price Changed $69,900 Stellar MLS as Distributed by MLS Grid
- 2026-03-02 Listed $78,000 Stellar MLS as Distributed by MLS Grid
- 2018-11-19 Sold (Public Records) $70,000 Public Records
- 2014-12-30 Sold (MLS) $44,000 Stellar MLS as Distributed by MLS Grid
- 2014-11-30 Pending — Stellar MLS as Distributed by MLS Grid
- 2014-11-14 Listed $45,900 Stellar MLS as Distributed by MLS Grid
Property tax history
+4.4%/yrLatest (2025): $1,694 · -13.1% YoY. Source: county tax records.
Cash-flow waterfall
monthlySold comps — $/sqft
last 12 mo · ≤1 miLoading sold comps…