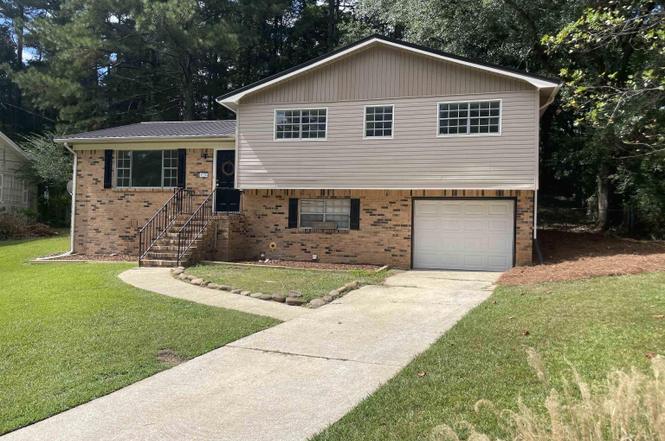
520 Bonnie Bell Ln · Birmingham, AL
Flood risk 1/10 · Minimal
- FEMA flood zone
- X (unshaded)
- Chance of flooding over 30 yrs
- 0.0%
- Est. flood insurance / yr
- $473 – $860
Fire risk 2/10 · Minimal
- Est. fire insurance / yr
- $916 – $1,700
Heat risk 5/10 · Moderate
- Hot days now (above 106°F)
- 7 days/yr
- Hot days in 30 yrs
- 18 days/yr
Wind risk 6/10 · Moderate
- Chance of severe wind over 30 yrs
- 27.0%
Air-quality risk 5/10 · Moderate
- Unhealthy air days now
- 8 days/yr
- Unhealthy air days in 30 yrs
- 10 days/yr
Risk factors via First Street. Map © Google.
Why this score? — see what drove the D+ grade
The composite is a weighted blend of 9 inputs, each scored 0–100. Each bar is that input's sub-score; the figure is the points it added to the 100-point composite (weight × sub-score).
- Cash flow +15.8/30.0
- ARV discount +11.8/15.0
- DSCR +4.9/10.0
- Rent growth +3.5/5.0
- Livability +3.4/5.0
- 1% rule +3.0/10.0
- Condition / age +2.5/5.0
- Schools +0.9/10.0
- Appreciation +0.0/10.0
$239,000
🖨 Deal sheet 📄 Offer letter ✓ Due diligence
Listing remarks
Move -in Condition in Holiday Gardens !! Enjoy coming home to this freshly painted 4 bedrooms 2 full baths home offering garage parking , laundry area , a large living room , oversized eat- in kitchen with lots of cabinets and good natural lighting. French doors take you out onto an open low level deck over looking a private fenced back yard . Put this one on your list as a must see ! !
Key facts
- Laundry area
- Large living room
- Garage parking
Tags
Neighborhood map
What this means for you Summary
Snapshot
- This is a 3-bed/2.0-bath single-family listed at $239k.
Deal economics
- At list price, monthly cash flow is $109 ($1k/yr) — positive.
- The deal already cash-flows at list — no discount required.
- To meet the 1% rule (rent ≥ 1% of price), the offer needs to be $192k (19.9% below list).
- Recommended offer: $192k (19.9% below list) — sets the bar for 1% rule.
Location & tenants
- Location reads 67/100 on livability (#78 in AL) — a middle-class / working-renter tenant base. Strengths: commute A+, cost of living A+, housing A+; Watch: amenities C-, crime F, employment F.
- Birmingham City (urban): math 4% / reading 20% proficiency, ranked #116 of 129 in AL (top 90%) — low school quality limits family demand, transient renter base, plan for 1-2y turnover; 82% free/reduced lunch — lower-income household profile, screen leases tightly.
- Zoned schools: Avondale Elementary School (math 2% / reading 17%, grade F, #568 of 627 statewide, top 94%, 328 students, 76% FRL).
- Market conditions: Rents rising fast (+4.2%/yr); 81 active listings in the ZIP; 14 comparable units currently listed for rent nearby; rentals at typical pace (median 16d on market — plan ~3-4 weeks tenant-placement turnaround); 2,114 units permitted in Jefferson County in 2024 (556 in 5+ unit buildings).
- This rent runs 31% of the median local income ($73k/yr) — at the standard rent-burdened threshold; future hikes will face affordability resistance.
Forward outlook
- Local home prices are declining (-3.0%/yr); year-one equity from $2k of loan paydown is wiped out by about $7k of value loss. Plan a longer hold.
- Jefferson County population projected to shrink 4% by 2050 — rents likely to lag national; underwrite the cash flow, not the appreciation.
Negotiation context
- It's been on market 186 days — a 12% lower offer ($210k) is reasonable based on typical stale-listing flexibility.
- 2 sale attempts; this cycle's ask has dropped $21k (8%) from the opening price — seller is motivated, your offer sets the floor, not the list.
Risks & watch-outs
- Climate carrying-cost: major wind risk, 27% chance of damaging wind over 30y; extreme-heat days projected 7→18/yr by 2055 (HVAC capex compounding) — expect insurance premiums to compound above CPI over the hold.
Questions for the listing agent
- It's been on market 186 days. Have you received any prior offers? Is the seller open to a 20% concession, seller financing, or rate buy-down credit?
- Built in 1970 — when were the roof, HVAC, electrical panel, plumbing, and water heater last replaced?
- Why hasn't it sold? Are there any deal-killer items the seller is aware of (foundation, flood, title, zoning, code violations)?
- Is there a deadline driving the sale (1031 exchange, divorce, estate, relocation)? That informs how much negotiation room exists.
- Schools are F-rated, which usually means shorter tenancies and higher turnover. Who's the typical renter profile here, and what's been the actual vacancy rate?
- Crime grade is F in this area — have there been break-ins, vandalism, or insurance claims at this property in the last 3 years? What carrier currently insures it and at what premium?
- The area grade is low — what's the realistic commute time and amenity access for the typical tenant pool here? Any planned neighborhood developments (good or bad) we should know about?
- What's the average days-on-market for RENTAL listings here right now (not sales)? A rising rental-DOM trend means longer vacancies and softer asking-rent achievability than the comps imply.
- What's the recent tenant-quality profile in this submarket — average credit score on applications, eviction rate, late-payment / NSF rate, and stable-employment percentage? A property-management company in the area should have these aggregated.
- How much new for-sale + rental construction is in the pipeline within 1–3 miles? Heavy new supply typically softens prices + rents 12–24 months out; constrained supply supports both.
Investment metrics
- 1% rule
- 0.80% ✗
- Cap rate
- 6.84%
- Cash-on-cash
- 1.95%
- DSCR
- 1.09
- GRM
- 10.4
CMA / ARV
- ARV (on-the-fly)
- $264,180
- Comps found
- 12
Show comp detail 12 sales within ~0.75 mi
| Address | Dist | Beds/Ba | Sqft | Sold | Price | $/sf | Match |
|---|---|---|---|---|---|---|---|
| 520 Bonnie Bell Ln | 0.00mi | 4/2.0 (+1) | 1,428 (0%) | 1mo | $237,000 | $166 | 94 |
| 5249 Goldmar Dr | 0.22mi | 3/2.0 | 1,525 (+7%) | 5mo | $199,000 | $130 | 74 |
| 5109 Northumberland Dr | 0.41mi | 3/2.0 | 1,427 (-0%) | 9mo | $178,000 | $125 | 73 |
| 5225 Cornell Dr | 0.26mi | 3/2.0 | 1,489 (+4%) | 10mo | $287,500 | $193 | 73 |
| 5064 Cherokee Woods Cir | 0.51mi | 3/2.0 | 1,377 (-4%) | 5mo | $270,000 | $196 | 66 |
| 532 Rosewell Ln | 0.27mi | 3/2.0 | 1,614 (+13%) | 4mo | $245,900 | $152 | 62 |
| 5004 Scenic View Dr | 0.55mi | 3/2.0 | 1,334 (-7%) | 2mo | $331,000 | $248 | 61 |
| 117 Briar Grove Dr | 0.53mi | 3/1.5 | 1,504 (+5%) | 7mo | $260,000 | $173 | 59 |
| 221 Vetavia St | 0.73mi | 3/1.5 | 1,460 (+2%) | 5mo | $90,000 | $62 | 56 |
| 5144 Northumberland Rd | 0.43mi | 3/3.5 | 1,620 (+13%) | 2mo | $300,000 | $185 | 50 |
| 200 Berkshire Dr | 0.55mi | 3/2.0 | 1,227 (-14%) | 8mo | $290,000 | $236 | 45 |
| 144 Deer Park Dr | 0.47mi | 3/2.0 | 1,227 (-14%) | 13mo | $340,000 | $277 | 44 |
Match score weights: distance 35% · size 25% · config 20% · recency 20%. Top-matched comps best support the ARV.
Projected returns pro-forma
-3.0% appreciation · 4.18% rent growth · sell at horizon
- IRR
- -12.1%
- Equity multiple
- 0.56×
- Total profit
- $-29,617
- Equity at exit
- $35,636
- IRR
- -1.6%
- Equity multiple
- 0.89×
- Total profit
- $-7,691
- Equity at exit
- $20,664
Cash invested: $66,920 (down + closing). Projections, not guarantees.
Landlord ↔ Tenant lean methodology
- Overall (STATE)
- 90 Strongly Landlord-Friendly
- State Alabama
- 90 Strongly Landlord-Friendly · R+15
- County
- — inherits STATE
- City
- — inherits STATE
ZIP-level market 35210
- Home prices YoY
- -32.2%
- Rents YoY
- 4.2%
- Active inventory
- 81
- Price-to-rent
- 10.4×
Monthly cashflow live
- Estimated rent
- $1,916 high interval (Pro) →
- Mortgage (P&I)
- −$1,253
- Tax from tax record
- −$52 /mo · $618/yr
- Insurance
- −$100
- HOA
- −$0
- Vacancy / Maint / Mgmt
- −$402
- Net cashflow
- $109
Break-even live
UW: 25.0% down · 7.5% · 30yr · 1.5% tax · 5.0% vac · 8.0% maint · 8.0% mgmt
Financing live
Cash to close
- Down payment
- $59,750
- Closing costs
- $7,170
- Reserves months
- —
- Total cash needed
- —
Loan-product check · same deal, 3 products live
Conventional
25% down · 7.5% · 30yr
- Down + closing
- —
- Monthly P&I
- —
- Monthly cashflow
- —
- DSCR
- —
- Eligible?
- —
Personal DTI + credit; lowest rate.
DSCR
20% down · 8.5% · 30yr
- Down + closing
- —
- Monthly P&I
- —
- Monthly cashflow
- —
- DSCR
- —
- Eligible?
- —
No personal income docs; deal must DSCR.
Hard money
10% down · 12.0% · 12mo
- Down + closing
- —
- Monthly P&I
- —
- Monthly cashflow
- —
- DSCR
- —
- Eligible?
- —
Short-term bridge; refi at stabilization.
Rent comps 14 comps
| Address | Beds | Baths | Sqft | Rent | $/sqft | DOM | Units | Dist |
|---|---|---|---|---|---|---|---|---|
| 509 Ardmore Ln Irondale, AL | 3.0 | 1.5 | 1408 | $1,580 | $1.12 | 3d | 1 | 0.14mi |
| 617 Princess Ln Irondale, AL | 3.0 | 2.0 | 1662 | $1,910 | $1.15 | 2d | 1 | 0.46mi |
| 5303 Dixieland Rd Irondale, AL | 4.0 | 3.0 | 1296 | $1,911 | $1.47 | 16d | 1 | 0.51mi |
| 132 Woodside Dr Irondale, AL | 3.0 | 1.0 | 1452 | $1,595 | $1.10 | 16d | 1 | 0.73mi |
| 504 Wonder Ln Birmingham, AL | 2.0 | 2.0 | 900 | $1,600 | $1.78 | 2d | 1 | 0.79mi |
| 549 Wonder Ln Irondale, AL | 2.0 | 2.0 | 1000 | $1,500 | $1.50 | 16d | 1 | 0.82mi |
| 2208 3rd Ave S Irondale, AL | 3.0 | 1.0 | 934 | $1,350 | $1.45 | 44d | 1 | 0.87mi |
| 530 Elder St Unit 1 Irondale, AL | 3.0 | 2.0 | 1700 | $2,000 | $1.18 | 44d | 1 | 0.95mi |
| 131 Chestnut St Birmingham, AL | 2.0 | 1.0 | 927 | $1,649 | $1.78 | 24d | 1 | 0.96mi |
| 2884 Montevallo Park Rd Irondale, AL | 3.0 | 2.0 | 1275 | $2,206 | $1.73 | 3d | 1 | 1.00mi |
| 3543 Mill Springs Rd Mountain Brk, AL | 3.0 | 2.5 | 1868 | $2,500 | $1.34 | 44d | 1 | 1.07mi |
| 7716 Sunrise Cir Birmingham, AL | 1.0–2.0 | 1.0 | 795 | $1,000 | $1.26 | 44d | 1 | 1.36mi |
| 1522 Cooper Hill Rd Birmingham, AL | 1.0–3.0 | 1.0–2.0 | 875 | $1,299 | $1.48 | 2d | 17 | 1.37mi |
| 4324 Wilderness Rd #4324 Mountain Brook, AL | 3.0 | 2.5 | 1800 | $2,250 | $1.25 | 24d | 1 | 1.45mi |
Listing history 7 events
-
2026-04-23status Pending
-
2026-03-28status Active
-
2026-03-11status Pending
-
2026-02-07price $239,000
-
2025-11-18price $245,000
-
2025-10-14price $249,000
-
2025-10-02$259,900 Active
ⓘ Source: listings_history table (triggers on properties + properties_extension) + one-shot
backfill from property_details.listing_events for pre-trigger history.
Tax reassessment forecast AL · Resets to sale price
- Current annual tax
- $618 · $52/mo
- Projected year-2 tax
- $980 · $82/mo
- Expected delta
- +$362/yr (+$30/mo · 58.6%)
ⓘ Screening estimate from a state-policy table — verify with the county assessor before closing.
Climate risk First Street
- Flood 1/10 Low FEMA zone X (unshaded) · 0% chance over 30 yrs
- Wildfire 2/10 Low
- Heat 5/10 Major 7 d/yr ≥106°F today · 18 d/yr by 30 yrs out
- Wind 6/10 Major 27% chance of damaging wind over 30 yrs
- Air quality 5/10 Major 8 unhealthy d/yr today · 10 by 30 yrs out
Nearby sold comps map
Loading sold comps map…
Walkable amenities ~0.75 mi
Loading nearby amenities…
Taxation est. · year 1
- Rental income
- $22,987
- − Mortgage interest
- −$13,388
- − Property taxes
- −$618
- − Insurance
- −$1,195
- − Repairs & maintenance
- −$1,839
- − Management
- −$1,839
- − Depreciation
- −$6,953
- Taxable loss
- −$2,845
- Est. tax savings @ 24.0%
- +$683
- After-tax cash flow
- $1,989/yr
For passive investors: Depreciation is non-cash, so a rental often shows a tax loss while cash-flowing — sheltering income. Rental losses are passive: they offset passive income freely, and up to $25,000/yr can offset ordinary (W-2) income if you actively participate and your MAGI is under $100k (phasing out to $0 by $150k); unused losses carry forward. On sale, claimed depreciation is recaptured at up to 25%, and gains may owe capital-gains tax (a 1031 exchange can defer both). Figures are a year-1 estimate at your 24.0% rate — not tax advice; consult a CPA.
Schools (NCES district)
- District
- Birmingham City
- NCES district ID
- 0100390
- Math proficiency
- 4% ▼ -17.00%
- Reading proficiency
- 20% ▼ -4.00%
- Median HH income
- $31,988
- Composite
- 9.49/100
- National rank
- #9850
- State rank
- #116 of 129 in AL
Livability — Birmingham
- Score
- 67/100
- State rank
- #78
- US rank
- #10412
Category grades
Schools grade is shown separately in the Schools card above.
Census & demographics
- Census place
- Birmingham, AL
- County
- Jefferson County · 527,445 people
- City population
- 210,422
- Metro
- Birmingham-Hoover, AL
- Population (ZIP)
- 13,775
- Household income
- $73,061
- Rent vs Own
- Severe rent burden
- 379.0
Population outlook (Jefferson County) Hauer SSP2
- Today (2025)
- 669,185 people
- By 2030
- 669,694 · +0.1%
- By 2040
- 661,388 · -1.2%
- By 2050
- 643,086 · -3.9%
- By 2075
- 577,267 · -13.7%
- By 2100
- 474,758 · -29.1%
Race, ethnicity, and origin ACS 2023
- Neighborhood character
- Majority White (62%)
- Race & ethnicity
- White 62% Black 28% Hispanic / Latino 7% Two or more races 6%
- Hispanic origin (detail)
- Mexican 4%
- Common ancestry
- Slovak 4% Italian 3% Serbian 2%
- Foreign-born
- 6% · Canada
- Languages at home
- 91% English-only · Spanish 6% Arabic 1% Russian/Polish/Slavic 1%
Political lean MEDSL · Jefferson
- 2024 margin
- D (+10.4) · D 54.6% · R 44.2% · Other 1.2%
- 2008→2024 swing
- +5.4pp toward D · 2008: 5.1pp · 2024: 10.4pp
- All cycles
- 2024: D+10.4 2020: D+13.2 2016: D+7.2 2012: D+6.0 2008: D+5.1
Not yet ingested
- Civics
- —
Market trends
- HPI YoY
- ▼ -109.03%
- Current HPI
- 230.033
- Rent YoY
- ▲ 4.18%
- Metro
- Birmingham-Hoover, AL
- State GDP YoY
- ▲ 2.94%
- F500 in state
- 4
Industry mix (Fortune 500 HQ in AL)
| Industry | F500 HQs | Revenue |
|---|---|---|
| Financial Services | 1 | $8B |
|
||
| Healthcare | 1 | $5B |
|
||
Price history
-8.0% since first listed7 events — show timeline
- 2026-04-23 Pending — Greater Alabama MLS
- 2026-03-28 Relisted — Greater Alabama MLS
- 2026-03-11 Pending — Greater Alabama MLS
- 2026-02-07 Price Changed $239,000 Greater Alabama MLS
- 2025-11-18 Price Changed $245,000 Greater Alabama MLS
- 2025-10-14 Price Changed $249,000 Greater Alabama MLS
- 2025-10-02 Listed $259,900 Greater Alabama MLS
Cash-flow waterfall
monthlySold comps — $/sqft
last 12 mo · ≤1 miLoading sold comps…