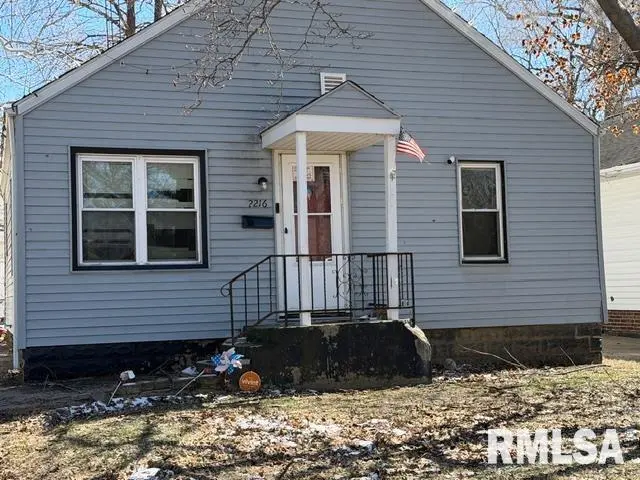
2216 S 13th St · Springfield, IL
Flood risk 1/10 · Minimal
- FEMA flood zone
- X (unshaded)
- Chance of flooding over 30 yrs
- 0.0%
- Est. flood insurance / yr
- $473 – $860
Fire risk 1/10 · Minimal
- Est. fire insurance / yr
- $804 – $1,492
Heat risk 4/10 · Minor
- Hot days now (above 105°F)
- 7 days/yr
- Hot days in 30 yrs
- 20 days/yr
Wind risk 2/10 · Minimal
- Chance of severe wind over 30 yrs
- 1.0%
Air-quality risk 2/10 · Minimal
- Unhealthy air days now
- 1 days/yr
- Unhealthy air days in 30 yrs
- 1 days/yr
Risk factors via First Street. Map © Google.
Why this score? — see what drove the B- grade
The composite is a weighted blend of 9 inputs, each scored 0–100. Each bar is that input's sub-score; the figure is the points it added to the 100-point composite (weight × sub-score).
- Cash flow +30.0/30.0
- 1% rule +10.0/10.0
- DSCR +10.0/10.0
- Rent growth +5.0/5.0
- Livability +4.0/5.0
- ARV discount +3.4/15.0
- Condition / age +2.5/5.0
- Schools +1.7/10.0
- Appreciation +0.0/10.0
$50,000
🖨 Deal sheet (PDF) 📄 Offer letter ✓ Due diligence
Listing remarks MLS
Great opportunity in Springfield! This 2-bedroom, 1-bath home is conveniently located near local hospitals, downtown, shopping, and dining, offering easy access to many of the city’s key amenities. The property features a functional layout with spacious living areas, three comfortable bedrooms, and two full bathrooms. Whether you’re looking for an investment property to add to your portfolio or a place to call home, this property offers excellent potential. Its central location makes it attractive for both homeowners and tenants seeking convenience and accessibility.
Key facts
- 5,600 sq ft lot
- Built 1940
- Listed 93 days
Neighborhood map
What this means for you Summary
Snapshot
- This is a 2-bed/1.0-bath other listed at $50k.
Deal economics
- At list price, monthly cash flow is $341 ($4k/yr) — positive.
- The deal already cash-flows at list — no discount required.
- Meets the 1% rule at list price ($917 rent vs $50k).
- Recommended offer: $46k (9.0% below list) — sets the bar for market timing.
- Cap rate 14.5% vs local median 4.9% in Springfield — top-decile yield for the area; either an underpriced asset or a hidden risk that comps aren't pricing in. Stress-test before assuming the spread holds.
Location & tenants
- Location reads 79/100 on livability (#122 in IL, #2,138 nationally) — a middle-class / working-renter tenant base. Strengths: amenities A+, commute A+, cost of living A+; Watch: crime F.
- Springfield SD 186 (urban): math 17% / reading 22% proficiency, ranked #438 of 620 in IL (top 71%) — low school quality limits family demand, transient renter base, plan for 1-2y turnover; 64% free/reduced lunch — lower-income household profile, screen leases tightly.
- Zoned schools: Harvard Park Elem School (math 2% / reading 2%, grade F, #1,927 of 2,056 statewide, top 100%, 346 students, 0% FRL); Jefferson Middle School (math 3% / reading 8%, grade F, #635 of 665 statewide, top 95%, 539 students, 0% FRL); Springfield Southeast High Sch (math 17% / reading 22%, grade F, #397 of 693 statewide, top 61%, 1,261 students, 0% FRL) — zoned schools average 0% FRL vs 64% district-wide (64 pts lower); this property's tenant base skews higher-income than the district average.
- Market conditions: Rents rising fast (+12.2%/yr); 107 active listings in the ZIP; 13 comparable units currently listed for rent nearby; rentals lingering (median 46d on market — plan ~5-8 weeks vacancy on turnover, expect pricing pressure); 69% of comp listings sitting > 30 days — soft ceiling on asking rent; 225 units permitted in Sangamon County in 2024 (48 in 5+ unit buildings).
Forward outlook
- Local home prices are declining (-3.0%/yr); year-one equity from $346 of loan paydown is wiped out by about $2k of value loss. Plan a longer hold.
- Sangamon County population projected to shrink 9% by 2050 — rents likely to lag national; underwrite the cash flow, not the appreciation.
- At projected returns (-3.0% appreciation + 8.0% rent growth), your $14k cash investment doubles in ~4 years — after that, you're playing with house money.
Negotiation context
- It's been on market 93 days — a 9% lower offer ($46k) is reasonable based on typical stale-listing flexibility.
- 6 sale attempts since 26y ago with the ask held roughly flat each time — persistent listings suggest the price (not the market) is what's stuck; bring a comps-based counter.
Risks & watch-outs
- Watch-outs: built in 1940 — expect roof / HVAC / electrical / plumbing capex.
Questions for the listing agent
- It's been on market 93 days. Have you received any prior offers? Is the seller open to a 9% concession, seller financing, or rate buy-down credit?
- Built in 1940 — when were the roof, HVAC, electrical panel, plumbing, and water heater last replaced?
- Why hasn't it sold? Are there any deal-killer items the seller is aware of (foundation, flood, title, zoning, code violations)?
- Is there a deadline driving the sale (1031 exchange, divorce, estate, relocation)? That informs how much negotiation room exists.
- Schools are D-rated, which usually means shorter tenancies and higher turnover. Who's the typical renter profile here, and what's been the actual vacancy rate?
- Crime grade is F in this area — have there been break-ins, vandalism, or insurance claims at this property in the last 3 years? What carrier currently insures it and at what premium?
- What's the average days-on-market for RENTAL listings here right now (not sales)? A rising rental-DOM trend means longer vacancies and softer asking-rent achievability than the comps imply.
- What's the recent tenant-quality profile in this submarket — average credit score on applications, eviction rate, late-payment / NSF rate, and stable-employment percentage? A property-management company in the area should have these aggregated.
- How much new for-sale + rental construction is in the pipeline within 1–3 miles? Heavy new supply typically softens prices + rents 12–24 months out; constrained supply supports both.
Investment metrics
- 1% rule
- 1.83% ✓
- Cap rate
- 14.47%
- Cash-on-cash
- 29.22%
- DSCR
- 2.30
- GRM
- 4.5
CMA / ARV
- ARV (median comp)
- $45,837
- List price
- $50,000
- Delta
- 9.08%
- Verdict
- FAIR
- Comps
- 20 within 1.0 mi
Projected returns pro-forma
-3.0% appreciation · 8.0% rent growth · sell at horizon
- IRR
- 29.5%
- Equity multiple
- 2.32×
- Total profit
- $18,492
- Equity at exit
- $7,455
- IRR
- 39.8%
- Equity multiple
- 5.73×
- Total profit
- $66,263
- Equity at exit
- $4,323
Cash invested: $14,000 (down + closing). Projections, not guarantees.
Landlord ↔ Tenant lean methodology
- Overall (STATE)
- 43 Moderately Tenant-Leaning
- State Illinois
- 43 Moderately Tenant-Leaning · D+7
- County
- — inherits STATE
- City
- — inherits STATE
ZIP-level market 62703
- Home prices YoY
- -28.9%
- Rents YoY
- 12.2%
- Active inventory
- 107
- Price-to-rent
- 4.5×
Monthly cashflow live
- Estimated rent
- $917 high interval (Pro) →
- Mortgage (P&I)
- −$262
- Tax from tax record
- −$100 /mo · $1,204/yr
- Insurance
- −$21
- HOA
- −$0
- Vacancy / Maint / Mgmt
- −$193
- Net cashflow
- $341
Break-even live
Sensitivity live
| Price | -10% $369 | -5% $355 | +0% $341 | +5% $327 | +10% $313 |
|---|---|---|---|---|---|
| Rent | -10% $268 | -5% $305 | +0% $341 | +5% $377 | +10% $413 |
| Rate | -1.0pp $366 | -0.5pp $354 | base $341 | +0.5pp $328 | +1.0pp $315 |
UW: 25.0% down · 7.5% · 30yr · 1.5% tax · 5.0% vac · 8.0% maint · 8.0% mgmt
Financing live
Cash to close
- Down payment
- $12,500
- Closing costs
- $1,500
- Reserves months
- —
- Total cash needed
- —
Loan-product check · same deal, 3 products live
Conventional
25% down · 7.5% · 30yr
- Down + closing
- —
- Monthly P&I
- —
- Monthly cashflow
- —
- DSCR
- —
- Eligible?
- —
Personal DTI + credit; lowest rate.
DSCR
20% down · 8.5% · 30yr
- Down + closing
- —
- Monthly P&I
- —
- Monthly cashflow
- —
- DSCR
- —
- Eligible?
- —
No personal income docs; deal must DSCR.
Hard money
10% down · 12.0% · 12mo
- Down + closing
- —
- Monthly P&I
- —
- Monthly cashflow
- —
- DSCR
- —
- Eligible?
- —
Short-term bridge; refi at stabilization.
Rent comps 13 comps
| Address | Beds | Baths | Sqft | Rent | $/sqft | DOM | Units | Dist |
|---|---|---|---|---|---|---|---|---|
| 2271 E Laurel St Apt 2277 Springfield, IL | 2.0 | 1.0 | 600 | $1,145 | $1.91 | 22d | 1 | 0.99mi |
| 2277 E Laurel St Springfield, IL | 2.0 | 1.0 | 600 | $1,145 | $1.91 | 45d | 1 | 0.99mi |
| 909 S 8th St Unit 4 Springfield, IL | 1.0 | 1.0 | 550 | $800 | $1.45 | 22d | 1 | 1.20mi |
| 2473 Ladley Ct Unit 2108-2 B Springfield, IL | 2.0 | 1.0 | 700 | $825 | $1.18 | 45d | 1 | 1.35mi |
| 2473 Ladley Ct Unit 2412-1 L Springfield, IL | 2.0 | 1.0 | 700 | $725 | $1.04 | 45d | 1 | 1.35mi |
| 2473 Ladley Ct Unit 2520-8 RR Springfield, IL | 1.0 | 1.0 | 580 | $600 | $1.03 | 45d | 1 | 1.35mi |
| 2473 Ladley Ct Springfield, IL | 1.0 | 1.0 | 580 | $725 | $1.25 | 45d | 1 | 1.35mi |
| 1500 S Lowell Ave Springfield, IL | 1.0 | 1.0 | 590 | $775 | $1.31 | 45d | 1 | 1.36mi |
| 1301 S Whittier Ave Springfield, IL | 1.0 | 1.0 | 506 | $750 | $1.48 | 45d | 1 | 1.39mi |
| 1004 S College St Springfield, IL | 1.0 | 1.0 | 700 | $800 | $1.14 | 22d | 1 | 1.43mi |
| 417 E Cook St Unit A Springfield, IL | 1.0 | 1.0 | 550 | $850 | $1.55 | 22d | 1 | 1.47mi |
| 417 E Cook St Springfield, IL | 1.0 | 1.0 | 700 | $875 | $1.25 | 45d | 1 | 1.47mi |
| 619 S 5th St Springfield, IL | 1.0 | 1.0 | 750 | $900 | $1.20 | 45d | 1 | 1.47mi |
Listing history 34 events
-
2026-06-22days on market $50,000 Active 93 DOM
-
2026-06-19days on market $50,000 Active 91 DOM
-
2026-06-18days on market $50,000 Active 90 DOM
-
2026-06-17days on market $50,000 Active 89 DOM
-
2026-06-16days on market $50,000 Active 88 DOM
-
2026-06-15days on market $50,000 Active 87 DOM
-
2026-06-14days on market $50,000 Active 85 DOM
-
2026-06-13days on market $50,000 Active 84 DOM
-
2026-06-10days on market $50,000 Active 82 DOM
-
2026-06-09days on market $50,000 Active 81 DOM
-
2026-06-08days on market $50,000 Active 80 DOM
-
2026-06-07days on market $50,000 Active 79 DOM
-
2026-06-05days on market $50,000 Active 76 DOM
-
2026-06-03days on market $50,000 Active 75 DOM
-
2026-06-02days on market $50,000 Active 74 DOM
-
2026-06-01days on market $50,000 Active 73 DOM
-
2026-05-31days on market $50,000 Active 72 DOM
-
2026-05-30days on market $50,000 Active 71 DOM
-
2026-03-31status Active 586-char remark
Show marketing remark (586 chars)
Great opportunity in Springfield! This 2-bedroom, 1-bath home is conveniently located near local hospitals, downtown, shopping, and dining, offering easy access to many of the city’s key amenities. The property features a functional layout with spacious living areas, three comfortable bedrooms, and two full bathrooms. Whether you’re looking for an investment property to add to your portfolio or a place to call home, this property offers excellent potential. Its central location makes it attractive for both homeowners and tenants seeking convenience and accessibility.
-
2026-03-28status Pending 586-char remark
Show marketing remark (586 chars)
Great opportunity in Springfield! This 2-bedroom, 1-bath home is conveniently located near local hospitals, downtown, shopping, and dining, offering easy access to many of the city’s key amenities. The property features a functional layout with spacious living areas, three comfortable bedrooms, and two full bathrooms. Whether you’re looking for an investment property to add to your portfolio or a place to call home, this property offers excellent potential. Its central location makes it attractive for both homeowners and tenants seeking convenience and accessibility.
-
2026-03-17$50,000 Active 586-char remark
Show marketing remark (586 chars)
Great opportunity in Springfield! This 2-bedroom, 1-bath home is conveniently located near local hospitals, downtown, shopping, and dining, offering easy access to many of the city’s key amenities. The property features a functional layout with spacious living areas, three comfortable bedrooms, and two full bathrooms. Whether you’re looking for an investment property to add to your portfolio or a place to call home, this property offers excellent potential. Its central location makes it attractive for both homeowners and tenants seeking convenience and accessibility.
-
2025-12-17historical
-
2025-12-15historical
-
2025-09-08Active
-
2024-02-08historical
-
2023-02-27Active
-
2022-02-24soldstatus $375,950
-
2022-02-24soldstatus $375,950
-
2020-04-01soldstatus $165,000
-
2011-07-12soldstatus $13,400
-
2011-05-20$13,400
-
2000-08-25soldstatus $32,000
-
2000-08-23soldstatus $32,000
-
2000-04-10$32,000
ⓘ Source: listings_history table (triggers on properties + properties_extension) + one-shot
backfill from property_details.listing_events for pre-trigger history.
Tax reassessment forecast IL · Partial reset (capped growth)
- Current annual tax
- $1,204 · $100/mo
- Projected year-2 tax
- $1,204 · $100/mo
- Expected delta
- $0/yr ($0/mo · 0.0%)
ⓘ Screening estimate from a state-policy table — verify with the county assessor before closing.
Climate risk First Street
- Flood 1/10 Low FEMA zone X (unshaded) · 0% chance over 30 yrs
- Wildfire 1/10 Low
- Heat 4/10 Moderate 7 d/yr ≥105°F today · 20 d/yr by 30 yrs out
- Wind 2/10 Low 100% chance of damaging wind over 30 yrs
- Air quality 2/10 Low 1 unhealthy d/yr today · 1 by 30 yrs out
Nearby sold comps map
Loading sold comps map…
Walkable amenities ~0.75 mi
Loading nearby amenities…
Taxation est. · year 1
- Rental income
- $11,002
- − Mortgage interest
- −$2,801
- − Property taxes
- −$1,204
- − Insurance
- −$250
- − Repairs & maintenance
- −$880
- − Management
- −$880
- − Depreciation
- −$1,455
- Taxable income
- $3,532
- Est. tax owed @ 24.0%
- −$848
- After-tax cash flow
- $3,243/yr
For passive investors: Depreciation is non-cash, so a rental often shows a tax loss while cash-flowing — sheltering income. Rental losses are passive: they offset passive income freely, and up to $25,000/yr can offset ordinary (W-2) income if you actively participate and your MAGI is under $100k (phasing out to $0 by $150k); unused losses carry forward. On sale, claimed depreciation is recaptured at up to 25%, and gains may owe capital-gains tax (a 1031 exchange can defer both). Figures are a year-1 estimate at your 24.0% rate — not tax advice; consult a CPA.
Schools (NCES district)
- District
- Springfield SD 186
- NCES district ID
- 1737080
- Math proficiency
- 17% ▼ -7.00%
- Reading proficiency
- 22% ▼ -5.00%
- Median HH income
- $43,744
- Composite
- 16.89/100
- National rank
- #9142
- State rank
- #438 of 620 in IL
Livability — Springfield
- Score
- 79/100
- State rank
- #122
- US rank
- #2138
Category grades
Schools grade is shown separately in the Schools card above.
Census & demographics
- Census place
- Springfield, IL
- County
- Sangamon County · 115,414 people
- City population
- 59,955
- Metro
- Springfield, IL
- Population (ZIP)
- 28,922
- Household income
- $45,009
- Rent vs Own
- Severe rent burden
- 1626.0
Population outlook (Sangamon County) Hauer SSP2
- Today (2025)
- 198,317 people
- By 2030
- 196,127 · -1.1%
- By 2040
- 188,664 · -4.9%
- By 2050
- 179,624 · -9.4%
- By 2075
- 155,027 · -21.8%
- By 2100
- 122,588 · -38.2%
Race, ethnicity, and origin ACS 2023
- Neighborhood character
- Diverse neighborhood (Simpson 0.59)
- Race & ethnicity
- White 53% Black 35% Two or more races 7% Hispanic / Latino 5%
- Common ancestry
- Lithuanian 2% Romanian 2% Italian 1%
- Foreign-born
- 3% · Canada
- Languages at home
- 95% English-only · Spanish 3% Arabic 1%
Political lean MEDSL · Sangamon
- 2024 margin
- Toss-up / Even · D 46.6% · R 51.6% · Other 1.8%
- 2008→2024 swing
- -9.3pp toward R · 2008: 4.4pp · 2024: -5.0pp
- All cycles
- 2024: R+5.0 2020: R+4.4 2016: R+9.4 2012: R+8.7 2008: D+4.4
Not yet ingested
- Civics
- —
Market trends
- HPI YoY
- ▼ -59.69%
- Current HPI
- 147.0877
- Rent YoY
- ▲ 12.19%
- Metro
- Springfield, IL
- State GDP YoY
- ▲ 1.59%
- F500 in state
- 60
Industry mix (Fortune 500 HQ in IL)
| Industry | F500 HQs | Revenue |
|---|---|---|
| Insurance | 4 | $201B |
|
||
| Consumer Goods | 4 | $87B |
|
||
| Industrial Machinery | 3 | $64B |
|
||
| Healthcare | 2 | $55B |
|
||
| Retail / Pharmacy | 1 | $148B |
|
||
| Agriculture / Food | 1 | $86B |
|
||
Price history
+56.2% since first listed16 events — show timeline
- 2026-03-31 Relisted — RMLSA as Distributed by MLS Grid
- 2026-03-28 Pending — RMLSA as Distributed by MLS Grid
- 2026-03-17 Listed $50,000 RMLSA as Distributed by MLS Grid
- 2025-12-17 Listing Removed — MRED as Distributed by MLS Grid
- 2025-12-15 Listing Removed — RMLSA as Distributed by MLS Grid
- 2025-09-08 Listed — RMLSA as Distributed by MLS Grid
- 2024-02-08 Listing Removed — RMLSA as Distributed by MLS Grid
- 2023-02-27 Listed — RMLSA as Distributed by MLS Grid
- 2022-02-24 Sold (Public Records) $375,950 Public Records
- 2022-02-24 Sold (Public Records) $375,950 Public Records
- 2020-04-01 Sold (Public Records) $165,000 Public Records
- 2011-07-12 Sold (MLS) $13,400 RMLSA as Distributed by MLS Grid
- 2011-05-20 Listed $13,400 RMLSA as Distributed by MLS Grid
- 2000-08-25 Sold (Public Records) $32,000 Public Records
- 2000-08-23 Sold (MLS) $32,000 RMLSA as Distributed by MLS Grid
- 2000-04-10 Listed $32,000 RMLSA as Distributed by MLS Grid
Property tax history
+1.8%/yrLatest (2024): $1,204 · +4.0% YoY. Source: county tax records.
Cash-flow waterfall
monthlySold comps — $/sqft
last 12 mo · ≤1 miLoading sold comps…