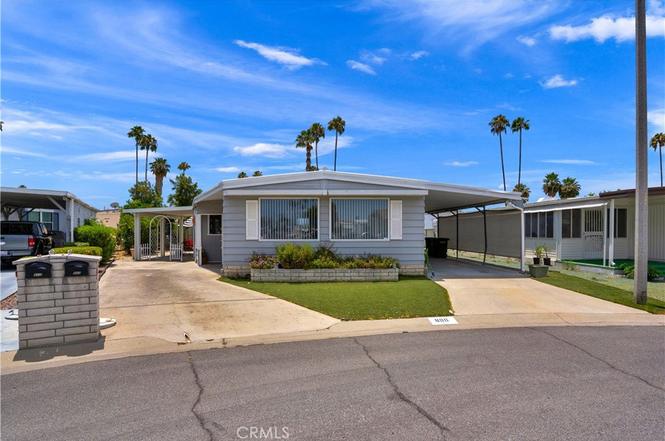
800 San Mateo · Hemet, CA
Flood risk 1/10 · Minimal
- FEMA flood zone
- X (shaded)
- Chance of flooding over 30 yrs
- 0.0%
- Est. flood insurance / yr
- $507 – $1,088
Fire risk 6/10 · Moderate
- Est. fire insurance / yr
- $659 – $1,223
Heat risk 7/10 · Major
- Hot days now (above 104°F)
- 5 days/yr
- Hot days in 30 yrs
- 15 days/yr
Wind risk 1/10 · Minimal
- Chance of severe wind over 30 yrs
- —
Air-quality risk 6/10 · Moderate
- Unhealthy air days now
- 9 days/yr
- Unhealthy air days in 30 yrs
- 11 days/yr
Risk factors via First Street. Map © Google.
Why this score? — see what drove the C- grade
The composite is a weighted blend of 9 inputs, each scored 0–100. Each bar is that input's sub-score; the figure is the points it added to the 100-point composite (weight × sub-score).
- Cash flow +25.8/30.0
- DSCR +8.6/10.0
- 1% rule +7.3/10.0
- Rent growth +2.9/5.0
- Livability +2.6/5.0
- Schools +2.5/10.0
- Condition / age +2.5/5.0
- ARV discount +0.0/15.0
- Appreciation +0.0/10.0
$150,000
🖨 Deal sheet 📄 Offer letter ✓ Due diligence
Listing remarks
OWN YOUR OWN LAND in the Desirable 55+ Community of Sierra Dawn Estates! This well-maintained home offers comfort, functionality, and an active lifestyle in a vibrant senior community featuring multiple clubhouses, sparkling pools, and an abundance of amenities. Step inside to find a thoughtfully designed 2-bedroom, 2-bath home with beautiful bamboo flooring and tile, finished walls, custom blinds, copper piping, and ceiling fans throughout. The spacious bonus room flows off the dining area and opens directly to a peaceful, covered patio - perfect for morning coffee, relaxing evening, or entertaining. At the end of the bonus room is an additional versatile craft room/den, offering flexible
Key facts
- Ceiling fans
- Sparkling pools
- Bamboo flooring
Tags
Property features AI
Finance
- Other: Access via paved city streets
- Financial info: Assessments: Unknown
- HOA & community: Part of Sierra Dawn Estates association; Monthly association fee of $185; Senior community; Association amenities include: spa, clubhouse, banquet/meeting/card rooms, billiard room, recreation/multipurpose room, gym/exercise room, onsite property management, cable TV (services subject to rules); Community has street lighting
Exterior
- Parking: Attached carport with space for 2 vehicles; Has parking
- Security: Pet rules enforced by association
- Utilities: Public/district water; Public sewer; Electricity on property and connected; Natural gas connected; Cable available; Telephone available
- Home design: Manufactured house; Single-story; Planned development community; No common walls
- Construction: Assessor-recorded year built
- Exterior features: Covered front porch and patio; Patio home setting; In-ground heated association pool; Vinyl fencing; Storage building and shed; Has a view
Interior
- Kitchen: Refrigerator; Gas range; Dishwasher; Formal dining area
- Bedrooms: 2 main-level bedrooms; Primary bedroom
- Flooring: Tile; Carpet; Bamboo
- Bathrooms: 2 full bathrooms; Bathrooms with shower-in-tub and walk-in shower
- Heating & cooling: Central furnace heating; Central air conditioning; Wall/window cooling units
- Interior features: Built-in cabinetry; Ceiling fan(s); Sliding glass door(s); Panel doors; Storm doors; Stained glass windows; Window blinds and screens; One-level living; Front door entry; Association spa (heated)
- Laundry & utility: Indoor laundry; Stackable washer/dryer hookups
Neighborhood map
What this means for you Summary
Snapshot
- This is a 2-bed/2.0-bath manufactured listed at $150k.
Deal economics
- At list price, monthly cash flow is $364 ($4k/yr) — positive.
- The deal already cash-flows at list — no discount required.
- Meets the 1% rule at list price ($2k rent vs $150k).
- Cap rate 9.2% vs local median 4.9% in Hemet — top-decile yield for the area; either an underpriced asset or a hidden risk that comps aren't pricing in. Stress-test before assuming the spread holds.
Location & tenants
- Location reads 51/100 on livability (#1,056 in CA) — a working-class tenant base; expect higher turnover. Strengths: housing A+; Watch: crime D+, schools F, amenities F.
- Hemet Unified (suburban): math 19% / reading 41% proficiency, ranked #360 of 517 in CA (top 70%) — families likely to look elsewhere, expect single-tenant / working-renter base with shorter leases; 66% free/reduced lunch — lower-income household profile, screen leases tightly.
- Market conditions: Rents rising (+1.8%/yr); 264 active listings in the ZIP; 40 comparable units currently listed for rent nearby; rentals at typical pace (median 22d on market — plan ~3-4 weeks tenant-placement turnaround); 9,195 units permitted in Riverside County in 2024 (1,512 in 5+ unit buildings).
- This rent runs 45% of the median local income ($49k/yr) — at the standard rent-burdened threshold; future hikes will face affordability resistance.
Forward outlook
- Local home prices are declining (-3.0%/yr); year-one equity from $1k of loan paydown is wiped out by about $4k of value loss. Plan a longer hold.
- Riverside County population projected at +22% by 2050 — long-run rental-demand tailwind backs the buy-and-hold thesis.
Negotiation context
- Only 7 days on market — expect competitive offers; lowballing is unlikely to land.
- Current owner paid $81k; list at $150k implies a 85% gain — meaningful room to come down on a strong offer.
Risks & watch-outs
- Climate carrying-cost: major wildfire risk; extreme-heat days projected 5→15/yr by 2055 (HVAC capex compounding) — expect insurance premiums to compound above CPI over the hold.
Questions for the listing agent
- Built in 1967 — when were the roof, HVAC, electrical panel, plumbing, and water heater last replaced?
- What does the HOA fee cover, when was the last increase, and are there any pending special assessments or reserve-fund shortfalls?
- Is there a deadline driving the sale (1031 exchange, divorce, estate, relocation)? That informs how much negotiation room exists.
- Schools are F-rated, which usually means shorter tenancies and higher turnover. Who's the typical renter profile here, and what's been the actual vacancy rate?
- Crime grade is D in this area — have there been break-ins, vandalism, or insurance claims at this property in the last 3 years? What carrier currently insures it and at what premium?
- What's the average days-on-market for RENTAL listings here right now (not sales)? A rising rental-DOM trend means longer vacancies and softer asking-rent achievability than the comps imply.
- What's the recent tenant-quality profile in this submarket — average credit score on applications, eviction rate, late-payment / NSF rate, and stable-employment percentage? A property-management company in the area should have these aggregated.
- How much new for-sale + rental construction is in the pipeline within 1–3 miles? Heavy new supply typically softens prices + rents 12–24 months out; constrained supply supports both.
Investment metrics
- 1% rule
- 1.23% ✓
- Cap rate
- 9.20%
- Cash-on-cash
- 10.39%
- DSCR
- 1.46
- GRM
- 6.8
CMA / ARV
- ARV (on-the-fly)
- $126,360
- Comps found
- 12
Show comp detail 12 sales within ~0.75 mi
| Address | Dist | Beds/Ba | Sqft | Sold | Price | $/sf | Match |
|---|---|---|---|---|---|---|---|
| 190 Santa Lucia | 0.10mi | 2/2.0 | 1,040 (-4%) | 4mo | $179,000 | $172 | 86 |
| 360 Santa Clara Cir | 0.20mi | 2/2.0 | 1,120 (+4%) | 3mo | $224,000 | $200 | 82 |
| 711 San Mateo Cir | 0.10mi | 2/1.5 | 1,140 (+6%) | 4mo | $93,500 | $82 | 81 |
| 431 San Mateo Cir | 0.19mi | 3/2.0 (+1) | 1,040 (-4%) | 3mo | $118,000 | $113 | 77 |
| 1167 Via Del Mesa | 0.26mi | 2/2.0 | 1,152 (+7%) | 1mo | $135,000 | $117 | 76 |
| 770 S Lyon | 0.22mi | 2/2.0 | 1,152 (+7%) | 3mo | $78,900 | $68 | 76 |
| 220 San Carlos Dr | 0.19mi | 2/1.0 | 1,020 (-6%) | 2mo | $127,000 | $125 | 76 |
| 1111 W Johnston Ave | 0.16mi | 2/2.0 | 1,200 (+11%) | 0mo | $135,000 | $113 | 74 |
| 995 Santa Teresa Way | 0.37mi | 3/2.0 (+1) | 1,056 (-2%) | 3mo | $185,000 | $175 | 71 |
| 1083 Via Del Mesa | 0.29mi | 2/2.0 | 1,200 (+11%) | 3mo | $149,900 | $125 | 65 |
| 460 San Mateo Cir | 0.21mi | 2/1.0 | 940 (-13%) | 3mo | $85,000 | $90 | 62 |
| 575 S Lyon #110 | 0.42mi | 2/2.0 | 940 (-13%) | 2mo | $52,500 | $56 | 57 |
Match score weights: distance 35% · size 25% · config 20% · recency 20%. Top-matched comps best support the ARV.
Projected returns pro-forma
-3.0% appreciation · 1.76% rent growth · sell at horizon
- IRR
- -2.1%
- Equity multiple
- 0.92×
- Total profit
- $-3,351
- Equity at exit
- $22,365
- IRR
- 6.1%
- Equity multiple
- 1.43×
- Total profit
- $18,081
- Equity at exit
- $12,969
Cash invested: $42,000 (down + closing). Projections, not guarantees.
Landlord ↔ Tenant lean methodology
- Overall (STATE)
- 18 Strongly Tenant-Friendly
- State California
- 18 Strongly Tenant-Friendly · D+13
- County
- — inherits STATE
- City
- — inherits STATE
ZIP-level market 92543
- Home prices YoY
- -26.7%
- Rents YoY
- 1.8%
- Active inventory
- 264
- Price-to-rent
- 6.8×
Monthly cashflow live
- Estimated rent
- $1,838 high interval (Pro) →
- Mortgage (P&I)
- −$787
- Tax from tax record
- −$54 /mo · $650/yr
- Insurance
- −$62
- HOA
- −$185
- Vacancy / Maint / Mgmt
- −$386
- Net cashflow
- $364
Break-even live
UW: 25.0% down · 7.5% · 30yr · 1.5% tax · 5.0% vac · 8.0% maint · 8.0% mgmt
Financing live
Cash to close
- Down payment
- $37,500
- Closing costs
- $4,500
- Reserves months
- —
- Total cash needed
- —
Loan-product check · same deal, 3 products live
Conventional
25% down · 7.5% · 30yr
- Down + closing
- —
- Monthly P&I
- —
- Monthly cashflow
- —
- DSCR
- —
- Eligible?
- —
Personal DTI + credit; lowest rate.
DSCR
20% down · 8.5% · 30yr
- Down + closing
- —
- Monthly P&I
- —
- Monthly cashflow
- —
- DSCR
- —
- Eligible?
- —
No personal income docs; deal must DSCR.
Hard money
10% down · 12.0% · 12mo
- Down + closing
- —
- Monthly P&I
- —
- Monthly cashflow
- —
- DSCR
- —
- Eligible?
- —
Short-term bridge; refi at stabilization.
Rent comps 40 comps
| Address | Beds | Baths | Sqft | Rent | $/sqft | DOM | Units | Dist |
|---|---|---|---|---|---|---|---|---|
| 120 Santa Lucia Dr Hemet, CA | 2.0 | 2.0 | 1197 | $1,600 | $1.34 | 43d | 1 | 0.06mi |
| 101 San Mateo Cir Hemet, CA | 2.0 | 2.0 | 1152 | $1,725 | $1.50 | 16d | 1 | 0.08mi |
| 750 Santa Clara Cir Hemet, CA | 2.0 | 2.0 | 800 | $1,400 | $1.75 | 15d | 1 | 0.21mi |
| 1521 W Westmont Ave Hemet, CA | 2.0 | 2.0 | 1197 | $2,000 | $1.67 | 43d | 1 | 0.23mi |
| 893 S Palm Ave Hemet, CA | 2.0 | 2.0 | 720 | $1,375 | $1.91 | 5d | 1 | 0.26mi |
| 611 S Palm Ave Unit K Hemet, CA | 2.0 | 2.0 | 1254 | $1,895 | $1.51 | 7d | 1 | 0.34mi |
| 876 W Whittier Ave Unit 878 Hemet, CA | 2.0 | 2.0 | 1127 | $2,150 | $1.91 | 24d | 1 | 0.34mi |
| 1461 W Mayberry Ave Hemet, CA | 2.0 | 2.0 | 1044 | $1,750 | $1.68 | 43d | 1 | 0.43mi |
| 471 Whitney Dr Hemet, CA | 2.0 | 2.0 | 1085 | $1,800 | $1.66 | 5d | 1 | 0.51mi |
| 1005 S Gilbert St Hemet, CA | 2.0 | 1.5 | 975 | $1,825 | $1.87 | 24d | 2 | 0.51mi |
| 1025 S Gilbert St Hemet, CA | 1.0–2.0 | 1.0–2.0 | 890 | $2,320 | $2.61 | 1d | 8 | 0.51mi |
| 735 S Gilbert St Hemet, CA | 3.0 | 2.0 | 1202 | $2,400 | $2.00 | 43d | 1 | 0.52mi |
| 1850 Amberwood Dr Hemet, CA | 2.0 | 2.0 | 1170 | $1,561 | $1.33 | 43d | 1 | 0.53mi |
| 471 S Simpson Ave Unit D Hemet, CA | 2.0 | 2.0 | 900 | $1,750 | $1.94 | 43d | 1 | 0.56mi |
| 716 Robert Dr Hemet, CA | 3.0 | 2.0 | 1450 | $2,300 | $1.59 | 5d | 1 | 0.64mi |
| 1955 Silver Oak Way Hemet, CA | 3.0 | 2.0 | 1318 | $2,250 | $1.71 | 43d | 1 | 0.71mi |
| 683 Jonquil St Hemet, CA | 3.0 | 2.0 | 1150 | $2,448 | $2.13 | 24d | 1 | 0.75mi |
| 363 S Gilbert St Hemet, CA | 3.0 | 2.0 | 1200 | $1,900 | $1.58 | 4d | 1 | 0.76mi |
| 363 S Gilbert St Unit B Hemet, CA | 3.0 | 2.0 | 1200 | $1,900 | $1.58 | 14d | 1 | 0.76mi |
| 2098 W Acacia Ave Hemet, CA | 1.0–3.0 | 1.0–2.0 | 895 | $2,035 | $2.27 | 1d | 1 | 0.85mi |
| 1711 Pepper Tree Dr Hemet, CA | 2.0 | 2.0 | 864 | $1,675 | $1.94 | 21d | 1 | 0.92mi |
| 853 Douglas Ct Hemet, CA | 2.0 | 2.0 | 1148 | $1,850 | $1.61 | 4d | 1 | 0.93mi |
| 2403 W Acacia Ave Hemet, CA | 2.0 | 2.0 | 910 | $1,995 | $2.19 | 7d | 1 | 0.94mi |
| 2469 W Acacia Ave Hemet, CA | 2.0 | 2.0 | 910 | $1,750 | $1.92 | 24d | 1 | 0.95mi |
| 860 Douglas Ct Hemet, CA | 2.0 | 2.0 | 1114 | $1,850 | $1.66 | 18d | 1 | 0.97mi |
| 1315 W Latham Ave Hemet, CA | 3.0 | 2.5 | 1340 | $2,550 | $1.90 | 43d | 1 | 1.01mi |
| 390 Magnolia Cir Hemet, CA | 2.0 | 2.0 | 1038 | $2,400 | $2.31 | 4d | 1 | 1.02mi |
| 165 N Hamilton Ave Unit 3 Hemet, CA | 1.0 | 1.0 | 768 | $1,450 | $1.89 | 5d | 1 | 1.03mi |
| 165 N Hamilton Ave Unit 4 Hemet, CA | 1.0 | 1.0 | 768 | $1,525 | $1.99 | 21d | 1 | 1.03mi |
| 576 Montecito Ave Unit C Hemet, CA | 2.0 | 2.0 | 861 | $1,850 | $2.15 | 16d | 1 | 1.07mi |
| 250 N Elk St Hemet, CA | 2.0 | 1.0 | 900 | $1,625 | $1.81 | 14d | 1 | 1.12mi |
| 409 E Thornton Ave Hemet, CA | 2.0 | 1.0 | 970 | $1,912 | $1.97 | 2d | 2 | 1.13mi |
| 1354 Jasmine Way Hemet, CA | 2.0 | 2.0 | 1440 | $1,650 | $1.15 | 43d | 1 | 1.15mi |
| 678 Monterey Pl Hemet, CA | 2.0 | 2.0 | 1047 | $1,995 | $1.91 | 43d | 1 | 1.16mi |
| 700 Johnston Ave Unit 708 Hemet, CA | 2.0 | 1.0 | 1000 | $1,600 | $1.60 | 7d | 1 | 1.17mi |
| 640 Vista del Monte Hemet, CA | 3.0 | 2.0 | 1480 | $2,650 | $1.79 | 43d | 1 | 1.18mi |
| 3030 W Acacia Ave Hemet, CA | 1.0–3.0 | 1.0–2.0 | 892 | $1,895 | $2.12 | 1d | 10 | 1.27mi |
| 341 Calle Nogales Hemet, CA | 2.0 | 1.0 | 827 | $1,395 | $1.69 | 43d | 1 | 1.31mi |
| 1270 Rosalia Ave Unit 1 Hemet, CA | 2.0 | 1.0 | 900 | $1,800 | $2.00 | 43d | 1 | 1.32mi |
| 1887 Calle Amargosa Hemet, CA | 2.0 | 1.0 | 827 | $1,545 | $1.87 | 24d | 1 | 1.36mi |
HOA detail
- Monthly dues
- $185 · $2,220/yr
- Likely covers
- pool
Listing history 6 events
-
2026-06-18days on market $150,000 Active 7 DOM
-
2026-06-17days on market $150,000 Active 6 DOM
-
2026-06-16days on market $150,000 Active 5 DOM
-
2026-06-15days on market $150,000 Active 4 DOM
-
2026-06-13remarks 699-char remark
-
2026-06-13$150,000 Active 2 DOM
ⓘ Source: listings_history table (triggers on properties + properties_extension) + one-shot
backfill from property_details.listing_events for pre-trigger history.
Tax reassessment forecast CA · Resets to sale price
- Current annual tax
- $650 · $54/mo
- Projected year-2 tax
- $1,140 · $95/mo
- Expected delta
- +$490/yr (+$41/mo · 75.2%)
ⓘ Screening estimate from a state-policy table — verify with the county assessor before closing.
Climate risk First Street
- Flood 1/10 Low FEMA zone X (shaded) · 0% chance over 30 yrs
- Wildfire 6/10 Major
- Heat 7/10 Severe 5 d/yr ≥104°F today · 15 d/yr by 30 yrs out
- Wind 1/10 Low
- Air quality 6/10 Major 9 unhealthy d/yr today · 11 by 30 yrs out
Nearby sold comps map
Loading sold comps map…
Walkable amenities ~0.75 mi
Loading nearby amenities…
Taxation est. · year 1
- Rental income
- $22,055
- − Mortgage interest
- −$8,402
- − Property taxes
- −$650
- − Insurance
- −$750
- − Repairs & maintenance
- −$1,764
- − Management
- −$1,764
- − HOA
- −$2,220
- − Depreciation
- −$4,364
- Taxable income
- $2,140
- Est. tax owed @ 24.0%
- −$514
- After-tax cash flow
- $3,850/yr
For passive investors: Depreciation is non-cash, so a rental often shows a tax loss while cash-flowing — sheltering income. Rental losses are passive: they offset passive income freely, and up to $25,000/yr can offset ordinary (W-2) income if you actively participate and your MAGI is under $100k (phasing out to $0 by $150k); unused losses carry forward. On sale, claimed depreciation is recaptured at up to 25%, and gains may owe capital-gains tax (a 1031 exchange can defer both). Figures are a year-1 estimate at your 24.0% rate — not tax advice; consult a CPA.
Schools (NCES district)
- District
- Hemet Unified
- NCES district ID
- 0616920
- Math proficiency
- 19% ▼ -3.00%
- Reading proficiency
- 41% ▲ 4.00%
- Median HH income
- $39,962
- Composite
- 25.16/100
- National rank
- #7517
- State rank
- #360 of 517 in CA
Livability — Hemet
- Score
- 51/100
- State rank
- #1056
- US rank
- #25208
Category grades
Schools grade is shown separately in the Schools card above.
Census & demographics
- Census place
- Hemet, CA
- County
- Riverside County · 2,287,001 people
- City population
- 137,670
- Metro
- Riverside-San Bernardino-Ontario, CA
- Population (ZIP)
- 39,937
- Household income
- $49,396
- Rent vs Own
- Severe rent burden
- 2144.0
Population outlook (Riverside County) Hauer SSP2
- Today (2025)
- 2,664,475 people
- By 2030
- 2,802,692 · +5.2%
- By 2040
- 3,050,904 · +14.5%
- By 2050
- 3,256,783 · +22.2%
- By 2075
- 3,655,058 · +37.2%
- By 2100
- 3,766,594 · +41.4%
Race, ethnicity, and origin ACS 2023
- Neighborhood character
- Diverse neighborhood (Simpson 0.61)
- Race & ethnicity
- Hispanic / Latino 54% White 30% Two or more races 18% Black 10% Native American 2% Asian 2%
- Hispanic origin (detail)
- Mexican 48% Puerto Rican 1%
- Common ancestry
- Slovak 1% Romanian 1% Portuguese 1%
- Foreign-born
- 21% · Canada
- Languages at home
- 59% English-only · Spanish 38% Arabic 1% Tagalog/Filipino 1%
Political lean MEDSL · Riverside
- 2024 margin
- Toss-up / Even · D 48.0% · R 49.3% · Other 2.6%
- 2008→2024 swing
- -3.6pp toward R · 2008: 2.3pp · 2024: -1.3pp
- All cycles
- 2024: R+1.3 2020: D+8.0 2016: D+4.3 2012: R+0.4 2008: D+2.3
Not yet ingested
- Civics
- —
Market trends
- HPI YoY
- ▼ -147.46%
- Current HPI
- 405.1277
- Rent YoY
- ▲ 1.76%
- Metro
- Riverside-San Bernardino-Ontario, CA
- State GDP YoY
- ▲ 3.21%
- F500 in state
- 116
Industry mix (Fortune 500 HQ in CA)
| Industry | F500 HQs | Revenue |
|---|---|---|
| Technology | 27 | $1,492B |
|
||
| Financial Services | 3 | $174B |
|
||
| Retail | 3 | $44B |
|
||
| Insurance | 3 | $26B |
|
||
| Media / Entertainment | 2 | $115B |
|
||
| Pharmaceuticals / Biotech | 2 | $62B |
|
||
Price history
+85.2% since first listed2 events — show timeline
- 2026-06-11 Listed $150,000 CRMLS
- 2006-06-28 Sold (Public Records) $81,000 Public Records
Property tax history
+1.5%/yrLatest (2025): $650 · +2.3% YoY. Source: county tax records.
Cash-flow waterfall
monthlySold comps — $/sqft
last 12 mo · ≤1 miLoading sold comps…