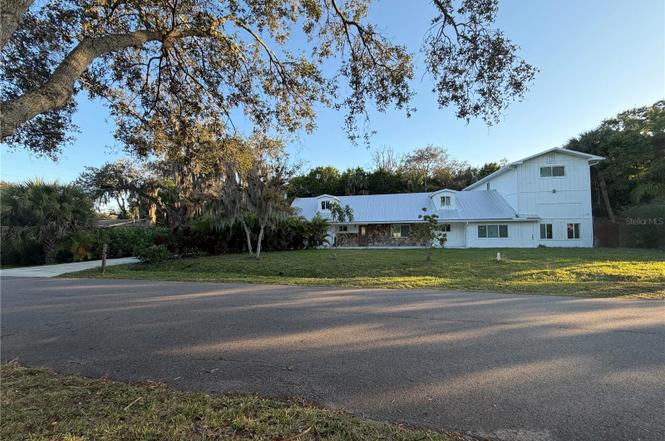
2559 Rainbow Dr · White City, FL
Flood risk 1/10 · Minimal
- FEMA flood zone
- X (unshaded)
- Chance of flooding over 30 yrs
- 0.0%
- Est. flood insurance / yr
- $507 – $1,088
Fire risk 3/10 · Minor
- Est. fire insurance / yr
- $947 – $1,759
Heat risk 10/10 · Severe
- Hot days now (above 106°F)
- 7 days/yr
- Hot days in 30 yrs
- 24 days/yr
Wind risk 10/10 · Severe
- Chance of severe wind over 30 yrs
- 99.0%
Air-quality risk 2/10 · Minimal
- Unhealthy air days now
- 0 days/yr
- Unhealthy air days in 30 yrs
- 1 days/yr
Risk factors via First Street. Map © Google.
Why this score? — see what drove the D grade
The composite is a weighted blend of 9 inputs, each scored 0–100. Each bar is that input's sub-score; the figure is the points it added to the 100-point composite (weight × sub-score).
- Cash flow +15.0/30.0
- ARV discount +7.5/15.0
- DSCR +4.6/10.0
- 1% rule +4.2/10.0
- Livability +3.9/5.0
- Schools +3.7/10.0
- Rent growth +2.5/5.0
- Condition / age +2.5/5.0
- Appreciation +0.0/10.0
$385,999
🖨 Deal sheet 📄 Offer letter ✓ Due diligence
Listing remarks MLS
Beautiful 4 bedroom, 3 bath home home with mother-in-law quarters. Home has been fully updated with granite counter tops, white cabinets, hardwood floors, fresh paint, and ceiling fans in every room. Don't miss this rare gem in a great location.
Key facts
- Large center island
- Custom staircase
- Covered patio
Tags
Property features AI
Finance
- Other: Lot is approximately 0.35 acres (about 1/4 to less than 1/2 acre); Asphalt and concrete road access
- Financial info: No lease restrictions noted
- HOA & community: No HOA indicated
Exterior
- Utilities: Well water; Septic tank sewer; Other utilities
- Home design: Single family residence; Residential property; Fixer condition; Two levels; North-facing
- Construction: Frame construction with wood siding; Metal roof; Block and slab foundation; Built with approximately 4,732 total building area
- Exterior features: Other exterior features
Interior
- Bedrooms: 5 bedrooms
- Flooring: Ceramic tile; Concrete; Laminate; Tile; Vinyl; Wood; Other flooring
- Bathrooms: 4 full bathrooms
- Heating & cooling: Central heating (electric); Central air conditioning
- Interior features: Other interior features
- Laundry & utility: Dedicated laundry room
Neighborhood map
What this means for you Summary
Snapshot
- This is a 4-bed/3.0-bath single-family listed at $386k.
Deal economics
- At list price, monthly cash flow is $121 ($1k/yr) — positive.
- The deal already cash-flows at list — no discount required.
- To meet the 1% rule (rent ≥ 1% of price), the offer needs to be $356k (7.7% below list).
- Recommended offer: $351k (9.0% below list) — sets the bar for market timing.
- Cap rate 6.7% vs local median 3.7% in White City — top-decile yield for the area; either an underpriced asset or a hidden risk that comps aren't pricing in. Stress-test before assuming the spread holds.
Location & tenants
- Location reads 77/100 on livability (#209 in FL, #3,227 nationally) — a middle-class / working-renter tenant base. Strengths: employment A+, housing A+, crime A; Watch: schools D+, amenities F, health & safety D-.
- St. Lucie (urban): math 40% / reading 48% proficiency, ranked #51 of 73 in FL (top 70%) — families likely to look elsewhere, expect single-tenant / working-renter base with shorter leases.
- Market conditions: 66 active listings in the ZIP; 5 comparable units currently listed for rent nearby; rentals at typical pace (median 24d on market — plan ~3-4 weeks tenant-placement turnaround); 4,868 units permitted in St. Lucie County in 2024 (268 in 5+ unit buildings).
Forward outlook
- Local home prices are declining (-3.0%/yr); year-one equity from $3k of loan paydown is wiped out by about $12k of value loss. Plan a longer hold.
- St. Lucie County population projected at +20% by 2050 — long-run rental-demand tailwind backs the buy-and-hold thesis.
Negotiation context
- It's been on market 106 days — a 9% lower offer ($351k) is reasonable based on typical stale-listing flexibility.
- 14 sale attempts since 25y ago; this cycle's ask has dropped $44k (10%) from the opening price — seller is motivated, your offer sets the floor, not the list.
- Current owner paid $279k; 38% above their basis — modest negotiation headroom, anchor on the comps not their cost.
Risks & watch-outs
- Watch-outs: built in 1957 — expect roof / HVAC / electrical / plumbing capex.
- Climate carrying-cost: severe wind risk, 99% chance of damaging wind over 30y; extreme-heat days projected 7→24/yr by 2055 (HVAC capex compounding) — expect insurance premiums to compound above CPI over the hold.
Questions for the listing agent
- It's been on market 106 days. Have you received any prior offers? Is the seller open to a 9% concession, seller financing, or rate buy-down credit?
- Built in 1957 — when were the roof, HVAC, electrical panel, plumbing, and water heater last replaced?
- Why hasn't it sold? Are there any deal-killer items the seller is aware of (foundation, flood, title, zoning, code violations)?
- Is there a deadline driving the sale (1031 exchange, divorce, estate, relocation)? That informs how much negotiation room exists.
- Schools are D-rated, which usually means shorter tenancies and higher turnover. Who's the typical renter profile here, and what's been the actual vacancy rate?
- The area grade is low — what's the realistic commute time and amenity access for the typical tenant pool here? Any planned neighborhood developments (good or bad) we should know about?
- What's the average days-on-market for RENTAL listings here right now (not sales)? A rising rental-DOM trend means longer vacancies and softer asking-rent achievability than the comps imply.
- What's the recent tenant-quality profile in this submarket — average credit score on applications, eviction rate, late-payment / NSF rate, and stable-employment percentage? A property-management company in the area should have these aggregated.
- How much new for-sale + rental construction is in the pipeline within 1–3 miles? Heavy new supply typically softens prices + rents 12–24 months out; constrained supply supports both.
Investment metrics
- 1% rule
- 0.92% ✗
- Cap rate
- 6.67%
- Cash-on-cash
- 1.34%
- DSCR
- 1.06
- GRM
- 9.0
CMA / ARV
No comps found within radius.
Projected returns pro-forma
-3.0% appreciation · 3.0% rent growth · sell at horizon
- IRR
- -14.1%
- Equity multiple
- 0.49×
- Total profit
- $-54,803
- Equity at exit
- $57,554
- IRR
- -5.3%
- Equity multiple
- 0.65×
- Total profit
- $-37,554
- Equity at exit
- $33,374
Cash invested: $108,080 (down + closing). Projections, not guarantees.
Landlord ↔ Tenant lean methodology
- Overall (STATE)
- 87 Strongly Landlord-Friendly
- State Florida
- 87 Strongly Landlord-Friendly · R+3
- County
- — inherits STATE
- City
- — inherits STATE
ZIP-level market 34981
- Home prices YoY
- -9.7%
- Active inventory
- 66
- Price-to-rent
- 9.0×
Monthly cashflow live
- Estimated rent
- $3,562 high interval (Pro) →
- Mortgage (P&I)
- −$2,024
- Tax from tax record
- −$508 /mo · $6,100/yr
- Insurance
- −$161
- HOA
- −$0
- Vacancy / Maint / Mgmt
- −$748
- Net cashflow
- $121
Break-even live
UW: 25.0% down · 7.5% · 30yr · 1.5% tax · 5.0% vac · 8.0% maint · 8.0% mgmt
Financing live
Cash to close
- Down payment
- $96,500
- Closing costs
- $11,580
- Reserves months
- —
- Total cash needed
- —
Loan-product check · same deal, 3 products live
Conventional
25% down · 7.5% · 30yr
- Down + closing
- —
- Monthly P&I
- —
- Monthly cashflow
- —
- DSCR
- —
- Eligible?
- —
Personal DTI + credit; lowest rate.
DSCR
20% down · 8.5% · 30yr
- Down + closing
- —
- Monthly P&I
- —
- Monthly cashflow
- —
- DSCR
- —
- Eligible?
- —
No personal income docs; deal must DSCR.
Hard money
10% down · 12.0% · 12mo
- Down + closing
- —
- Monthly P&I
- —
- Monthly cashflow
- —
- DSCR
- —
- Eligible?
- —
Short-term bridge; refi at stabilization.
Rent comps 5 comps
| Address | Beds | Baths | Sqft | Rent | $/sqft | DOM | Units | Dist |
|---|---|---|---|---|---|---|---|---|
| 6446 NW Polly Ct Port Saint Lucie, FL | 4.0 | 2.0 | 2132 | $2,800 | $1.31 | 23d | 1 | 0.98mi |
| 5464 NW Milner Dr Port Saint Lucie, FL | 4.0 | 2.0 | 2336 | $4,300 | $1.84 | 23d | 1 | 1.27mi |
| 1207 Australian Ave Fort Pierce, FL | 5.0 | 4.0 | 3636 | $5,000 | $1.38 | 23d | 1 | 1.33mi |
| 6619 NW Omega Rd Port Saint Lucie, FL | 3.0 | 2.0 | 2298 | $2,750 | $1.20 | 23d | 1 | 1.47mi |
| 6619 NW Omega Rd Port Saint Lucie, FL | 3.0 | 2.0 | 2298 | $2,750 | $1.20 | 14d | 1 | 1.47mi |
Listing history 50 events
-
2026-06-18days on market $385,999 Active 106 DOM
-
2026-06-17days on market $385,999 Active 105 DOM
-
2026-06-16days on market $385,999 Active 104 DOM
-
2026-06-15days on market $385,999 Active 103 DOM
-
2026-06-14days on market $385,999 Active 101 DOM
-
2026-06-13days on market $385,999 Active 100 DOM
-
2026-06-10days on market $385,999 Active 98 DOM
-
2026-06-09days on market $385,999 Active 97 DOM
-
2026-06-08days on market $385,999 Active 96 DOM
-
2026-06-07days on market $385,999 Active 95 DOM
-
2026-06-05days on market $385,999 Active 92 DOM
-
2026-06-03days on market $385,999 Active 91 DOM
-
2026-06-02pricedays on market $385,999 Active 90 DOM
-
2026-06-01days on market $399,900 Active 89 DOM
-
2026-05-31days on market $399,900 Active 88 DOM
-
2026-05-30days on market $399,900 Active 87 DOM
-
2026-05-22price $351,000
-
2026-05-20price $699,900
-
2026-05-20status Active
-
2026-04-17status Pending
-
2026-04-07price $352,900
-
2026-03-25price $354,999
-
2026-03-25price $357,999
-
2026-03-21price $359,900
-
2026-03-19price $362,999
-
2026-03-17price $367,900
-
2026-03-16price $369,900
-
2026-03-11price $374,374
-
2026-03-10price $379,999
-
2026-03-07price $408,999
-
2026-03-01price $409,900
-
2026-02-20price $409,999
-
2026-02-19price $999,999
-
2026-02-16price $411,900
-
2026-02-11price $414,999
-
2026-02-09price $417,900
-
2026-02-06price $419,999
-
2026-02-03price $421,999
-
2026-02-01price $426,900
-
2026-01-30$429,999 Active
-
2017-06-05soldstatus $279,000
-
2017-05-31soldstatus $279,900 Closed 245-char remark
Show marketing remark (245 chars)
Beautiful 4 bedroom, 3 bath home home with mother-in-law quarters. Home has been fully updated with granite counter tops, white cabinets, hardwood floors, fresh paint, and ceiling fans in every room. Don't miss this rare gem in a great location.
-
2017-03-22status Pending 245-char remark
Show marketing remark (245 chars)
Beautiful 4 bedroom, 3 bath home home with mother-in-law quarters. Home has been fully updated with granite counter tops, white cabinets, hardwood floors, fresh paint, and ceiling fans in every room. Don't miss this rare gem in a great location.
-
2017-03-10price $279,900 245-char remark
Show marketing remark (245 chars)
Beautiful 4 bedroom, 3 bath home home with mother-in-law quarters. Home has been fully updated with granite counter tops, white cabinets, hardwood floors, fresh paint, and ceiling fans in every room. Don't miss this rare gem in a great location.
-
2017-03-10$269,900 Active 245-char remark
Show marketing remark (245 chars)
Beautiful 4 bedroom, 3 bath home home with mother-in-law quarters. Home has been fully updated with granite counter tops, white cabinets, hardwood floors, fresh paint, and ceiling fans in every room. Don't miss this rare gem in a great location.
-
2016-09-27soldstatus $121,000
-
2016-09-16soldstatus $121,000 Closed 155-char remark
Show marketing remark (155 chars)
VERY SPACIOUS HOME WITH PLENTY OF POTENTIAL, UPSTAIRS SELF CONTAINED MOTHER IN LAWS QUARTERS , LOCATED IN DESIRABLE NORTH FORK AREA , FIREPLACE , NEEDS TLC
-
2016-08-20status Pending 155-char remark
Show marketing remark (155 chars)
VERY SPACIOUS HOME WITH PLENTY OF POTENTIAL, UPSTAIRS SELF CONTAINED MOTHER IN LAWS QUARTERS , LOCATED IN DESIRABLE NORTH FORK AREA , FIREPLACE , NEEDS TLC
-
2016-08-04$134,900 Active 155-char remark
Show marketing remark (155 chars)
VERY SPACIOUS HOME WITH PLENTY OF POTENTIAL, UPSTAIRS SELF CONTAINED MOTHER IN LAWS QUARTERS , LOCATED IN DESIRABLE NORTH FORK AREA , FIREPLACE , NEEDS TLC
-
2016-07-27soldstatus $95,000
ⓘ Source: listings_history table (triggers on properties + properties_extension) + one-shot
backfill from property_details.listing_events for pre-trigger history.
Tax reassessment forecast FL · Resets to sale price
- Current annual tax
- $6,100 · $508/mo
- Projected year-2 tax
- $6,100 · $508/mo
- Expected delta
- $0/yr ($0/mo · -0.0%)
ⓘ Screening estimate from a state-policy table — verify with the county assessor before closing.
Climate risk First Street
- Flood 1/10 Low FEMA zone X (unshaded) · 0% chance over 30 yrs
- Wildfire 3/10 Moderate
- Heat 10/10 Extreme 7 d/yr ≥106°F today · 24 d/yr by 30 yrs out
- Wind 10/10 Extreme 99% chance of damaging wind over 30 yrs
- Air quality 2/10 Low 0 unhealthy d/yr today · 1 by 30 yrs out
Nearby sold comps map
Loading sold comps map…
Walkable amenities ~0.75 mi
Loading nearby amenities…
Taxation est. · year 1
- Rental income
- $42,743
- − Mortgage interest
- −$21,622
- − Property taxes
- −$6,100
- − Insurance
- −$1,930
- − Repairs & maintenance
- −$3,419
- − Management
- −$3,419
- − Depreciation
- −$11,229
- Taxable loss
- −$4,977
- Est. tax savings @ 24.0%
- +$1,194
- After-tax cash flow
- $2,641/yr
For passive investors: Depreciation is non-cash, so a rental often shows a tax loss while cash-flowing — sheltering income. Rental losses are passive: they offset passive income freely, and up to $25,000/yr can offset ordinary (W-2) income if you actively participate and your MAGI is under $100k (phasing out to $0 by $150k); unused losses carry forward. On sale, claimed depreciation is recaptured at up to 25%, and gains may owe capital-gains tax (a 1031 exchange can defer both). Figures are a year-1 estimate at your 24.0% rate — not tax advice; consult a CPA.
Schools (NCES district)
- District
- St. Lucie
- NCES district ID
- 1201770
- Math proficiency
- 40% ▼ -11.00%
- Reading proficiency
- 48% ▼ -4.00%
- Median HH income
- $44,737
- Composite
- 37.28/100
- National rank
- #4449
- State rank
- #51 of 73 in FL
Livability — White City
- Score
- 77/100
- State rank
- #209
- US rank
- #3227
Category grades
Schools grade is shown separately in the Schools card above.
Census & demographics
- Census place
- White City, FL
- Population (ZIP)
- 6,167
Population outlook (St. Lucie County) Hauer SSP2
- Today (2025)
- 338,016 people
- By 2030
- 355,687 · +5.2%
- By 2040
- 385,521 · +14.1%
- By 2050
- 406,106 · +20.1%
- By 2075
- 441,054 · +30.5%
- By 2100
- 436,885 · +29.2%
Race, ethnicity, and origin ACS 2023
- Neighborhood character
- Diverse neighborhood (Simpson 0.62)
- Race & ethnicity
- White 53% Black 24% Hispanic / Latino 21% Two or more races 8%
- Hispanic origin (detail)
- Mexican 4% Puerto Rican 8% Cuban 3% Dominican 1%
- Common ancestry
- Hispanic 7% Italian 4% Lithuanian 3%
- Foreign-born
- 11% · Canada
- Languages at home
- 78% English-only · French/Haitian/Cajun 9% Spanish 8% Other Indo-European 1%
Political lean MEDSL · St. Lucie
- 2024 margin
- Lean R (+9.1) · D 45.1% · R 54.2%
- 2008→2024 swing
- -21.2pp toward R · 2008: 12.1pp · 2024: -9.1pp
- All cycles
- 2024: R+9.1 2020: R+1.6 2016: R+2.5 2012: D+7.9 2008: D+12.1
Not yet ingested
- Civics
- —
Market trends
- HPI YoY
- ▼ -44.06%
- Current HPI
- 408.6633
- Rent YoY
- —
- Metro
- —
- State GDP YoY
- ▲ 3.28%
- F500 in state
- 36
Industry mix (Fortune 500 HQ in FL)
| Industry | F500 HQs | Revenue |
|---|---|---|
| Industrial Technology | 2 | $29B |
|
||
| Insurance | 2 | $17B |
|
||
| Retail | 1 | $60B |
|
||
| Technology Distribution | 1 | $58B |
|
||
| Homebuilding | 1 | $35B |
|
||
| Technology Manufacturing | 1 | $35B |
|
||
Price history
+137.3% since first listed58 events — show timeline
- 2026-05-22 Price Changed $351,000 Stellar MLS as Distributed by MLS Grid
- 2026-05-20 Price Changed $699,900 Stellar MLS as Distributed by MLS Grid
- 2026-05-20 Relisted — Stellar MLS as Distributed by MLS Grid
- 2026-04-17 Pending — Stellar MLS as Distributed by MLS Grid
- 2026-04-07 Price Changed $352,900 Stellar MLS as Distributed by MLS Grid
- 2026-03-25 Price Changed $354,999 Stellar MLS as Distributed by MLS Grid
- 2026-03-25 Price Changed $357,999 Stellar MLS as Distributed by MLS Grid
- 2026-03-21 Price Changed $359,900 Stellar MLS as Distributed by MLS Grid
- 2026-03-19 Price Changed $362,999 Stellar MLS as Distributed by MLS Grid
- 2026-03-17 Price Changed $367,900 Stellar MLS as Distributed by MLS Grid
- 2026-03-16 Price Changed $369,900 Stellar MLS as Distributed by MLS Grid
- 2026-03-11 Price Changed $374,374 Stellar MLS as Distributed by MLS Grid
- 2026-03-10 Price Changed $379,999 Stellar MLS as Distributed by MLS Grid
- 2026-03-07 Price Changed $408,999 Stellar MLS as Distributed by MLS Grid
- 2026-03-01 Price Changed $409,900 Stellar MLS as Distributed by MLS Grid
- 2026-02-20 Price Changed $409,999 Stellar MLS as Distributed by MLS Grid
- 2026-02-19 Price Changed $999,999 Stellar MLS as Distributed by MLS Grid
- 2026-02-16 Price Changed $411,900 Stellar MLS as Distributed by MLS Grid
- 2026-02-11 Price Changed $414,999 Stellar MLS as Distributed by MLS Grid
- 2026-02-09 Price Changed $417,900 Stellar MLS as Distributed by MLS Grid
- 2026-02-06 Price Changed $419,999 Stellar MLS as Distributed by MLS Grid
- 2026-02-03 Price Changed $421,999 Stellar MLS as Distributed by MLS Grid
- 2026-02-01 Price Changed $426,900 Stellar MLS as Distributed by MLS Grid
- 2026-01-30 Listed $429,999 Stellar MLS as Distributed by MLS Grid
- 2017-06-05 Sold (Public Records) $279,000 Public Records
- 2017-05-31 Sold (MLS) $279,900 Beaches MLS
- 2017-03-22 Pending — Beaches MLS
- 2017-03-10 Price Changed $279,900 Beaches MLS
- 2017-03-10 Listed $269,900 Beaches MLS
- 2016-09-27 Sold (Public Records) $121,000 Public Records
- 2016-09-16 Sold (MLS) $121,000 Beaches MLS
- 2016-08-20 Pending — Beaches MLS
- 2016-08-04 Listed $134,900 Beaches MLS
- 2016-07-27 Sold (Public Records) $95,000 Public Records
- 2014-12-04 Listing Removed — Beaches MLS
- 2014-12-04 Listing Removed — Beaches MLS
- 2014-10-18 Listing Removed — Beaches MLS
- 2013-12-03 Listing Removed — Beaches MLS
- 2013-09-22 Listing Removed — Beaches MLS
- 2013-09-22 Listing Removed — Beaches MLS
- 2013-09-22 Listing Removed — Beaches MLS
- 2011-02-02 Sold (Public Records) $100,000 Public Records
- 2011-01-21 Sold (MLS) $100,000 Beaches MLS
- 2010-11-22 Listing Removed — Beaches MLS
- 2010-09-27 Listed $94,500 Beaches MLS
- 2009-06-06 Listed $154,000 Beaches MLS
- 2009-01-01 Listed $98,900 Beaches MLS
- 2008-04-09 Listed $109,900 Beaches MLS
- 2006-01-13 Listed $329,000 Beaches MLS
- 2004-09-21 Listed $279,000 Beaches MLS
- 2004-01-19 Listed $279,000 Beaches MLS
- 2002-10-11 Listed $265,000 Beaches MLS
- 2002-02-14 Sold (Public Records) $140,000 Public Records
- 2002-02-13 Listing Removed — Beaches MLS
- 2002-02-12 Sold (MLS) $140,000 Beaches MLS
- 2002-02-05 Listing Removed — Beaches MLS
- 2001-08-21 Listed $147,900 Beaches MLS
- 2001-08-21 Listed $147,900 Beaches MLS
Property tax history
+9.4%/yrLatest (2025): $6,100 · +5.2% YoY. Source: county tax records.
Cash-flow waterfall
monthlySold comps — $/sqft
last 12 mo · ≤1 miLoading sold comps…