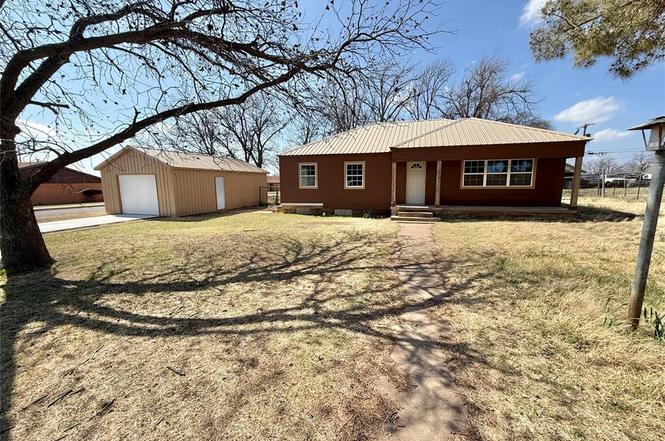
1601 C St · Snyder, OK
Flood risk 1/10 · Minimal
- FEMA flood zone
- X
- Chance of flooding over 30 yrs
- 0.0%
- Est. flood insurance / yr
- $435 – $905
Fire risk 3/10 · Minor
- Est. fire insurance / yr
- $2,463 – $4,575
Heat risk 6/10 · Moderate
- Hot days now (above threshold)
- 7 days/yr
- Hot days in 30 yrs
- 20 days/yr
Wind risk No data
- Chance of severe wind over 30 yrs
- —
Air-quality risk No data
- Unhealthy air days now
- —
- Unhealthy air days in 30 yrs
- —
Risk factors via First Street. Map © Google.
Why this score? — see what drove the D grade
The composite is a weighted blend of 9 inputs, each scored 0–100. Each bar is that input's sub-score; the figure is the points it added to the 100-point composite (weight × sub-score).
- Cash flow +13.0/30.0
- ARV discount +6.2/15.0
- Appreciation +5.0/10.0
- DSCR +3.9/10.0
- 1% rule +3.7/10.0
- Livability +3.0/5.0
- Rent growth +2.5/5.0
- Condition / age +2.5/5.0
- Schools +1.8/10.0
$115,000
🖨 Deal sheet (PDF) 📄 Offer letter ✓ Due diligence
Listing remarks
Charming Remodeled Home with New Garage/Shop Beautifully updated 2-bedroom, 1-bath single-family home featuring a brand-new 16x30 detached garage/shop—perfect for projects, storage, or hobby space. The home offers a fresh new metal roof, newly painted interior and exterior, and updated laminate flooring with plush carpet in the bedrooms. Enjoy a spacious backyard ideal for outdoor living, complete with a storm shelter for peace of mind. The inviting front porch adds great curb appeal and a comfortable spot to relax. Move-in ready with modern updates throughout, this property blends comfort, functionality, and value.
Key facts
- Spacious backyard
- Front porch
- Storm shelter
Tags
Property features AI
Finance
- Other: Living area listed as 1,176 (assessor); Listed price information not included per instructions
- Financial info: Loan qualifying available; Not assumable
- HOA & community: No mandatory association dues
Exterior
- Parking: 1 garage space
- Utilities: No utilities details provided
- Home design: Single family residence; One-story; Residential property
- Construction: Frame construction; Metal roof; Built (existing)
- Exterior features: Covered porch; Lot features: Other; Homestead eligible
Interior
- Kitchen: No kitchen appliance details provided
- Bedrooms: 2 bedrooms
- Flooring: No flooring details provided
- Bathrooms: 1 full bathroom
- Heating & cooling: Other heating; Window unit(s) for cooling
- Interior features: One living area; No fireplace; Storm shelter; Existing property
- Laundry & utility: No laundry details provided; Slab foundation
Neighborhood map
What this means for you Summary
Snapshot
- This is a 2-bed/1.0-bath single-family listed at $115k.
Deal economics
- At list price, monthly cash flow is $-6 ($-70/yr) — negative.
- To cash-flow at today's rent, offer at most $114k (0.7% below list).
- To meet the 1% rule (rent ≥ 1% of price), the offer needs to be $100k (13.2% below list).
- Recommended offer: $100k (13.2% below list) — sets the bar for 1% rule.
Location & tenants
- Location reads 59/100 on livability (#397 in OK) — a working-class tenant base; expect higher turnover. Strengths: cost of living A+, housing A+; Watch: amenities F, commute F, employment F.
- Snyder (rural): math 15% / reading 21% proficiency, ranked #446 of 513 in OK (top 87%) — low school quality limits family demand, transient renter base, plan for 1-2y turnover; 62% free/reduced lunch — lower-income household profile, screen leases tightly.
- Zoned schools: John D Moeller Es (140 students, 0% FRL); Snyder Es (math 12% / reading 17%, grade F, #234 of 345 statewide, top 72%, 172 students, 0% FRL); Snyder Hs (math 5% / reading 10%, grade F, #420 of 447 statewide, top 95%, 133 students, 0% FRL) — zoned schools average 0% FRL vs 62% district-wide (62 pts lower); this property's tenant base skews higher-income than the district average.
- Market conditions: 9 active listings in the ZIP.
Forward outlook
- In year one you build about $4k of equity ($795 loan paydown + $3k appreciation (3.0% local appreciation)).
- At projected returns (3.0% appreciation + 3.0% rent growth), your $32k cash investment doubles in ~7 years — after that, you're playing with house money.
- By year 8, paydown + projected appreciation supports a ~$31k cash-out refi (75% LTV) — recoverable capital for the next deal without selling this one.
Negotiation context
- It's been on market 103 days — a 9% lower offer ($105k) is reasonable based on typical stale-listing flexibility.
- Current owner paid $25k; list at $115k implies a 360% gain — meaningful room to come down on a strong offer.
Risks & watch-outs
- Watch-outs: built in 1930 — expect roof / HVAC / electrical / plumbing capex.
- Climate carrying-cost: extreme-heat days projected 7→20/yr by 2055 (HVAC capex compounding) — expect insurance premiums to compound above CPI over the hold.
Questions for the listing agent
- What do current leases actually rent for vs. the listed asking? Can we see a recent rent roll and the last 12 months of T-12 income?
- It's been on market 103 days. Have you received any prior offers? Is the seller open to a 13% concession, seller financing, or rate buy-down credit?
- Built in 1930 — when were the roof, HVAC, electrical panel, plumbing, and water heater last replaced?
- Why hasn't it sold? Are there any deal-killer items the seller is aware of (foundation, flood, title, zoning, code violations)?
- Is there a deadline driving the sale (1031 exchange, divorce, estate, relocation)? That informs how much negotiation room exists.
- Schools are F-rated, which usually means shorter tenancies and higher turnover. Who's the typical renter profile here, and what's been the actual vacancy rate?
- The area grade is low — what's the realistic commute time and amenity access for the typical tenant pool here? Any planned neighborhood developments (good or bad) we should know about?
- What's the average days-on-market for RENTAL listings here right now (not sales)? A rising rental-DOM trend means longer vacancies and softer asking-rent achievability than the comps imply.
- What's the recent tenant-quality profile in this submarket — average credit score on applications, eviction rate, late-payment / NSF rate, and stable-employment percentage? A property-management company in the area should have these aggregated.
- How much new for-sale + rental construction is in the pipeline within 1–3 miles? Heavy new supply typically softens prices + rents 12–24 months out; constrained supply supports both.
Investment metrics
- 1% rule
- 0.87% ✗
- Cap rate
- 6.23%
- Cash-on-cash
- -0.22%
- DSCR
- 0.99
- GRM
- 9.6
CMA / ARV
- ARV (on-the-fly)
- $111,720
- Comps found
- 5
Show comp detail 5 sales within ~0.75 mi
| Address | Dist | Beds/Ba | Sqft | Sold | Price | $/sf | Match |
|---|---|---|---|---|---|---|---|
| 410 16th St | 0.13mi | 3/1.5 (+1) | 1,152 (-2%) | 19mo | $109,000 | $95 | 68 |
| 105 W 12th St | 0.36mi | 3/1.5 (+1) | 1,100 (-6%) | 4mo | $114,880 | $104 | 62 |
| 623 10th St | 0.52mi | 2/2.0 | 1,200 (+2%) | 9mo | $16,000 | $13 | 61 |
| 610 7th St | 0.67mi | 3/1.0 (+1) | 1,170 (-0%) | 21mo | $125,000 | $107 | 45 |
| 1002 G St | 0.51mi | 3/2.0 (+1) | 1,300 (+10%) | 12mo | $60,000 | $46 | 39 |
Match score weights: distance 35% · size 25% · config 20% · recency 20%. Top-matched comps best support the ARV.
Projected returns pro-forma
3.0% appreciation · 3.0% rent growth · sell at horizon
- IRR
- 7.3%
- Equity multiple
- 1.42×
- Total profit
- $13,497
- Equity at exit
- $51,709
- IRR
- 10.0%
- Equity multiple
- 2.51×
- Total profit
- $48,608
- Equity at exit
- $79,690
Cash invested: $32,200 (down + closing). Projections, not guarantees.
Landlord ↔ Tenant lean methodology
- Overall (STATE)
- 83 Strongly Landlord-Friendly
- State Oklahoma
- 83 Strongly Landlord-Friendly · R+20
- County
- — inherits STATE
- City
- — inherits STATE
ZIP-level market 73566
- Active inventory
- 9
- Price-to-rent
- 9.6×
Monthly cashflow live
- Estimated rent
- $999 medium interval (Pro) →
- Mortgage (P&I)
- −$603
- Tax est. 1.5%
- −$144 /mo · $1,725/yr
- Insurance
- −$48
- HOA
- −$0
- Vacancy / Maint / Mgmt
- −$210
- Net cashflow
- $-6
Break-even live
Sensitivity live
| Price | -10% $74 | -5% $34 | +0% $-6 | +5% $-46 | +10% $-85 |
|---|---|---|---|---|---|
| Rent | -10% $-85 | -5% $-45 | +0% $-6 | +5% $34 | +10% $73 |
| Rate | -1.0pp $52 | -0.5pp $23 | base $-6 | +0.5pp $-36 | +1.0pp $-66 |
UW: 25.0% down · 7.5% · 30yr · 1.5% tax · 5.0% vac · 8.0% maint · 8.0% mgmt
Financing live
Cash to close
- Down payment
- $28,750
- Closing costs
- $3,450
- Reserves months
- —
- Total cash needed
- —
Loan-product check · same deal, 3 products live
Conventional
25% down · 7.5% · 30yr
- Down + closing
- —
- Monthly P&I
- —
- Monthly cashflow
- —
- DSCR
- —
- Eligible?
- —
Personal DTI + credit; lowest rate.
DSCR
20% down · 8.5% · 30yr
- Down + closing
- —
- Monthly P&I
- —
- Monthly cashflow
- —
- DSCR
- —
- Eligible?
- —
No personal income docs; deal must DSCR.
Hard money
10% down · 12.0% · 12mo
- Down + closing
- —
- Monthly P&I
- —
- Monthly cashflow
- —
- DSCR
- —
- Eligible?
- —
Short-term bridge; refi at stabilization.
Listing history 19 events
-
2026-06-21days on market $115,000 Active 103 DOM
-
2026-06-19days on market $115,000 Active 101 DOM
-
2026-06-18days on market $115,000 Active 100 DOM
-
2026-06-17days on market $115,000 Active 99 DOM
-
2026-06-16days on market $115,000 Active 98 DOM
-
2026-06-15days on market $115,000 Active 97 DOM
-
2026-06-14days on market $115,000 Active 95 DOM
-
2026-06-13days on market $115,000 Active 94 DOM
-
2026-06-10days on market $115,000 Active 92 DOM
-
2026-06-09days on market $115,000 Active 91 DOM
-
2026-06-08days on market $115,000 Active 90 DOM
-
2026-06-07days on market $115,000 Active 89 DOM
-
2026-06-05days on market $115,000 Active 86 DOM
-
2026-06-02days on market $115,000 Active 84 DOM
-
2026-06-01days on market $115,000 Active 83 DOM
-
2026-05-31days on market $115,000 Active 82 DOM
-
2026-05-30days on market $115,000 Active 81 DOM
-
2026-03-10$115,000 Active
-
2001-07-30soldstatus $25,000
ⓘ Source: listings_history table (triggers on properties + properties_extension) + one-shot
backfill from property_details.listing_events for pre-trigger history.
Climate risk First Street
- Flood 1/10 Low FEMA zone X · 0% chance over 30 yrs
- Wildfire 3/10 Moderate
- Heat 6/10 Major
Nearby sold comps map
Loading sold comps map…
Walkable amenities ~0.75 mi
Loading nearby amenities…
Taxation est. · year 1
- Rental income
- $11,983
- − Mortgage interest
- −$6,442
- − Property taxes
- −$1,725
- − Insurance
- −$575
- − Repairs & maintenance
- −$959
- − Management
- −$959
- − Depreciation
- −$3,345
- Taxable loss
- −$2,021
- Est. tax savings @ 24.0%
- +$485
- After-tax cash flow
- $415/yr
For passive investors: Depreciation is non-cash, so a rental often shows a tax loss while cash-flowing — sheltering income. Rental losses are passive: they offset passive income freely, and up to $25,000/yr can offset ordinary (W-2) income if you actively participate and your MAGI is under $100k (phasing out to $0 by $150k); unused losses carry forward. On sale, claimed depreciation is recaptured at up to 25%, and gains may owe capital-gains tax (a 1031 exchange can defer both). Figures are a year-1 estimate at your 24.0% rate — not tax advice; consult a CPA.
Schools (NCES district)
- District
- Snyder
- NCES district ID
- 4027930
- Math proficiency
- 15% ▲ 1.00%
- Reading proficiency
- 21% ▲ 3.00%
- Median HH income
- $32,783
- Composite
- 17.93/100
- National rank
- #14099
- State rank
- #446 of 513 in OK
Livability — Snyder
- Score
- 59/100
- State rank
- #397
- US rank
- #20273
Category grades
Schools grade is shown separately in the Schools card above.
Census & demographics
- Census place
- Snyder, OK
- Population (ZIP)
- 1,502
Population outlook (Kiowa County) Hauer SSP2
- Today (2025)
- 8,842 people
- By 2030
- 8,733 · -1.2%
- By 2040
- 8,641 · -2.3%
- By 2050
- 8,758 · -1.0%
- By 2075
- 9,894 · +11.9%
- By 2100
- 11,194 · +26.6%
Race, ethnicity, and origin ACS 2023
- Neighborhood character
- Predominantly White (74%)
- Race & ethnicity
- White 74% Hispanic / Latino 16% Two or more races 10% Native American 2% Black 2%
- Hispanic origin (detail)
- Mexican 11%
- Common ancestry
- Slovak 4% Serbian 2% Iranian 2%
- Foreign-born
- 2% · Canada
- Languages at home
- 92% English-only · Spanish 5% German/W. Germanic 1% Other Asian/Pacific 1%
Political lean MEDSL · Kiowa
- 2024 margin
- Solid R (+58.3) · D 20.1% · R 78.4% · Other 1.6%
- 2008→2024 swing
- -23.5pp toward R · 2008: -34.8pp · 2024: -58.3pp
- All cycles
- 2024: R+58.3 2020: R+57.6 2016: R+52.4 2012: R+35.4 2008: R+34.8
Not yet ingested
- Civics
- —
Market trends
- HPI YoY
- —
- Current HPI
- —
- Rent YoY
- —
- Metro
- —
- State GDP YoY
- ▲ 1.55%
- F500 in state
- 6
Industry mix (Fortune 500 HQ in OK)
| Industry | F500 HQs | Revenue |
|---|---|---|
| Energy | 3 | $48B |
|
||
Price history
+360.0% since first listed2 events — show timeline
- 2026-03-10 Listed $115,000 MLSOK
- 2001-07-30 Sold (Public Records) $25,000 Public Records
Property tax history
+1.2%/yrLatest (2025): $70 · +1.4% YoY. Source: county tax records.
Cash-flow waterfall
monthlySold comps — $/sqft
last 12 mo · ≤1 miLoading sold comps…