2035 S 5th St · Hartsville, SC
Flood risk 1/10 · Minimal
- FEMA flood zone
- X (unshaded)
- Chance of flooding over 30 yrs
- 0.0%
- Est. flood insurance / yr
- $507 – $1,088
Fire risk 5/10 · Moderate
- Est. fire insurance / yr
- $783 – $1,453
Heat risk 7/10 · Major
- Hot days now (above 108°F)
- 7 days/yr
- Hot days in 30 yrs
- 16 days/yr
Wind risk 7/10 · Major
- Chance of severe wind over 30 yrs
- 78.0%
Air-quality risk 2/10 · Minimal
- Unhealthy air days now
- 0 days/yr
- Unhealthy air days in 30 yrs
- 1 days/yr
Risk factors via First Street. Map © Google.
Why this score? — see what drove the C- grade
The composite is a weighted blend of 9 inputs, each scored 0–100. Each bar is that input's sub-score; the figure is the points it added to the 100-point composite (weight × sub-score).
- Cash flow +20.4/30.0
- ARV discount +7.5/15.0
- DSCR +6.5/10.0
- 1% rule +5.4/10.0
- Livability +3.0/5.0
- Schools +2.7/10.0
- Rent growth +2.5/5.0
- Condition / age +2.5/5.0
- Appreciation +0.0/10.0
$119,000
🖨 Deal sheet 📄 Offer letter ✓ Due diligence
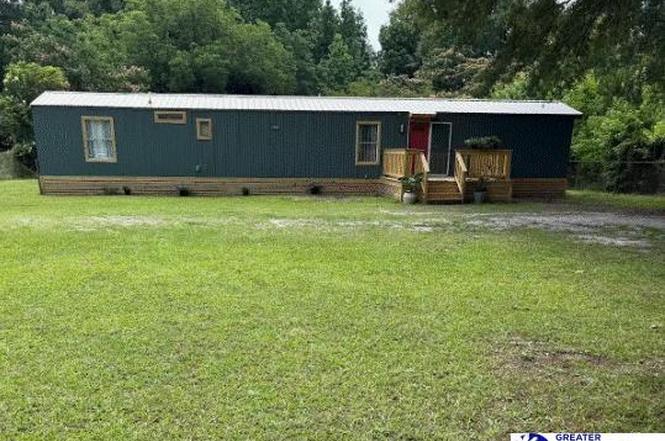
Listing remarks
Beautifully renovated manufactured home featuring 2 bedrooms and 2 full baths. This property offers an updated interior throughout and sits on a large, open yard. Located just minutes from downtown Hartsville, you’ll enjoy quick access to shopping, dining, and local conveniences. Completely renovated and priced to sell don’t miss your opportunity to own this charming property.
Key facts
- Large open yard
- Updated interior
- 0.42 acre lot
Tags
Property features AI
Exterior
- Utilities: Public water; Septic tank sewer
- Home design: Manufactured home; Residential property
- Construction: Metal roof; Above-grade finished area: 1,280; Property sits on 0.42 acre lot
- Exterior features: Deck
Interior
- Kitchen: Range; Refrigerator
- Bathrooms: 2 full bathrooms
- Heating & cooling: Heat pump and central heating; Central air; Ceiling fan(s)
- Interior features: Range; Refrigerator; Crawl space basement
Neighborhood map
What this means for you Summary
Snapshot
- This is a 2-bed/2.0-bath other listed at $119k.
Deal economics
- At list price, monthly cash flow is $154 ($2k/yr) — positive.
- The deal already cash-flows at list — no discount required.
- Meets the 1% rule at list price ($1k rent vs $119k).
- Cap rate 7.8% vs local median 3.7% in Hartsville — top-decile yield for the area; either an underpriced asset or a hidden risk that comps aren't pricing in. Stress-test before assuming the spread holds.
Location & tenants
- Location reads 60/100 on livability (#224 in SC) — a middle-class / working-renter tenant base. Strengths: cost of living A+, housing A+, health & safety B+; Watch: crime F, amenities F, commute F.
- Darlington 01 (town): math 27% / reading 37% proficiency, ranked #52 of 80 in SC (top 65%) — families likely to look elsewhere, expect single-tenant / working-renter base with shorter leases; 75% free/reduced lunch — lower-income household profile, screen leases tightly.
- Zoned schools: Bay Road Elementary (math 20%, 540 students, 100% FRL); Hartsville Middle (math 23% / reading 31%, grade F, #153 of 229 statewide, top 68%, 921 students, 100% FRL); Hartsville High (math 42% / reading 80%, grade C+, #105 of 196 statewide, top 54%, 1,133 students, 100% FRL) — zoned schools average 100% FRL vs 75% district-wide (25 pts higher); higher-poverty schools than district average — tighter screening recommended.
- Zoned-school proficiency averages 44% at this address vs 32% district-wide (+12 pts) — the actual schools serving this property are materially stronger than the Darlington 01 average implies; a family-tenant draw the district grade alone would hide.
- Market conditions: 156 active listings in the ZIP; 195 units permitted in Darlington County in 2024 (0 in 5+ unit buildings).
Forward outlook
- Local home prices are declining (-3.0%/yr); year-one equity from $823 of loan paydown is wiped out by about $4k of value loss. Plan a longer hold.
- Darlington County population projected at -18% by 2050 — secular population decline; favor cash flow + early exit over multi-decade hold.
Negotiation context
- Only 8 days on market — expect competitive offers; lowballing is unlikely to land.
- Current owner paid $13k; list at $119k implies a 815% gain — meaningful room to come down on a strong offer.
Risks & watch-outs
- Climate carrying-cost: major wind risk, 78% chance of damaging wind over 30y; moderate wildfire risk; extreme-heat days projected 7→16/yr by 2055 (HVAC capex compounding) — expect insurance premiums to compound above CPI over the hold.
Questions for the listing agent
- Is there a deadline driving the sale (1031 exchange, divorce, estate, relocation)? That informs how much negotiation room exists.
- Crime grade is F in this area — have there been break-ins, vandalism, or insurance claims at this property in the last 3 years? What carrier currently insures it and at what premium?
- What's the average days-on-market for RENTAL listings here right now (not sales)? A rising rental-DOM trend means longer vacancies and softer asking-rent achievability than the comps imply.
- What's the recent tenant-quality profile in this submarket — average credit score on applications, eviction rate, late-payment / NSF rate, and stable-employment percentage? A property-management company in the area should have these aggregated.
- How much new for-sale + rental construction is in the pipeline within 1–3 miles? Heavy new supply typically softens prices + rents 12–24 months out; constrained supply supports both.
Investment metrics
- 1% rule
- 1.04% ✓
- Cap rate
- 7.84%
- Cash-on-cash
- 5.54%
- DSCR
- 1.25
- GRM
- 8.0
CMA / ARV
No comps found within radius.
Projected returns pro-forma
-3.0% appreciation · 3.0% rent growth · sell at horizon
- IRR
- -7.7%
- Equity multiple
- 0.72×
- Total profit
- $-9,470
- Equity at exit
- $17,743
- IRR
- 1.9%
- Equity multiple
- 1.13×
- Total profit
- $4,442
- Equity at exit
- $10,289
Cash invested: $33,320 (down + closing). Projections, not guarantees.
Landlord ↔ Tenant lean methodology
- Overall (STATE)
- 90 Strongly Landlord-Friendly
- State South Carolina
- 90 Strongly Landlord-Friendly · R+6
- County
- — inherits STATE
- City
- — inherits STATE
ZIP-level market 29550
- Home prices YoY
- -22.3%
- Active inventory
- 156
- Price-to-rent
- 8.0×
Monthly cashflow live
- Estimated rent
- $1,236 medium interval (Pro) →
- Mortgage (P&I)
- −$624
- Tax est. 1.5%
- −$149 /mo · $1,785/yr
- Insurance
- −$50
- HOA
- −$0
- Vacancy / Maint / Mgmt
- −$259
- Net cashflow
- $154
Break-even live
UW: 25.0% down · 7.5% · 30yr · 1.5% tax · 5.0% vac · 8.0% maint · 8.0% mgmt
Financing live
Cash to close
- Down payment
- $29,750
- Closing costs
- $3,570
- Reserves months
- —
- Total cash needed
- —
Loan-product check · same deal, 3 products live
Conventional
25% down · 7.5% · 30yr
- Down + closing
- —
- Monthly P&I
- —
- Monthly cashflow
- —
- DSCR
- —
- Eligible?
- —
Personal DTI + credit; lowest rate.
DSCR
20% down · 8.5% · 30yr
- Down + closing
- —
- Monthly P&I
- —
- Monthly cashflow
- —
- DSCR
- —
- Eligible?
- —
No personal income docs; deal must DSCR.
Hard money
10% down · 12.0% · 12mo
- Down + closing
- —
- Monthly P&I
- —
- Monthly cashflow
- —
- DSCR
- —
- Eligible?
- —
Short-term bridge; refi at stabilization.
Listing history 8 events
-
2026-06-19days on market $119,000 Active 8 DOM
-
2026-06-18days on market $119,000 Active 7 DOM
-
2026-06-17days on market $119,000 Active 6 DOM
-
2026-06-16days on market $119,000 Active 5 DOM
-
2026-06-15days on market $119,000 Active 4 DOM
-
2026-06-14days on market $119,000 Active 2 DOM
-
2026-06-13remarks 379-char remark
-
2026-06-13$119,000 Active 1 DOM
ⓘ Source: listings_history table (triggers on properties + properties_extension) + one-shot
backfill from property_details.listing_events for pre-trigger history.
Climate risk First Street
- Flood 1/10 Low FEMA zone X (unshaded) · 0% chance over 30 yrs
- Wildfire 5/10 Major
- Heat 7/10 Severe 7 d/yr ≥108°F today · 16 d/yr by 30 yrs out
- Wind 7/10 Severe 78% chance of damaging wind over 30 yrs
- Air quality 2/10 Low 0 unhealthy d/yr today · 1 by 30 yrs out
Nearby sold comps map
Loading sold comps map…
Walkable amenities ~0.75 mi
Loading nearby amenities…
Taxation est. · year 1
- Rental income
- $14,828
- − Mortgage interest
- −$6,666
- − Property taxes
- −$1,785
- − Insurance
- −$595
- − Repairs & maintenance
- −$1,186
- − Management
- −$1,186
- − Depreciation
- −$3,462
- Taxable loss
- −$52
- Est. tax savings @ 24.0%
- +$13
- After-tax cash flow
- $1,858/yr
For passive investors: Depreciation is non-cash, so a rental often shows a tax loss while cash-flowing — sheltering income. Rental losses are passive: they offset passive income freely, and up to $25,000/yr can offset ordinary (W-2) income if you actively participate and your MAGI is under $100k (phasing out to $0 by $150k); unused losses carry forward. On sale, claimed depreciation is recaptured at up to 25%, and gains may owe capital-gains tax (a 1031 exchange can defer both). Figures are a year-1 estimate at your 24.0% rate — not tax advice; consult a CPA.
Schools (NCES district)
- District
- Darlington 01
- NCES district ID
- 4501860
- Math proficiency
- 27% ▼ -13.00%
- Reading proficiency
- 37% ▼ -1.00%
- Median HH income
- $36,243
- Composite
- 26.51/100
- National rank
- #7202
- State rank
- #52 of 80 in SC
Livability — Hartsville
- Score
- 60/100
- State rank
- #224
- US rank
- #18685
Category grades
Schools grade is shown separately in the Schools card above.
Census & demographics
- City population
- 30,198
- Population (ZIP)
- 30,198
Population outlook (Darlington County) Hauer SSP2
- Today (2025)
- 64,981 people
- By 2030
- 62,846 · -3.3%
- By 2040
- 58,146 · -10.5%
- By 2050
- 53,541 · -17.6%
- By 2075
- 43,477 · -33.1%
- By 2100
- 34,013 · -47.7%
Race, ethnicity, and origin ACS 2023
- Neighborhood character
- Majority White (63%)
- Race & ethnicity
- White 63% Black 31% Two or more races 3% Hispanic / Latino 3%
- Common ancestry
- Slovak 3% Serbian 3% Romanian 1%
- Foreign-born
- 3% · Canada
- Languages at home
- 96% English-only · Spanish 3%
Political lean MEDSL · Darlington
- 2024 margin
- R (+13.3) · D 42.8% · R 56.1% · Other 1.1%
- 2008→2024 swing
- -13.2pp toward R · 2008: -0.1pp · 2024: -13.3pp
- All cycles
- 2024: R+13.3 2020: R+5.0 2016: R+3.7 2012: D+3.4 2008: R+0.1
Not yet ingested
- Civics
- —
Market trends
- HPI YoY
- ▼ -63.03%
- Current HPI
- 219.996
- Rent YoY
- —
- Metro
- —
- State GDP YoY
- ▲ 4.51%
- F500 in state
- 2
Industry mix (Fortune 500 HQ in SC)
| Industry | F500 HQs | Revenue |
|---|---|---|
| Packaging | 1 | $7B |
|
||
Price history
+815.4% since first listed2 events — show timeline
- 2026-06-11 Listed $119,000 RAGPD
- 2001-11-01 Sold (Public Records) $13,000 Public Records
Property tax history
+17.2%/yrLatest (2024): $195 · +1.2% YoY. Source: county tax records.
Cash-flow waterfall
monthlySold comps — $/sqft
last 12 mo · ≤1 miLoading sold comps…