 Triplex
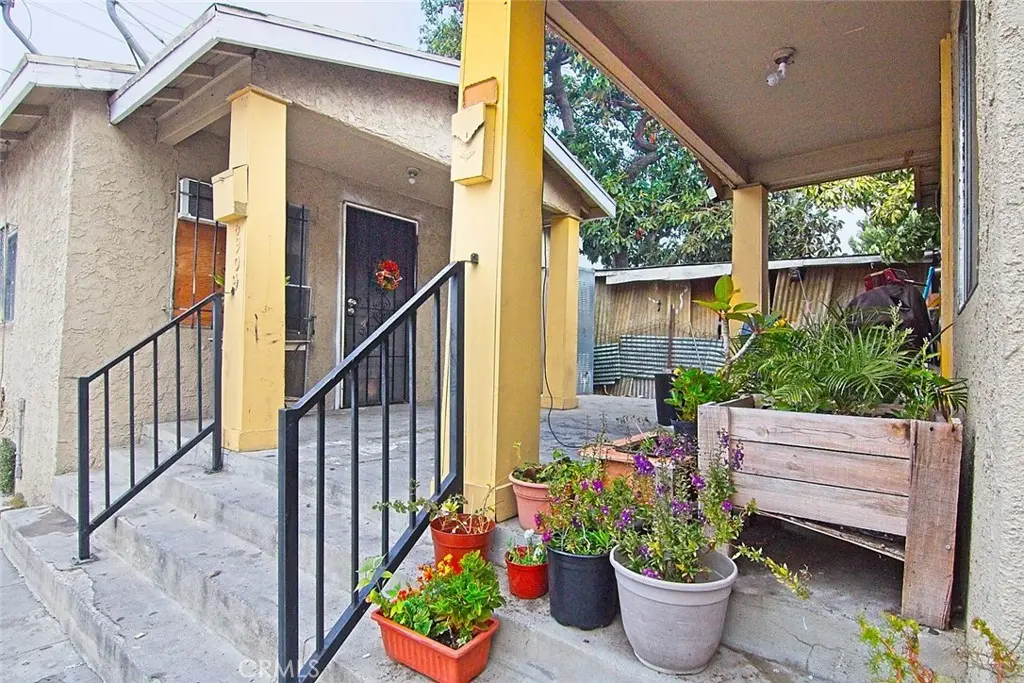
6905 Compton · Florence-Graham, CA
Flood risk 1/10 · Minimal
- FEMA flood zone
- X (unshaded)
- Chance of flooding over 30 yrs
- 0.0%
- Est. flood insurance / yr
- $507 – $1,088
Fire risk 1/10 · Minimal
- Est. fire insurance / yr
- $659 – $1,223
Heat risk 6/10 · Moderate
- Hot days now (above 90°F)
- 7 days/yr
- Hot days in 30 yrs
- 22 days/yr
Wind risk 1/10 · Minimal
- Chance of severe wind over 30 yrs
- —
Air-quality risk 5/10 · Moderate
- Unhealthy air days now
- 9 days/yr
- Unhealthy air days in 30 yrs
- 9 days/yr
Risk factors via First Street. Map © Google.
Why this score? — see what drove the C grade
The composite is a weighted blend of 9 inputs, each scored 0–100. Each bar is that input's sub-score; the figure is the points it added to the 100-point composite (weight × sub-score).
- Cash flow +30.0/30.0
- DSCR +10.0/10.0
- 1% rule +7.8/10.0
- Schools +3.6/10.0
- Rent growth +2.5/5.0
- Livability +2.5/5.0
- Condition / age +2.5/5.0
- ARV discount +1.0/15.0
- Appreciation +0.0/10.0
$690,000
🖨 Deal sheet 📄 Offer letter ✓ Due diligence
Multi-family units
County records classify this as Multi-Family (2-4 Unit). Listing-text estimate: 3 units. confirmed
Listing remarks MLS
SAVVY BUYERS WANTED ! * * * Permitted 3 Unit Property - Bungalow Style - Full of Character, with Storage area inside units. Gorgeous Entry ways , Laminated and Tile Flooring. Access and plenty of parking from Street and Alley. Well Maintained Units. Excellent Appeal . Great for Owner Occupied ( * live in one , rent out the other units ) -or- an excellent INVESTMENT Rental Property. Exceptional Value. Centrally Located, minutes to DownTown. Freeway close to 105fwy & 110fwy for easy commutes.
Key facts
- Centrally located
- Bungalow style
- 2,314 sq ft lot
Tags
Neighborhood map
What this means for you Summary
Snapshot
- This is a 3 × 3-bed/3.0-bath units multifamily listed at $690k.
Deal economics
- At list price, monthly cash flow is $3k ($32k/yr) — positive. Per door: $898/mo.
- The deal already cash-flows at list — no discount required.
- Meets the 1% rule at list price ($9k rent vs $690k).
- Recommended offer: $607k (12.0% below list) — sets the bar for market timing.
- Cap rate 11.0% vs local median 4.4% in Florence-Graham — top-decile yield for the area; either an underpriced asset or a hidden risk that comps aren't pricing in. Stress-test before assuming the spread holds.
Location & tenants
- Location reads: area grade C — affects rentability + tenant quality, not the cash-flow math above.
- Los Angeles Unified (urban): math 29% / reading 54% proficiency, ranked #223 of 517 in CA (top 43%) — families likely to look elsewhere, expect single-tenant / working-renter base with shorter leases; 67% free/reduced lunch — lower-income household profile, screen leases tightly.
- Market conditions: 52 active listings in the ZIP; 2 comparable units currently listed for rent nearby; 19,697 units permitted in Los Angeles County in 2024 (9,426 in 5+ unit buildings).
- At $8,842/mo this rent would consume 175% of the median local household income ($61k/yr) (locally 2573% of renters already pay >50% of income on rent) — very limited rent-growth headroom before tenants either downsize or default.
Forward outlook
- Local home prices are declining (-3.0%/yr); year-one equity from $5k of loan paydown is wiped out by about $21k of value loss. Plan a longer hold.
- Los Angeles County population projected at +9% by 2050 — modest demand growth; plan on rents tracking national, not racing it.
- At projected returns (-3.0% appreciation + 3.0% rent growth), your $193k cash investment doubles in ~8 years — after that, you're playing with house money.
Negotiation context
- It's been on market 176 days — a 12% lower offer ($607k) is reasonable based on typical stale-listing flexibility.
- 8 sale attempts since 9y ago with the ask held roughly flat each time — persistent listings suggest the price (not the market) is what's stuck; bring a comps-based counter.
Risks & watch-outs
- Watch-outs: built in 1923 — expect roof / HVAC / electrical / plumbing capex.
- Climate carrying-cost: extreme-heat days projected 7→22/yr by 2055 (HVAC capex compounding) — expect insurance premiums to compound above CPI over the hold.
Questions for the listing agent
- It's been on market 176 days. Have you received any prior offers? Is the seller open to a 12% concession, seller financing, or rate buy-down credit?
- Can we see the unit-by-unit rent roll, current vacancy, and any below-market leases? What's the average tenancy length?
- What capital expenditures (roof, boiler, parking lot, exteriors) have been made in the last 5 years, and what's planned in the next 2?
- Built in 1923 — when were the roof, HVAC, electrical panel, plumbing, and water heater last replaced?
- Why hasn't it sold? Are there any deal-killer items the seller is aware of (foundation, flood, title, zoning, code violations)?
- Is there a deadline driving the sale (1031 exchange, divorce, estate, relocation)? That informs how much negotiation room exists.
- What's the average days-on-market for RENTAL listings here right now (not sales)? A rising rental-DOM trend means longer vacancies and softer asking-rent achievability than the comps imply.
- What's the recent tenant-quality profile in this submarket — average credit score on applications, eviction rate, late-payment / NSF rate, and stable-employment percentage? A property-management company in the area should have these aggregated.
- How much new apartment / multifamily construction is in the pipeline within 1–3 miles? Heavy new supply (>2% of stock underway) typically softens rents 12–24 months out; light construction supports rent growth.
Investment metrics
- 1% rule
- 1.28% ✓
- Cap rate
- 10.98%
- Cash-on-cash
- 16.73%
- DSCR
- 1.74
- GRM
- 6.5
CMA / ARV
- ARV (median comp)
- $603,041
- List price
- $690,000
- Delta
- 14.42%
- Verdict
- OVERPRICED
- Comps
- 20 within 1.0 mi
Projected returns pro-forma
-3.0% appreciation · 3.0% rent growth · sell at horizon
- IRR
- 7.9%
- Equity multiple
- 1.31×
- Total profit
- $59,620
- Equity at exit
- $102,881
- IRR
- 17.1%
- Equity multiple
- 2.41×
- Total profit
- $272,216
- Equity at exit
- $59,659
Cash invested: $193,200 (down + closing). Projections, not guarantees.
Landlord ↔ Tenant lean methodology
- Overall (STATE)
- 18 Strongly Tenant-Friendly
- State California
- 18 Strongly Tenant-Friendly · D+13
- County
- — inherits STATE
- City
- — inherits STATE
ZIP-level market 90001
- Active inventory
- 52
- Price-to-rent
- 19.5×
Monthly cashflow live
- Estimated rent
- $8,842 high interval (Pro) →
- Mortgage (P&I)
- −$3,618
- Tax from tax record
- −$385 /mo · $4,621/yr
- Insurance
- −$288
- HOA
- −$0
- Vacancy / Maint / Mgmt
- −$1,857
- Net cashflow
- $2,694
Break-even live
3-unit breakdown (identical units grouped — click to expand)
| Units | Beds | Baths | Est. rent |
|---|---|---|---|
| 3× units | 3 | 3 | $8,841 |
| #1 | 3 | 3 | $2,947 |
| #2 | 3 | 3 | $2,947 |
| #3 | 3 | 3 | $2,947 |
| Total (3 units) | $8,842 | ||
UW: 25.0% down · 7.5% · 30yr · 1.5% tax · 5.0% vac · 8.0% maint · 8.0% mgmt
Financing live
Cash to close
- Down payment
- $172,500
- Closing costs
- $20,700
- Reserves months
- —
- Total cash needed
- —
Loan-product check · same deal, 3 products live
Conventional
25% down · 7.5% · 30yr
- Down + closing
- —
- Monthly P&I
- —
- Monthly cashflow
- —
- DSCR
- —
- Eligible?
- —
Personal DTI + credit; lowest rate.
DSCR
20% down · 8.5% · 30yr
- Down + closing
- —
- Monthly P&I
- —
- Monthly cashflow
- —
- DSCR
- —
- Eligible?
- —
No personal income docs; deal must DSCR.
Hard money
10% down · 12.0% · 12mo
- Down + closing
- —
- Monthly P&I
- —
- Monthly cashflow
- —
- DSCR
- —
- Eligible?
- —
Short-term bridge; refi at stabilization.
Rent comps 2 comps
| Address | Beds | Baths | Sqft | Rent | $/sqft | DOM | Units | Dist |
|---|---|---|---|---|---|---|---|---|
| 1642 E Florence Ave Los Angeles, CA | 2.0 | 1.0 | 550 | $1,924 | $3.50 | 24d | 3 | 0.28mi |
| 2226 Zoe Ave Unit B Huntington Park, CA | — | 1.0 | 320 | $1,680 | $5.25 | 15d | 1 | 0.95mi |
Listing history 29 events
-
2026-06-18days on market $690,000 Active 176 DOM
-
2026-06-17days on market $690,000 Active 175 DOM
-
2026-06-16days on market $690,000 Active 174 DOM
-
2026-06-15days on market $690,000 Active 173 DOM
-
2026-06-13days on market $690,000 Active 171 DOM
-
2026-06-09days on market $690,000 Active 167 DOM
-
2026-06-08days on market $690,000 Active 166 DOM
-
2026-06-07days on market $690,000 Active 165 DOM
-
2026-06-04days on market $690,000 Active 162 DOM
-
2026-06-03days on market $690,000 Active 161 DOM
-
2026-06-02days on market $690,000 Active 160 DOM
-
2026-06-01days on market $690,000 Active 159 DOM
-
2026-05-31days on market $690,000 Active 158 DOM
-
2026-04-17status Active 511-char remark
Show marketing remark (511 chars)
SAVVY BUYERS WANTED ! * * * Permitted 3 Unit Property - Bungalow Style - Full of Character, with Storage area inside units. Gorgeous Entry ways , Laminated and Tile Flooring. Access and plenty of parking from Street and Alley. Well Maintained Units. Excellent Appeal . Great for Owner Occupied ( * live in one , rent out the other units ) -or- an excellent INVESTMENT Rental Property. Exceptional Value. Centrally Located, minutes to DownTown. Freeway close to 105fwy & 110fwy for easy commutes.
-
2025-12-23$690,000 Active 511-char remark
Show marketing remark (511 chars)
SAVVY BUYERS WANTED ! * * * Permitted 3 Unit Property - Bungalow Style - Full of Character, with Storage area inside units. Gorgeous Entry ways , Laminated and Tile Flooring. Access and plenty of parking from Street and Alley. Well Maintained Units. Excellent Appeal . Great for Owner Occupied ( * live in one , rent out the other units ) -or- an excellent INVESTMENT Rental Property. Exceptional Value. Centrally Located, minutes to DownTown. Freeway close to 105fwy & 110fwy for easy commutes.
-
2018-08-15status Pending Sale
-
2018-05-31historical
-
2018-05-01historical Active Under Contract
-
2018-04-28historical
-
2018-03-01$450,000 Active
-
2018-03-01$450,000
-
2018-02-28historical
-
2018-02-28historical
-
2018-02-27$450,000 Active
-
2018-02-27$450,000
-
2018-02-27historical
-
2018-02-27historical
-
2017-02-17$450,000 Active
-
2017-02-17$450,000
ⓘ Source: listings_history table (triggers on properties + properties_extension) + one-shot
backfill from property_details.listing_events for pre-trigger history.
Tax reassessment forecast CA · Resets to sale price
- Current annual tax
- $4,621 · $385/mo
- Projected year-2 tax
- $5,244 · $437/mo
- Expected delta
- +$623/yr (+$52/mo · 13.5%)
ⓘ Screening estimate from a state-policy table — verify with the county assessor before closing.
Climate risk First Street
- Flood 1/10 Low FEMA zone X (unshaded) · 0% chance over 30 yrs
- Wildfire 1/10 Low
- Heat 6/10 Major 7 d/yr ≥90°F today · 22 d/yr by 30 yrs out
- Wind 1/10 Low
- Air quality 5/10 Major 9 unhealthy d/yr today · 9 by 30 yrs out
Nearby sold comps map
Loading sold comps map…
Walkable amenities ~0.75 mi
Loading nearby amenities…
Taxation est. · year 1
- Rental income
- $106,104
- − Mortgage interest
- −$38,651
- − Property taxes
- −$4,621
- − Insurance
- −$3,450
- − Repairs & maintenance
- −$8,488
- − Management
- −$8,488
- − Depreciation
- −$20,073
- Taxable income
- $22,332
- Est. tax owed @ 24.0%
- −$5,360
- After-tax cash flow
- $26,970/yr
For passive investors: Depreciation is non-cash, so a rental often shows a tax loss while cash-flowing — sheltering income. Rental losses are passive: they offset passive income freely, and up to $25,000/yr can offset ordinary (W-2) income if you actively participate and your MAGI is under $100k (phasing out to $0 by $150k); unused losses carry forward. On sale, claimed depreciation is recaptured at up to 25%, and gains may owe capital-gains tax (a 1031 exchange can defer both). Figures are a year-1 estimate at your 24.0% rate — not tax advice; consult a CPA.
Schools (NCES district)
- District
- Los Angeles Unified
- NCES district ID
- 0622710
- Math proficiency
- 29% ▼ -4.00%
- Reading proficiency
- 54% ▲ 10.00%
- Median HH income
- $50,403
- Composite
- 35.67/100
- National rank
- #4875
- State rank
- #223 of 517 in CA
Livability — Florence-Graham
No livability data for this city. (Only ~50 U.S. cities are tracked.)
Census & demographics
- Census place
- Florence-Graham, CA
- County
- Los Angeles County · 9,444,647 people
- City population
- 56,189
- Metro
- Los Angeles-Long Beach-Anaheim, CA
- Population (ZIP)
- 56,189
- Household income
- $60,767
- Rent vs Own
- Severe rent burden
- 2573.0
Population outlook (Los Angeles County) Hauer SSP2
- Today (2025)
- 10,940,515 people
- By 2030
- 11,256,481 · +2.9%
- By 2040
- 11,729,929 · +7.2%
- By 2050
- 11,948,407 · +9.2%
- By 2075
- 11,818,114 · +8.0%
- By 2100
- 10,842,928 · -0.9%
Race, ethnicity, and origin ACS 2023
- Neighborhood character
- Predominantly Hispanic (91%)
- Race & ethnicity
- Hispanic / Latino 91% Two or more races 29% Black 7% Native American 3%
- Hispanic origin (detail)
- Mexican 74%
- Foreign-born
- 40% · Canada
- Languages at home
- 16% English-only · Spanish 83%
Political lean MEDSL · Los Angeles
- 2024 margin
- Solid D (+32.9) · D 64.8% · R 31.9% · Other 3.3%
- 2008→2024 swing
- -7.4pp toward R · 2008: 40.4pp · 2024: 32.9pp
- All cycles
- 2024: D+32.9 2020: D+44.2 2016: D+48.0 2012: D+40.0 2008: D+40.4
Not yet ingested
- Civics
- —
Market trends
- HPI YoY
- ▼ -558.17%
- Current HPI
- 447.307
- Rent YoY
- —
- Metro
- Los Angeles-Long Beach-Anaheim, CA
- State GDP YoY
- ▲ 3.21%
- F500 in state
- 116
Industry mix (Fortune 500 HQ in CA)
| Industry | F500 HQs | Revenue |
|---|---|---|
| Technology | 27 | $1,492B |
|
||
| Financial Services | 3 | $174B |
|
||
| Retail | 3 | $44B |
|
||
| Insurance | 3 | $26B |
|
||
| Media / Entertainment | 2 | $115B |
|
||
| Pharmaceuticals / Biotech | 2 | $62B |
|
||
Price history
+53.3% since first listed16 events — show timeline
- 2026-04-17 Relisted — CRMLS
- 2025-12-23 Listed $690,000 CRMLS
- 2018-08-15 Pending — CRMLS
- 2018-05-31 Listing Removed — SDMLS
- 2018-05-01 Contingent — CRMLS
- 2018-04-28 Listing Removed — CRMLS
- 2018-03-01 Listed $450,000 SDMLS
- 2018-03-01 Listed $450,000 CRMLS
- 2018-02-28 Listing Removed — SDMLS
- 2018-02-28 Listing Removed — CRMLS
- 2018-02-27 Listing Removed — SDMLS
- 2018-02-27 Listing Removed — CRMLS
- 2018-02-27 Listed $450,000 SDMLS
- 2018-02-27 Listed $450,000 CRMLS
- 2017-02-17 Listed $450,000 CRMLS
- 2017-02-17 Listed $450,000 SDMLS
Property tax history
+2.1%/yrLatest (2025): $4,621 · +4.0% YoY. Source: county tax records.
Cash-flow waterfall
monthlySold comps — $/sqft
last 12 mo · ≤1 miLoading sold comps…