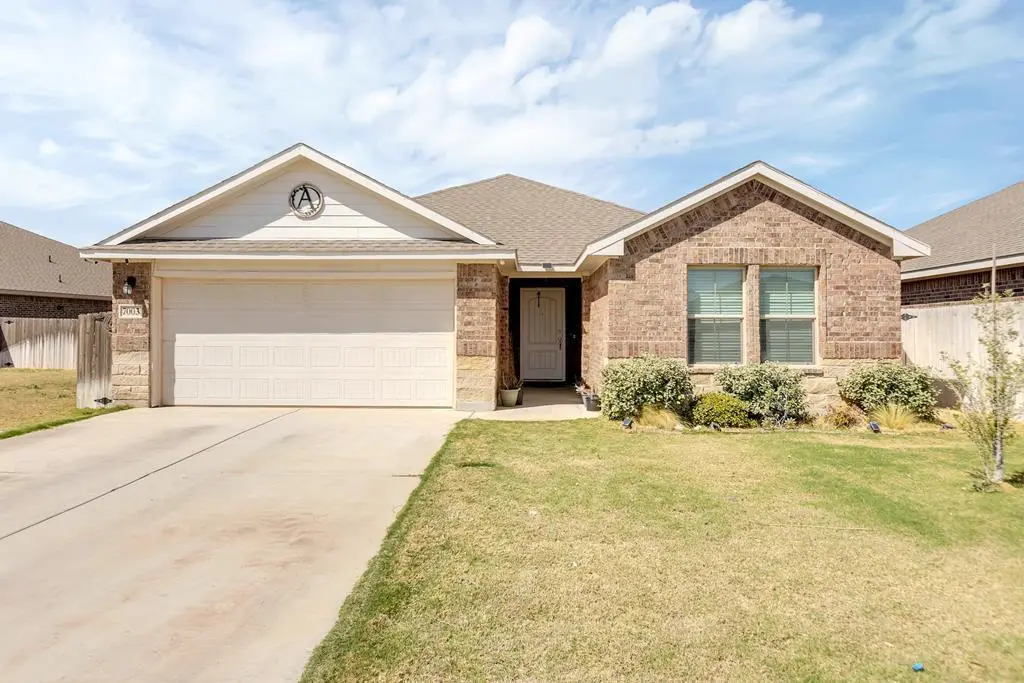
7003 Buckwheat Rd · Odessa, TX
Flood risk 1/10 · Minimal
- FEMA flood zone
- X (unshaded)
- Chance of flooding over 30 yrs
- 0.0%
- Est. flood insurance / yr
- $507 – $1,088
Fire risk 6/10 · Moderate
- Est. fire insurance / yr
- $1,222 – $2,270
Heat risk 6/10 · Moderate
- Hot days now (above 101°F)
- 7 days/yr
- Hot days in 30 yrs
- 22 days/yr
Wind risk 2/10 · Minimal
- Chance of severe wind over 30 yrs
- 4.0%
Air-quality risk 1/10 · Minimal
- Unhealthy air days now
- 0 days/yr
- Unhealthy air days in 30 yrs
- 0 days/yr
Risk factors via First Street. Map © Google.
Why this score? — see what drove the D- grade
The composite is a weighted blend of 9 inputs, each scored 0–100. Each bar is that input's sub-score; the figure is the points it added to the 100-point composite (weight × sub-score).
- Cash flow +12.8/30.0
- ARV discount +7.1/15.0
- Condition / age +4.0/5.0
- DSCR +3.8/10.0
- Livability +3.8/5.0
- 1% rule +3.6/10.0
- Rent growth +2.6/5.0
- Schools +2.2/10.0
- Appreciation +0.0/10.0
$340,000
🖨 Deal sheet (PDF) 📄 Offer letter ✓ Due diligence
Listing remarks MLS
Make an appointment today! This 5 bedroom home shows off interior and exterior upgrades that include a pergola and turf out back. The community has 2 community pools, park and splash pad with one just a hop, a skip, and a jump away. And no more griping about that electric bill- Solar panels are yours!!!
Key facts
- 7,623 sq ft lot
- 2 garage spots
- Built 2023
Neighborhood map
What this means for you Summary
Snapshot
- This is a 5-bed/2.0-bath single-family listed at $340k. Condition is rated good.
Deal economics
- At list price, monthly cash flow is $-29 ($-351/yr) — negative.
- To cash-flow at today's rent, offer at most $335k (1.5% below list).
- To meet the 1% rule (rent ≥ 1% of price), the offer needs to be $293k (13.7% below list).
- Recommended offer: $293k (13.7% below list) — sets the bar for 1% rule.
Location & tenants
- Location reads 75/100 on livability (#132 in TX, #3,928 nationally) — a middle-class / working-renter tenant base. Strengths: cost of living A+, housing A+, health & safety A+; Watch: commute D+, amenities D.
- Ector County ISD (urban): math 22% / reading 27% proficiency, ranked #707 of 826 in TX (top 86%) — low school quality limits family demand, transient renter base, plan for 1-2y turnover.
- Zoned schools: Lee Buice El (math 32% / reading 35%, grade F, #2,174 of 4,322 statewide, top 51%, 843 students, 54% FRL); Nimitz Middle (math 29% / reading 36%, grade F, #947 of 1,662 statewide, top 58%, 1,303 students, 51% FRL); Permian H S (math 19% / reading 29%, grade F, #1,333 of 1,632 statewide, top 82%, 3,978 students, 51% FRL) — zoned schools at 52% FRL track the district average.
- Market conditions: Rents flat; 433 active listings in the ZIP; 17 comparable units currently listed for rent nearby; rentals at typical pace (median 23d on market — plan ~3-4 weeks tenant-placement turnaround); solid renter incomes; 1,004 units permitted in Ector County in 2024 (0 in 5+ unit buildings).
- This rent runs 34% of the median local income ($105k/yr) — at the standard rent-burdened threshold; future hikes will face affordability resistance.
Forward outlook
- Local home prices are declining (-3.0%/yr); year-one equity from $2k of loan paydown is wiped out by about $10k of value loss. Plan a longer hold.
- Ector County population projected at +78% by 2050 — long-run rental-demand tailwind backs the buy-and-hold thesis.
Negotiation context
- It's been on market 82 days — a 6% lower offer ($320k) is reasonable based on typical stale-listing flexibility.
- 2 sale attempts since 3y ago; this cycle's ask has dropped $26k (7%) from the opening price — seller is motivated, your offer sets the floor, not the list.
Risks & watch-outs
- Climate carrying-cost: major wildfire risk; extreme-heat days projected 7→22/yr by 2055 (HVAC capex compounding) — expect insurance premiums to compound above CPI over the hold.
Questions for the listing agent
- What do current leases actually rent for vs. the listed asking? Can we see a recent rent roll and the last 12 months of T-12 income?
- It's been on market 82 days. Have you received any prior offers? Is the seller open to a 14% concession, seller financing, or rate buy-down credit?
- What does the HOA fee cover, when was the last increase, and are there any pending special assessments or reserve-fund shortfalls?
- Why hasn't it sold? Are there any deal-killer items the seller is aware of (foundation, flood, title, zoning, code violations)?
- Is there a deadline driving the sale (1031 exchange, divorce, estate, relocation)? That informs how much negotiation room exists.
- Schools are F-rated, which usually means shorter tenancies and higher turnover. Who's the typical renter profile here, and what's been the actual vacancy rate?
- The area grade is low — what's the realistic commute time and amenity access for the typical tenant pool here? Any planned neighborhood developments (good or bad) we should know about?
- What's the average days-on-market for RENTAL listings here right now (not sales)? A rising rental-DOM trend means longer vacancies and softer asking-rent achievability than the comps imply.
- What's the recent tenant-quality profile in this submarket — average credit score on applications, eviction rate, late-payment / NSF rate, and stable-employment percentage? A property-management company in the area should have these aggregated.
- How much new for-sale + rental construction is in the pipeline within 1–3 miles? Heavy new supply typically softens prices + rents 12–24 months out; constrained supply supports both.
Investment metrics
- 1% rule
- 0.86% ✗
- Cap rate
- 6.19%
- Cash-on-cash
- -0.37%
- DSCR
- 0.98
- GRM
- 9.7
CMA / ARV
- ARV (median comp)
- $337,064
- List price
- $340,000
- Delta
- 0.87%
- Verdict
- FAIR
- Comps
- 2 within 2.0 mi
Projected returns pro-forma
-3.0% appreciation · 0.54% rent growth · sell at horizon
- IRR
- -19.7%
- Equity multiple
- 0.33×
- Total profit
- $-64,002
- Equity at exit
- $50,695
- IRR
- -18.8%
- Equity multiple
- 0.10×
- Total profit
- $-85,636
- Equity at exit
- $29,397
Cash invested: $95,200 (down + closing). Projections, not guarantees.
Landlord ↔ Tenant lean methodology
- Overall (STATE)
- 87 Strongly Landlord-Friendly
- State Texas
- 87 Strongly Landlord-Friendly · R+5
- County
- — inherits STATE
- City
- — inherits STATE
ZIP-level market 79765
- Home prices YoY
- -28.7%
- Rents YoY
- 0.5%
- Active inventory
- 433
- Price-to-rent
- 9.7×
Monthly cashflow live
- Estimated rent
- $2,933 high interval (Pro) →
- Mortgage (P&I)
- −$1,783
- Tax from tax record
- −$386 /mo · $4,637/yr
- Insurance
- −$142
- HOA
- −$35
- Vacancy / Maint / Mgmt
- −$616
- Net cashflow
- $-29
Break-even live
Sensitivity live
| Price | -10% $163 | -5% $67 | +0% $-29 | +5% $-126 | +10% $-222 |
|---|---|---|---|---|---|
| Rent | -10% $-261 | -5% $-145 | +0% $-29 | +5% $87 | +10% $202 |
| Rate | -1.0pp $142 | -0.5pp $57 | base $-29 | +0.5pp $-117 | +1.0pp $-207 |
UW: 25.0% down · 7.5% · 30yr · 1.5% tax · 5.0% vac · 8.0% maint · 8.0% mgmt
Financing live
Cash to close
- Down payment
- $85,000
- Closing costs
- $10,200
- Reserves months
- —
- Total cash needed
- —
Loan-product check · same deal, 3 products live
Conventional
25% down · 7.5% · 30yr
- Down + closing
- —
- Monthly P&I
- —
- Monthly cashflow
- —
- DSCR
- —
- Eligible?
- —
Personal DTI + credit; lowest rate.
DSCR
20% down · 8.5% · 30yr
- Down + closing
- —
- Monthly P&I
- —
- Monthly cashflow
- —
- DSCR
- —
- Eligible?
- —
No personal income docs; deal must DSCR.
Hard money
10% down · 12.0% · 12mo
- Down + closing
- —
- Monthly P&I
- —
- Monthly cashflow
- —
- DSCR
- —
- Eligible?
- —
Short-term bridge; refi at stabilization.
Rent comps 17 comps
| Address | Beds | Baths | Sqft | Rent | $/sqft | DOM | Units | Dist |
|---|---|---|---|---|---|---|---|---|
| 7539 Orion Rd Odessa, TX | 4.0 | 2.0 | 1782 | $2,800 | $1.57 | 15d | 1 | 0.09mi |
| 7541 Orion Rd Gardendale, TX | 4.0 | 2.0 | 1574 | $2,495 | $1.59 | 15d | 1 | 0.10mi |
| 7526 Horton Ranch Rd Odessa, TX | 4.0 | 2.0 | 1840 | $2,600 | $1.41 | 15d | 1 | 0.10mi |
| 7526 Horton Ranch Rd Odessa, TX | 4.0 | 2.0 | 1830 | $2,700 | $1.48 | 22d | 1 | 0.10mi |
| 7507 Orion Rd Odessa, TX | 4.0 | 2.0 | 1838 | $2,700 | $1.47 | 22d | 1 | 0.16mi |
| 7108 Red Canyon Rd Odessa, TX | 5.0 | 2.0 | 2009 | $3,500 | $1.74 | 45d | 1 | 0.23mi |
| 7118 Adenium Rd Odessa, TX | 4.0 | 3.0 | 2994 | $3,500 | $1.17 | 15d | 1 | 0.26mi |
| 7118 Adenium Rd Odessa, TX | 4.0 | 3.0 | 2994 | $3,500 | $1.17 | 45d | 1 | 0.26mi |
| 7300 White Cliff Rd Odessa, TX | 4.0 | 2.0 | 1729 | $2,700 | $1.56 | 15d | 1 | 0.42mi |
| 6909 Boss Ranch Rd Odessa, TX | 4.0 | 2.0 | 1800 | $875 | $0.49 | 45d | 1 | 0.42mi |
| 7710 Purple Vitex Rd Odessa, TX | 4.0 | 2.0 | 1836 | $3,950 | $2.15 | 45d | 1 | 0.46mi |
| 7625 Purple Vitex Rd Odessa, TX | 4.0 | 2.0 | 1735 | $2,700 | $1.56 | 22d | 1 | 0.50mi |
| 7625 Purple Vitex Rd Odessa, TX | 4.0 | 2.0 | 1735 | $2,700 | $1.56 | 45d | 1 | 0.50mi |
| 7710 Brown Bark Rd Odessa, TX | 5.0 | 2.0 | 1998 | $4,200 | $2.10 | 22d | 1 | 0.52mi |
| 7315 W Pile Ranch Rd Odessa, TX | 4.0 | 2.0 | 1775 | $2,600 | $1.46 | 15d | 1 | 0.57mi |
| 6919 Kate Reed Dr Odessa, TX | 4.0 | 2.0 | 1574 | $2,700 | $1.72 | 45d | 1 | 0.69mi |
| 6928 Rocking L Ranch Rd Odessa, TX | 4.0 | 2.0 | 1838 | $2,795 | $1.52 | 22d | 1 | 0.85mi |
HOA detail
- Monthly dues
- $35 · $420/yr
- Likely covers
- electricpool
Listing history 18 events
-
2026-06-16days on market $340,000 Active 82 DOM
-
2026-06-15days on market $340,000 Active 81 DOM
-
2026-06-14days on market $340,000 Active 79 DOM
-
2026-06-13days on market $340,000 Active 78 DOM
-
2026-06-10days on market $340,000 Active 76 DOM
-
2026-06-09days on market $340,000 Active 75 DOM
-
2026-06-08days on market $340,000 Active 74 DOM
-
2026-06-07days on market $340,000 Active 73 DOM
-
2026-06-03days on market $340,000 Active 68 DOM
-
2026-06-01days on market $340,000 Active 67 DOM
-
2026-05-31days on market $340,000 Active 66 DOM
-
2026-05-30days on market $340,000 Active 65 DOM
-
2026-05-11price $340,000 305-char remark
Show marketing remark (305 chars)
Make an appointment today! This 5 bedroom home shows off interior and exterior upgrades that include a pergola and turf out back. The community has 2 community pools, park and splash pad with one just a hop, a skip, and a jump away. And no more griping about that electric bill- Solar panels are yours!!!
-
2026-05-02price $350,000 305-char remark
Show marketing remark (305 chars)
Make an appointment today! This 5 bedroom home shows off interior and exterior upgrades that include a pergola and turf out back. The community has 2 community pools, park and splash pad with one just a hop, a skip, and a jump away. And no more griping about that electric bill- Solar panels are yours!!!
-
2026-04-22price $360,000 305-char remark
Show marketing remark (305 chars)
Make an appointment today! This 5 bedroom home shows off interior and exterior upgrades that include a pergola and turf out back. The community has 2 community pools, park and splash pad with one just a hop, a skip, and a jump away. And no more griping about that electric bill- Solar panels are yours!!!
-
2026-03-27$366,500 Active 305-char remark
Show marketing remark (305 chars)
Make an appointment today! This 5 bedroom home shows off interior and exterior upgrades that include a pergola and turf out back. The community has 2 community pools, park and splash pad with one just a hop, a skip, and a jump away. And no more griping about that electric bill- Solar panels are yours!!!
-
2023-03-31soldstatus
-
2023-02-12$312,990
ⓘ Source: listings_history table (triggers on properties + properties_extension) + one-shot
backfill from property_details.listing_events for pre-trigger history.
Tax reassessment forecast TX · Resets to sale price
- Current annual tax
- $4,637 · $386/mo
- Projected year-2 tax
- $6,222 · $518/mo
- Expected delta
- +$1,585/yr (+$132/mo · 34.2%)
ⓘ Screening estimate from a state-policy table — verify with the county assessor before closing.
Climate risk First Street
- Flood 1/10 Low FEMA zone X (unshaded) · 0% chance over 30 yrs
- Wildfire 6/10 Major
- Heat 6/10 Major 7 d/yr ≥101°F today · 22 d/yr by 30 yrs out
- Wind 2/10 Low 4% chance of damaging wind over 30 yrs
- Air quality 1/10 Low 0 unhealthy d/yr today · 0 by 30 yrs out
Nearby sold comps map
Loading sold comps map…
Walkable amenities ~0.75 mi
Loading nearby amenities…
Taxation est. · year 1
- Rental income
- $35,191
- − Mortgage interest
- −$19,045
- − Property taxes
- −$4,637
- − Insurance
- −$1,700
- − Repairs & maintenance
- −$2,815
- − Management
- −$2,815
- − HOA
- −$420
- − Depreciation
- −$9,891
- Taxable loss
- −$6,132
- Est. tax savings @ 24.0%
- +$1,472
- After-tax cash flow
- $1,120/yr
For passive investors: Depreciation is non-cash, so a rental often shows a tax loss while cash-flowing — sheltering income. Rental losses are passive: they offset passive income freely, and up to $25,000/yr can offset ordinary (W-2) income if you actively participate and your MAGI is under $100k (phasing out to $0 by $150k); unused losses carry forward. On sale, claimed depreciation is recaptured at up to 25%, and gains may owe capital-gains tax (a 1031 exchange can defer both). Figures are a year-1 estimate at your 24.0% rate — not tax advice; consult a CPA.
Condition & rehab AI · 12 photos
This 5-bedroom home is in good condition with recent upgrades, including a pergola and turf backyard. It's move-in ready and offers a good return on investment.
Value-add opportunities
- Both landscaping — improves curb appeal and adds value
- Both painting — refreshes interior and exterior
- Both upgrading appliances — attracts more buyers/renters
Renovation cost estimate screening
Value-add ROI direction
- Both landscaping — improves curb appeal and adds value ↑
- Both painting — refreshes interior and exterior ↑
- Both upgrading appliances — attracts more buyers/renters ↑
ⓘ Cost ranges are severity-bucket heuristics (US national rule-of-thumb). Get contractor quotes + a written scope before underwriting a rehab budget.
Schools (NCES district)
- District
- Ector County ISD
- NCES district ID
- 4818000
- Math proficiency
- 22% ▼ -9.00%
- Reading proficiency
- 27% ▼ -4.00%
- Median HH income
- $52,740
- Composite
- 21.89/100
- National rank
- #8233
- State rank
- #707 of 826 in TX
Livability — Odessa
- Score
- 75/100
- State rank
- #132
- US rank
- #3928
Category grades
Schools grade is shown separately in the Schools card above.
Census & demographics
- Census place
- Odessa, TX
- County
- Ector County · 131,169 people
- City population
- 131,169
- Metro
- Odessa, TX
- Population (ZIP)
- 25,904
- Household income
- $104,965
- Rent vs Own
- Severe rent burden
- 884.0
Population outlook (Ector County) Hauer SSP2
- Today (2025)
- 212,765 people
- By 2030
- 241,962 · +13.7%
- By 2040
- 306,582 · +44.1%
- By 2050
- 379,755 · +78.5%
- By 2075
- 568,991 · +167.4%
- By 2100
- 709,829 · +233.6%
Race, ethnicity, and origin ACS 2023
- Neighborhood character
- Diverse neighborhood (Simpson 0.59)
- Race & ethnicity
- Hispanic / Latino 49% White 41% Two or more races 15% Black 5% Asian 3% Native American 1%
- Hispanic origin (detail)
- Mexican 45%
- Common ancestry
- Romanian 1% Slovak 1% Lithuanian 1%
- Foreign-born
- 10% · Canada, China, South Korea
- Languages at home
- 63% English-only · Spanish 31% German/W. Germanic 1% Tagalog/Filipino 1%
Political lean MEDSL · Ector
- 2024 margin
- Solid R (+52.9) · D 23.2% · R 76.1%
- 2008→2024 swing
- -4.9pp toward R · 2008: -48.0pp · 2024: -52.9pp
- All cycles
- 2024: R+52.9 2020: R+47.8 2016: R+40.6 2012: R+48.9 2008: R+48.0
Not yet ingested
- Civics
- —
Market trends
- HPI YoY
- ▼ -69.68%
- Current HPI
- 173.4252
- Rent YoY
- ▲ 0.54%
- Metro
- Odessa, TX
- State GDP YoY
- ▲ 3.95%
- F500 in state
- 110
Industry mix (Fortune 500 HQ in TX)
| Industry | F500 HQs | Revenue |
|---|---|---|
| Energy | 16 | $1,198B |
|
||
| Technology | 5 | $198B |
|
||
| Engineering / Construction | 4 | $72B |
|
||
| Energy Services | 3 | $60B |
|
||
| Utilities | 3 | $41B |
|
||
| Healthcare | 2 | $330B |
|
||
Price history
+8.6% since first listed6 events — show timeline
- 2026-05-11 Price Changed $340,000 ODMLS
- 2026-05-02 Price Changed $350,000 ODMLS
- 2026-04-22 Price Changed $360,000 ODMLS
- 2026-03-27 Listed $366,500 ODMLS
- 2023-03-31 Sold (MLS) — ODMLS
- 2023-02-12 Listed $312,990 ODMLS
Property tax history
+93.8%/yrLatest (2025): $4,637 · -10.9% YoY. Source: county tax records.
Cash-flow waterfall
monthlySold comps — $/sqft
last 12 mo · ≤1 miLoading sold comps…