5628 W 97th St · Overland Park, KS
Flood risk No data
- FEMA flood zone
- —
- Chance of flooding over 30 yrs
- —
- Est. flood insurance / yr
- —
Fire risk No data
- Est. fire insurance / yr
- —
Heat risk No data
- Hot days now (above threshold)
- —
- Hot days in 30 yrs
- —
Wind risk No data
- Chance of severe wind over 30 yrs
- —
Air-quality risk No data
- Unhealthy air days now
- —
- Unhealthy air days in 30 yrs
- —
Risk factors via First Street. Map © Google.
Why this score? — see what drove the C- grade
The composite is a weighted blend of 9 inputs, each scored 0–100. Each bar is that input's sub-score; the figure is the points it added to the 100-point composite (weight × sub-score).
- Cash flow +18.6/30.0
- ARV discount +7.5/15.0
- DSCR +5.9/10.0
- 1% rule +4.3/10.0
- Livability +4.0/5.0
- Schools +3.8/10.0
- Rent growth +3.7/5.0
- Condition / age +2.5/5.0
- Appreciation +0.0/10.0
$210,000
🖨 Deal sheet (PDF) 📄 Offer letter ✓ Due diligence
Listing remarks
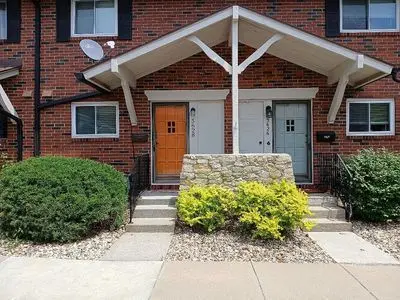
Meticulously updated 2-bedroom, 1 1/2-bath unit. Absolutely move-in ready. Great location, with elementary and middle schools within walking distance. Large living area with fenced-in private patio. Beautiful hardwood floors. Both bedrooms feature plentiful closet space. The lower level has a finished area and a laundry room with additional storage space. Updated electrical panel. Refrigerator, washer, and dryer stay with the unit. Kitchen has newer appliances. Everywhere has a fresh coat of paint. Gas, water, and trash are included as part of HOA dues. HOA covers exterior maintenance. Pool and clubhouse available for nominal fee. Unit comes with two parking spaces, one covered. Close to Me
Key facts
- Newer appliances
- Finished area
- Built 1966
Tags
Property features AI
Exterior
- Home design: Built in 1966
- Construction: Living area approximately 1,024
- Exterior features: Located in the Nall Hills subdivision
Neighborhood map
What this means for you Summary
Snapshot
- This is a 2-bed/1.5-bath other listed at $210k.
Deal economics
- At list price, monthly cash flow is $204 ($2k/yr) — positive.
- The deal already cash-flows at list — no discount required.
- To meet the 1% rule (rent ≥ 1% of price), the offer needs to be $195k (7.1% below list).
- Recommended offer: $195k (7.1% below list) — sets the bar for 1% rule.
- Cap rate 7.5% vs local median 3.9% in Overland Park — top-decile yield for the area; either an underpriced asset or a hidden risk that comps aren't pricing in. Stress-test before assuming the spread holds.
Location & tenants
- Location reads 80/100 on livability (#16 in KS, #1,851 nationally) — a professional / high-income tenant draw. Strengths: employment A+, housing A+, crime B; Watch: health & safety C-, commute D+.
- Shawnee Mission Pub Schools (suburban): math 38% / reading 46% proficiency, ranked #22 of 169 in KS (top 13%) — families likely to look elsewhere, expect single-tenant / working-renter base with shorter leases.
- Zoned schools: John Diemer Elem (math 56% / reading 62%, grade B-, #81 of 684 statewide, top 12%, 401 students, 35% FRL); Indian Woods Middle (math 33% / reading 40%, grade F, #44 of 219 statewide, top 20%, 756 students, 38% FRL); Shawnee Mission South High (math 31% / reading 41%, grade F, #30 of 327 statewide, top 9%, 1,586 students, 34% FRL).
- Market conditions: Rents rising fast (+4.7%/yr); 64 active listings in the ZIP; 10 comparable units currently listed for rent nearby; rentals at typical pace (median 23d on market — plan ~3-4 weeks tenant-placement turnaround); high-income renter base; 2,969 units permitted in Johnson County in 2024 (1,066 in 5+ unit buildings).
Forward outlook
- Local home prices are declining (-3.0%/yr); year-one equity from $1k of loan paydown is wiped out by about $6k of value loss. Plan a longer hold.
- Johnson County population projected at +27% by 2050 — long-run rental-demand tailwind backs the buy-and-hold thesis.
Negotiation context
- It's been on market 33 days — a 3% lower offer ($204k) is reasonable based on typical stale-listing flexibility.
Questions for the listing agent
- It's been on market 33 days. Have you received any prior offers? Is the seller open to a 7% concession, seller financing, or rate buy-down credit?
- Built in 1966 — when were the roof, HVAC, electrical panel, plumbing, and water heater last replaced?
- Is there a deadline driving the sale (1031 exchange, divorce, estate, relocation)? That informs how much negotiation room exists.
- Schools are B-rated — typically a magnet for longer-tenancy family renters. What's the average tenant stay here, and is there a school-zone premium baked into asking?
- What's the average days-on-market for RENTAL listings here right now (not sales)? A rising rental-DOM trend means longer vacancies and softer asking-rent achievability than the comps imply.
- What's the recent tenant-quality profile in this submarket — average credit score on applications, eviction rate, late-payment / NSF rate, and stable-employment percentage? A property-management company in the area should have these aggregated.
- How much new for-sale + rental construction is in the pipeline within 1–3 miles? Heavy new supply typically softens prices + rents 12–24 months out; constrained supply supports both.
Investment metrics
- 1% rule
- 0.93% ✗
- Cap rate
- 7.46%
- Cash-on-cash
- 4.17%
- DSCR
- 1.19
- GRM
- 9.0
CMA / ARV
No comps found within radius.
Projected returns pro-forma
-3.0% appreciation · 4.68% rent growth · sell at horizon
- IRR
- -8.1%
- Equity multiple
- 0.70×
- Total profit
- $-17,702
- Equity at exit
- $31,312
- IRR
- 3.4%
- Equity multiple
- 1.26×
- Total profit
- $15,415
- Equity at exit
- $18,157
Cash invested: $58,800 (down + closing). Projections, not guarantees.
Landlord ↔ Tenant lean methodology
- Overall (STATE)
- 83 Strongly Landlord-Friendly
- State Kansas
- 83 Strongly Landlord-Friendly · R+10
- County
- — inherits STATE
- City
- — inherits STATE
ZIP-level market 66207
- Rents YoY
- 4.7%
- Active inventory
- 64
- Price-to-rent
- 9.0×
Monthly cashflow live
- Estimated rent
- $1,951 high interval (Pro) →
- Mortgage (P&I)
- −$1,101
- Tax from tax record
- −$148 /mo · $1,775/yr
- Insurance
- −$88
- HOA
- −$0
- Vacancy / Maint / Mgmt
- −$410
- Net cashflow
- $204
Break-even live
Sensitivity live
| Price | -10% $323 | -5% $264 | +0% $204 | +5% $145 | +10% $85 |
|---|---|---|---|---|---|
| Rent | -10% $50 | -5% $127 | +0% $204 | +5% $281 | +10% $358 |
| Rate | -1.0pp $310 | -0.5pp $258 | base $204 | +0.5pp $150 | +1.0pp $95 |
UW: 25.0% down · 7.5% · 30yr · 1.5% tax · 5.0% vac · 8.0% maint · 8.0% mgmt
Financing live
Cash to close
- Down payment
- $52,500
- Closing costs
- $6,300
- Reserves months
- —
- Total cash needed
- —
Loan-product check · same deal, 3 products live
Conventional
25% down · 7.5% · 30yr
- Down + closing
- —
- Monthly P&I
- —
- Monthly cashflow
- —
- DSCR
- —
- Eligible?
- —
Personal DTI + credit; lowest rate.
DSCR
20% down · 8.5% · 30yr
- Down + closing
- —
- Monthly P&I
- —
- Monthly cashflow
- —
- DSCR
- —
- Eligible?
- —
No personal income docs; deal must DSCR.
Hard money
10% down · 12.0% · 12mo
- Down + closing
- —
- Monthly P&I
- —
- Monthly cashflow
- —
- DSCR
- —
- Eligible?
- —
Short-term bridge; refi at stabilization.
Rent comps 10 comps
| Address | Beds | Baths | Sqft | Rent | $/sqft | DOM | Units | Dist |
|---|---|---|---|---|---|---|---|---|
| 9550 Ash St Overland Park, KS | 2.0 | 1.0–2.5 | 1012 | $2,192 | $2.16 | 4d | 11 | 0.23mi |
| 4851 Meadowbrook Pkwy Prairie Village, KS | 3.0 | 1.0–3.0 | 1097 | $3,943 | $3.59 | 5d | 17 | 0.70mi |
| 4120 W 94th Ter Prairie Village, KS | 1.0–3.0 | 1.0–2.0 | 1345 | $2,092 | $1.56 | 3d | 17 | 1.00mi |
| 9530 Mission Rd Overland Park, KS | 1.0 | 1.0 | 900 | $1,325 | $1.47 | 25d | 1 | 1.04mi |
| 9532 Mission Rd Unit 25 Overland Park, KS | 1.0 | 1.0 | 900 | $1,325 | $1.47 | 25d | 1 | 1.08mi |
| 8833 Glenwood Ct Overland Park, KS | 2.0 | 2.0 | 1100 | $1,350 | $1.23 | 23d | 1 | 1.19mi |
| 5020 Indian Creek Pkwy Overland Park, KS | 1.0–2.0 | 1.0–2.0 | 962 | $2,257 | $2.34 | 3d | 24 | 1.22mi |
| 7700 W 95th St Overland Park, KS | 1.0–2.0 | 1.0–2.0 | 700 | $3,097 | $4.42 | 12d | 1 | 1.27mi |
| 8747 Broadmoor St Overland Park, KS | 1.0–3.0 | 1.0–2.5 | 1187 | $1,370 | $1.15 | 25d | 1 | 1.30mi |
| 9152 Foster St Overland Park, KS | 1.0–3.0 | 1.0–2.5 | 1123 | $1,471 | $1.31 | 25d | 1 | 1.34mi |
Listing history 18 events
-
2026-06-21days on market $210,000 Active 33 DOM
-
2026-06-18days on market $210,000 Active 30 DOM
-
2026-06-17days on market $210,000 Active 29 DOM
-
2026-06-16days on market $210,000 Active 28 DOM
-
2026-06-15days on market $210,000 Active 27 DOM
-
2026-06-13days on market $210,000 Active 25 DOM
-
2026-06-13days on market $210,000 Active 24 DOM
-
2026-06-09days on market $210,000 Active 21 DOM
-
2026-06-08days on market $210,000 Active 20 DOM
-
2026-06-07days on market $210,000 Active 19 DOM
-
2026-06-05days on market $210,000 Active 16 DOM
-
2026-06-03days on market $210,000 Active 15 DOM
-
2026-06-02days on market $210,000 Active 14 DOM
-
2026-06-01days on market $210,000 Active 13 DOM
-
2026-05-31days on market $210,000 Active 12 DOM
-
2026-05-20$210,000 Active
-
2008-05-21soldstatus
-
1998-07-24soldstatus
ⓘ Source: listings_history table (triggers on properties + properties_extension) + one-shot
backfill from property_details.listing_events for pre-trigger history.
Tax reassessment forecast KS · Resets to sale price
- Current annual tax
- $1,775 · $148/mo
- Projected year-2 tax
- $2,961 · $247/mo
- Expected delta
- +$1,186/yr (+$99/mo · 66.8%)
ⓘ Screening estimate from a state-policy table — verify with the county assessor before closing.
Nearby sold comps map
Loading sold comps map…
Walkable amenities ~0.75 mi
Loading nearby amenities…
Taxation est. · year 1
- Rental income
- $23,408
- − Mortgage interest
- −$11,763
- − Property taxes
- −$1,775
- − Insurance
- −$1,050
- − Repairs & maintenance
- −$1,873
- − Management
- −$1,873
- − Depreciation
- −$6,109
- Taxable loss
- −$1,035
- Est. tax savings @ 24.0%
- +$248
- After-tax cash flow
- $2,701/yr
For passive investors: Depreciation is non-cash, so a rental often shows a tax loss while cash-flowing — sheltering income. Rental losses are passive: they offset passive income freely, and up to $25,000/yr can offset ordinary (W-2) income if you actively participate and your MAGI is under $100k (phasing out to $0 by $150k); unused losses carry forward. On sale, claimed depreciation is recaptured at up to 25%, and gains may owe capital-gains tax (a 1031 exchange can defer both). Figures are a year-1 estimate at your 24.0% rate — not tax advice; consult a CPA.
Schools (NCES district)
- District
- Shawnee Mission Pub Schools
- NCES district ID
- 2011640
- Math proficiency
- 38% ▼ -6.00%
- Reading proficiency
- 46% ▼ -2.00%
- Median HH income
- $64,923
- Composite
- 37.55/100
- National rank
- #4391
- State rank
- #22 of 169 in KS
Livability — Overland Park
- Score
- 80/100
- State rank
- #16
- US rank
- #1851
Category grades
Schools grade is shown separately in the Schools card above.
Census & demographics
- Census place
- Overland Park, KS
- County
- Johnson County · 574,662 people
- City population
- 180,138
- Metro
- Kansas City, MO-KS
- Population (ZIP)
- 15,739
- Household income
- $125,153
- Rent vs Own
- Severe rent burden
- 305.0
Population outlook (Johnson County) Hauer SSP2
- Today (2025)
- 663,396 people
- By 2030
- 702,585 · +5.9%
- By 2040
- 775,386 · +16.9%
- By 2050
- 841,772 · +26.9%
- By 2075
- 994,137 · +49.9%
- By 2100
- 1,073,036 · +61.7%
Race, ethnicity, and origin ACS 2023
- Neighborhood character
- Predominantly White (91%)
- Race & ethnicity
- White 91% Hispanic / Latino 6% Two or more races 5%
- Hispanic origin (detail)
- Mexican 2% Cuban 1%
- Common ancestry
- Italian 4% Slovak 3% Lithuanian 3%
- Foreign-born
- 3% · Canada, China
- Languages at home
- 97% English-only · Spanish 2% Chinese 1%
Political lean MEDSL · Johnson
- 2024 margin
- Lean D (+8.5) · D 53.4% · R 44.9% · Other 1.8%
- 2008→2024 swing
- +17.5pp toward D · 2008: -9.0pp · 2024: 8.5pp
- All cycles
- 2024: D+8.5 2020: D+8.2 2016: R+2.7 2012: R+17.8 2008: R+9.0
Not yet ingested
- Civics
- —
Market trends
- HPI YoY
- ▼ -286.42%
- Current HPI
- 274.6822
- Rent YoY
- ▲ 4.68%
- Metro
- Kansas City, MO-KS
- State GDP YoY
- —
- F500 in state
- 0
Price history
3 events — show timeline
- 2026-05-20 Listed $210,000 FSBO.com
- 2008-05-21 Sold (Public Records) — Public Records
- 1998-07-24 Sold (Public Records) — Public Records
Property tax history
+3.7%/yrLatest (2025): $1,775 · +7.4% YoY. Source: county tax records.
Cash-flow waterfall
monthlySold comps — $/sqft
last 12 mo · ≤1 miLoading sold comps…