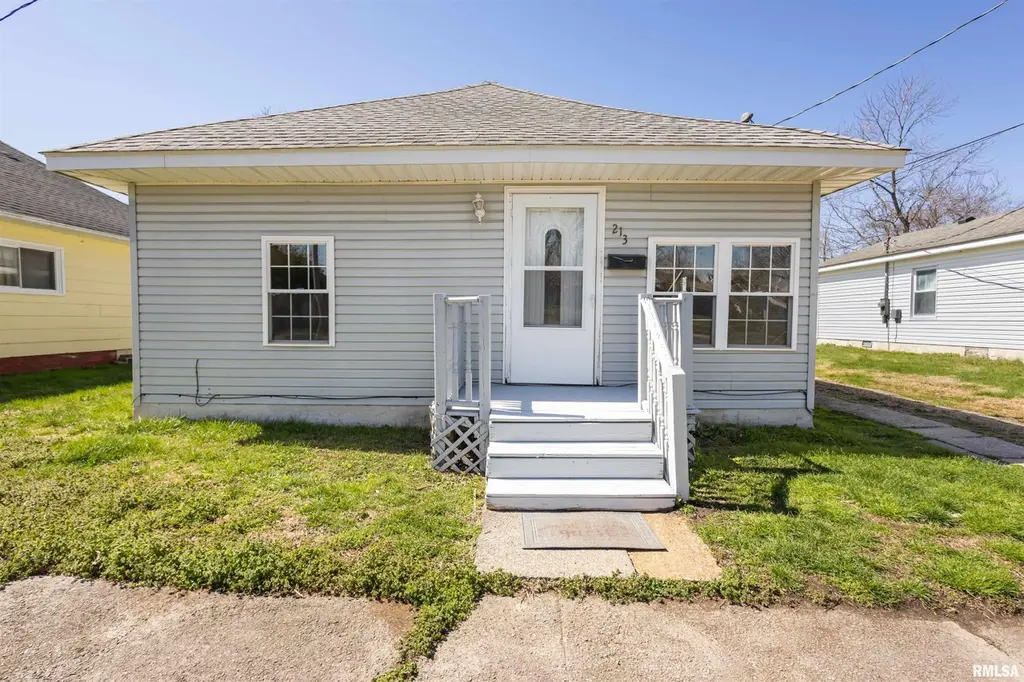
213 S Gardner St · West Frankfort, IL
Flood risk 1/10 · Minimal
- FEMA flood zone
- X (unshaded)
- Chance of flooding over 30 yrs
- 0.0%
- Est. flood insurance / yr
- $473 – $860
Fire risk 1/10 · Minimal
- Est. fire insurance / yr
- $804 – $1,492
Heat risk 5/10 · Moderate
- Hot days now (above 107°F)
- 7 days/yr
- Hot days in 30 yrs
- 21 days/yr
Wind risk 2/10 · Minimal
- Chance of severe wind over 30 yrs
- 2.0%
Air-quality risk 2/10 · Minimal
- Unhealthy air days now
- 0 days/yr
- Unhealthy air days in 30 yrs
- 1 days/yr
Risk factors via First Street. Map © Google.
Why this score? — see what drove the C- grade
The composite is a weighted blend of 9 inputs, each scored 0–100. Each bar is that input's sub-score; the figure is the points it added to the 100-point composite (weight × sub-score).
- Cash flow +23.5/30.0
- DSCR +7.5/10.0
- 1% rule +6.3/10.0
- Appreciation +5.0/10.0
- Livability +2.8/5.0
- Rent growth +2.5/5.0
- Condition / age +2.5/5.0
- ARV discount +2.4/15.0
- Schools +0.9/10.0
$78,000
🖨 Deal sheet (PDF) 📄 Offer letter ✓ Due diligence
Listing remarks MLS
Welcome to 213 S Gardner Street in West Frankfort — a fully updated, move-in ready home that is as cute as can be! From the moment you walk in, you’ll love the fresh updates, modern finishes, and cozy feel throughout. Every detail has been thoughtfully redone, making this home perfect for anyone looking for low-maintenance living with style. Whether you’re a first-time buyer, downsizing, or looking for an investment opportunity, this charming home checks all the boxes. Don’t miss your chance to own this adorable, turn-key property in a convenient location!
Key facts
- Parking
- Built 1950
- Listed 93 days
Neighborhood map
What this means for you Summary
Snapshot
- This is a 3-bed/1.0-bath other listed at $78k.
Deal economics
- At list price, monthly cash flow is $145 ($2k/yr) — positive.
- The deal already cash-flows at list — no discount required.
- Meets the 1% rule at list price ($879 rent vs $78k).
- Recommended offer: $71k (9.0% below list) — sets the bar for market timing.
- Cap rate 8.5% vs local median 5.9% in West Frankfort — top-decile yield for the area; either an underpriced asset or a hidden risk that comps aren't pricing in. Stress-test before assuming the spread holds.
Location & tenants
- Location reads 56/100 on livability (#1,210 in IL) — a working-class tenant base; expect higher turnover. Strengths: cost of living A+, housing A+; Watch: crime D, schools F, amenities F.
- Frankfort CUSD 168 (town): math 6% / reading 16% proficiency, ranked #577 of 620 in IL (top 93%) — low school quality limits family demand, transient renter base, plan for 1-2y turnover.
- Market conditions: 2 active listings in the ZIP; 3 comparable units currently listed for rent nearby; rentals lingering (median 45d on market — plan ~5-8 weeks vacancy on turnover, expect pricing pressure); 100% of comp listings sitting > 30 days — soft ceiling on asking rent; 17 units permitted in Franklin County in 2024 (0 in 5+ unit buildings).
Forward outlook
- In year one you build about $3k of equity ($539 loan paydown + $2k appreciation (3.0% local appreciation)).
- Franklin County population projected at -16% by 2050 — secular population decline; favor cash flow + early exit over multi-decade hold.
- At projected returns (3.0% appreciation + 3.0% rent growth), your $22k cash investment doubles in ~5 years — after that, you're playing with house money.
Negotiation context
- It's been on market 94 days — a 9% lower offer ($71k) is reasonable based on typical stale-listing flexibility.
- 6 sale attempts since 17y ago with the ask held roughly flat each time — persistent listings suggest the price (not the market) is what's stuck; bring a comps-based counter.
- Current owner paid $26k; list at $78k implies a 200% gain — meaningful room to come down on a strong offer.
Risks & watch-outs
- Watch-outs: built in 1950 — expect roof / HVAC / electrical / plumbing capex.
- Climate carrying-cost: extreme-heat days projected 7→21/yr by 2055 (HVAC capex compounding) — expect insurance premiums to compound above CPI over the hold.
Questions for the listing agent
- It's been on market 94 days. Have you received any prior offers? Is the seller open to a 9% concession, seller financing, or rate buy-down credit?
- Built in 1950 — when were the roof, HVAC, electrical panel, plumbing, and water heater last replaced?
- Why hasn't it sold? Are there any deal-killer items the seller is aware of (foundation, flood, title, zoning, code violations)?
- Is there a deadline driving the sale (1031 exchange, divorce, estate, relocation)? That informs how much negotiation room exists.
- Schools are F-rated, which usually means shorter tenancies and higher turnover. Who's the typical renter profile here, and what's been the actual vacancy rate?
- Crime grade is D in this area — have there been break-ins, vandalism, or insurance claims at this property in the last 3 years? What carrier currently insures it and at what premium?
- What's the average days-on-market for RENTAL listings here right now (not sales)? A rising rental-DOM trend means longer vacancies and softer asking-rent achievability than the comps imply.
- What's the recent tenant-quality profile in this submarket — average credit score on applications, eviction rate, late-payment / NSF rate, and stable-employment percentage? A property-management company in the area should have these aggregated.
- How much new for-sale + rental construction is in the pipeline within 1–3 miles? Heavy new supply typically softens prices + rents 12–24 months out; constrained supply supports both.
Investment metrics
- 1% rule
- 1.13% ✓
- Cap rate
- 8.52%
- Cash-on-cash
- 7.96%
- DSCR
- 1.35
- GRM
- 7.4
CMA / ARV
- ARV (median comp)
- $70,088
- List price
- $78,000
- Delta
- 11.29%
- Verdict
- OVERPRICED
- Comps
- 20 within 1.0 mi
Projected returns pro-forma
3.0% appreciation · 3.0% rent growth · sell at horizon
- IRR
- 15.0%
- Equity multiple
- 1.85×
- Total profit
- $18,648
- Equity at exit
- $35,072
- IRR
- 16.7%
- Equity multiple
- 3.45×
- Total profit
- $53,486
- Equity at exit
- $54,050
Cash invested: $21,840 (down + closing). Projections, not guarantees.
Landlord ↔ Tenant lean methodology
- Overall (STATE)
- 43 Moderately Tenant-Leaning
- State Illinois
- 43 Moderately Tenant-Leaning · D+7
- County
- — inherits STATE
- City
- — inherits STATE
ZIP-level market 62896-2517
- Active inventory
- 2
- Price-to-rent
- 7.4×
Monthly cashflow live
- Estimated rent
- $879 medium interval (Pro) →
- Mortgage (P&I)
- −$409
- Tax from tax record
- −$108 /mo · $1,292/yr
- Insurance
- −$32
- HOA
- −$0
- Vacancy / Maint / Mgmt
- −$185
- Net cashflow
- $145
Break-even live
Sensitivity live
| Price | -10% $189 | -5% $167 | +0% $145 | +5% $123 | +10% $101 |
|---|---|---|---|---|---|
| Rent | -10% $76 | -5% $110 | +0% $145 | +5% $180 | +10% $214 |
| Rate | -1.0pp $184 | -0.5pp $165 | base $145 | +0.5pp $125 | +1.0pp $104 |
UW: 25.0% down · 7.5% · 30yr · 1.5% tax · 5.0% vac · 8.0% maint · 8.0% mgmt
Financing live
Cash to close
- Down payment
- $19,500
- Closing costs
- $2,340
- Reserves months
- —
- Total cash needed
- —
Loan-product check · same deal, 3 products live
Conventional
25% down · 7.5% · 30yr
- Down + closing
- —
- Monthly P&I
- —
- Monthly cashflow
- —
- DSCR
- —
- Eligible?
- —
Personal DTI + credit; lowest rate.
DSCR
20% down · 8.5% · 30yr
- Down + closing
- —
- Monthly P&I
- —
- Monthly cashflow
- —
- DSCR
- —
- Eligible?
- —
No personal income docs; deal must DSCR.
Hard money
10% down · 12.0% · 12mo
- Down + closing
- —
- Monthly P&I
- —
- Monthly cashflow
- —
- DSCR
- —
- Eligible?
- —
Short-term bridge; refi at stabilization.
Rent comps 3 comps
| Address | Beds | Baths | Sqft | Rent | $/sqft | DOM | Units | Dist |
|---|---|---|---|---|---|---|---|---|
| 5 Razer Dr Unit 1 West Frankfort, IL | 2.0 | 1.5 | 1100 | $900 | $0.82 | 45d | 1 | 0.51mi |
| 403 E Poplar St West Frankfort, IL | 3.0 | 1.0 | 1200 | $900 | $0.75 | 45d | 1 | 0.67mi |
| 411 N Cochran St West Frankfort, IL | 2.0 | 1.0 | 960 | $795 | $0.83 | 45d | 1 | 1.24mi |
Listing history 33 events
-
2026-06-21days on market $78,000 Active 94 DOM
-
2026-06-21days on market $78,000 Active 93 DOM
-
2026-06-18days on market $78,000 Active 91 DOM
-
2026-06-17days on market $78,000 Active 90 DOM
-
2026-06-16days on market $78,000 Active 89 DOM
-
2026-06-15days on market $78,000 Active 88 DOM
-
2026-06-13days on market $78,000 Active 86 DOM
-
2026-06-12days on market $78,000 Active 85 DOM
-
2026-06-09days on market $78,000 Active 82 DOM
-
2026-06-09price $78,000 Active 81 DOM
-
2026-06-08days on market $80,000 Active 81 DOM
-
2026-06-07days on market $80,000 Active 80 DOM
-
2026-06-04days on market $80,000 Active 76 DOM
-
2026-06-02days on market $80,000 Active 75 DOM
-
2026-06-01days on market $80,000 Active 74 DOM
-
2026-05-31days on market $80,000 Active 73 DOM
-
2026-05-31days on market $80,000 Active 72 DOM
-
2026-04-14status Active 586-char remark
Show marketing remark (586 chars)
Welcome to 213 S Gardner Street in West Frankfort — a fully updated, move-in ready home that is as cute as can be! From the moment you walk in, you’ll love the fresh updates, modern finishes, and cozy feel throughout. Every detail has been thoughtfully redone, making this home perfect for anyone looking for low-maintenance living with style. Whether you’re a first-time buyer, downsizing, or looking for an investment opportunity, this charming home checks all the boxes. Don’t miss your chance to own this adorable, turn-key property in a convenient location!
-
2026-03-30historical Under Contract 586-char remark
Show marketing remark (586 chars)
Welcome to 213 S Gardner Street in West Frankfort — a fully updated, move-in ready home that is as cute as can be! From the moment you walk in, you’ll love the fresh updates, modern finishes, and cozy feel throughout. Every detail has been thoughtfully redone, making this home perfect for anyone looking for low-maintenance living with style. Whether you’re a first-time buyer, downsizing, or looking for an investment opportunity, this charming home checks all the boxes. Don’t miss your chance to own this adorable, turn-key property in a convenient location!
-
2026-03-18$80,000 Active 586-char remark
Show marketing remark (586 chars)
Welcome to 213 S Gardner Street in West Frankfort — a fully updated, move-in ready home that is as cute as can be! From the moment you walk in, you’ll love the fresh updates, modern finishes, and cozy feel throughout. Every detail has been thoughtfully redone, making this home perfect for anyone looking for low-maintenance living with style. Whether you’re a first-time buyer, downsizing, or looking for an investment opportunity, this charming home checks all the boxes. Don’t miss your chance to own this adorable, turn-key property in a convenient location!
-
2021-08-06historical
-
2021-08-06historical
-
2021-08-06historical
-
2017-09-05historical
-
2017-01-23soldstatus $26,000
-
2017-01-23soldstatus $26,000
-
2016-11-29$29,900
-
2016-11-29$29,900
-
2012-04-07historical
-
2009-04-08soldstatus $17,000
-
2009-04-08soldstatus $17,000
-
2009-01-07$24,000
-
2009-01-07$24,000
ⓘ Source: listings_history table (triggers on properties + properties_extension) + one-shot
backfill from property_details.listing_events for pre-trigger history.
Tax reassessment forecast IL · Partial reset (capped growth)
- Current annual tax
- $1,292 · $108/mo
- Projected year-2 tax
- $1,531 · $128/mo
- Expected delta
- +$239/yr (+$20/mo · 18.5%)
ⓘ Screening estimate from a state-policy table — verify with the county assessor before closing.
Climate risk First Street
- Flood 1/10 Low FEMA zone X (unshaded) · 0% chance over 30 yrs
- Wildfire 1/10 Low
- Heat 5/10 Major 7 d/yr ≥107°F today · 21 d/yr by 30 yrs out
- Wind 2/10 Low 2% chance of damaging wind over 30 yrs
- Air quality 2/10 Low 0 unhealthy d/yr today · 1 by 30 yrs out
Nearby sold comps map
Loading sold comps map…
Walkable amenities ~0.75 mi
Loading nearby amenities…
Taxation est. · year 1
- Rental income
- $10,544
- − Mortgage interest
- −$4,369
- − Property taxes
- −$1,292
- − Insurance
- −$390
- − Repairs & maintenance
- −$844
- − Management
- −$844
- − Depreciation
- −$2,269
- Taxable income
- $537
- Est. tax owed @ 24.0%
- −$129
- After-tax cash flow
- $1,611/yr
For passive investors: Depreciation is non-cash, so a rental often shows a tax loss while cash-flowing — sheltering income. Rental losses are passive: they offset passive income freely, and up to $25,000/yr can offset ordinary (W-2) income if you actively participate and your MAGI is under $100k (phasing out to $0 by $150k); unused losses carry forward. On sale, claimed depreciation is recaptured at up to 25%, and gains may owe capital-gains tax (a 1031 exchange can defer both). Figures are a year-1 estimate at your 24.0% rate — not tax advice; consult a CPA.
Schools (NCES district)
- District
- Frankfort CUSD 168
- NCES district ID
- 1741580
- Math proficiency
- 6% ▼ -9.00%
- Reading proficiency
- 16% ▼ -10.00%
- Median HH income
- $34,447
- Composite
- 8.93/100
- National rank
- #9886
- State rank
- #577 of 620 in IL
Livability — West Frankfort
- Score
- 56/100
- State rank
- #1210
- US rank
- #22742
Category grades
Schools grade is shown separately in the Schools card above.
Census & demographics
- Census place
- West Frankfort, IL
Population outlook (Franklin County) Hauer SSP2
- Today (2025)
- 37,954 people
- By 2030
- 36,828 · -3.0%
- By 2040
- 34,452 · -9.2%
- By 2050
- 31,855 · -16.1%
- By 2075
- 25,171 · -33.7%
- By 2100
- 18,462 · -51.4%
Not yet ingested
- Political lean
- —
- Race & ethnicity
- —
- Common origin
- —
- Civics
- —
Market trends
- HPI YoY
- —
- Current HPI
- —
- Rent YoY
- —
- Metro
- —
- State GDP YoY
- ▲ 1.59%
- F500 in state
- 60
Industry mix (Fortune 500 HQ in IL)
| Industry | F500 HQs | Revenue |
|---|---|---|
| Insurance | 4 | $201B |
|
||
| Consumer Goods | 4 | $87B |
|
||
| Industrial Machinery | 3 | $64B |
|
||
| Healthcare | 2 | $55B |
|
||
| Retail / Pharmacy | 1 | $148B |
|
||
| Agriculture / Food | 1 | $86B |
|
||
Price history
+233.3% since first listed16 events — show timeline
- 2026-04-14 Relisted — RMLSA as Distributed by MLS Grid
- 2026-03-30 Contingent — RMLSA as Distributed by MLS Grid
- 2026-03-18 Listed $80,000 RMLSA as Distributed by MLS Grid
- 2021-08-06 Listing Removed — RMLSA as Distributed by MLS Grid
- 2021-08-06 Listing Removed — RMLSA as Distributed by MLS Grid
- 2021-08-06 Listing Removed — RMLSA as Distributed by MLS Grid
- 2017-09-05 Listing Removed — MRED as Distributed by MLS Grid
- 2017-01-23 Sold (MLS) $26,000 RMLSA as Distributed by MLS Grid
- 2017-01-23 Sold (MLS) $26,000 MRED as Distributed by MLS Grid
- 2016-11-29 Listed $29,900 RMLSA as Distributed by MLS Grid
- 2016-11-29 Listed $29,900 MRED as Distributed by MLS Grid
- 2012-04-07 Listing Removed — MRED as Distributed by MLS Grid
- 2009-04-08 Sold (MLS) $17,000 RMLSA as Distributed by MLS Grid
- 2009-04-08 Sold (MLS) $17,000 MRED as Distributed by MLS Grid
- 2009-01-07 Listed $24,000 RMLSA as Distributed by MLS Grid
- 2009-01-07 Listed $24,000 MRED as Distributed by MLS Grid
Property tax history
+4.3%/yrLatest (2024): $1,292 · +8.0% YoY. Source: county tax records.
Cash-flow waterfall
monthlySold comps — $/sqft
last 12 mo · ≤1 miLoading sold comps…