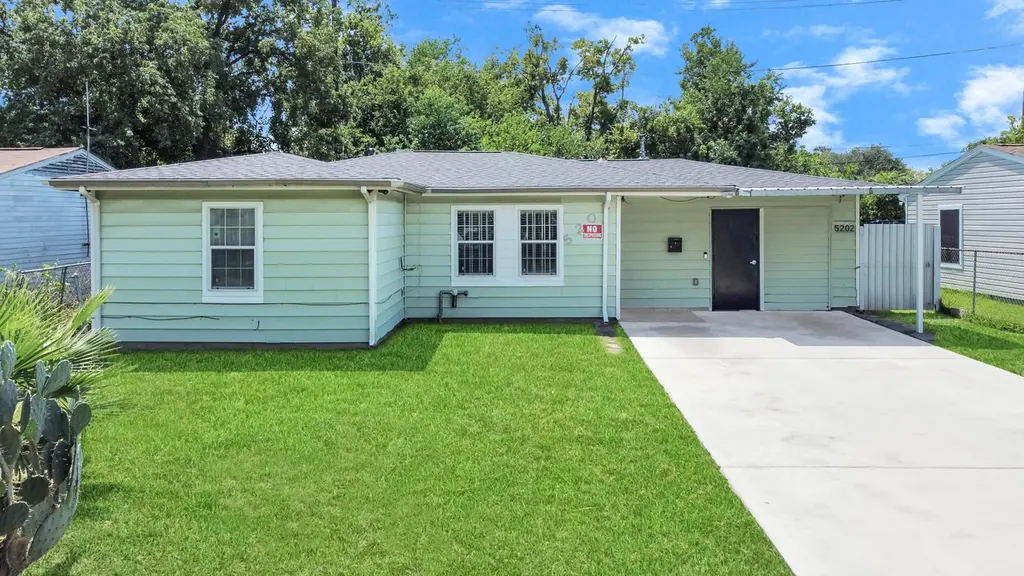
5202 Pensdale St · Houston, TX
Flood risk 8/10 · Major
- FEMA flood zone
- X (unshaded)
- Chance of flooding over 30 yrs
- 0.99%
- Est. flood insurance / yr
- $507 – $1,088
Fire risk 1/10 · Minimal
- Est. fire insurance / yr
- $1,222 – $2,270
Heat risk 9/10 · Severe
- Hot days now (above 109°F)
- 7 days/yr
- Hot days in 30 yrs
- 24 days/yr
Wind risk 9/10 · Severe
- Chance of severe wind over 30 yrs
- 99.0%
Air-quality risk 2/10 · Minimal
- Unhealthy air days now
- 2 days/yr
- Unhealthy air days in 30 yrs
- 2 days/yr
Risk factors via First Street. Map © Google.
Why this score? — see what drove the C+ grade
The composite is a weighted blend of 9 inputs, each scored 0–100. Each bar is that input's sub-score; the figure is the points it added to the 100-point composite (weight × sub-score).
- Cash flow +24.9/30.0
- ARV discount +10.4/15.0
- DSCR +8.1/10.0
- 1% rule +6.1/10.0
- Rent growth +3.9/5.0
- Livability +3.7/5.0
- Schools +2.7/10.0
- Condition / age +2.5/5.0
- Appreciation +0.0/10.0
$165,000
🖨 Deal sheet (PDF) 📄 Offer letter ✓ Due diligence
Listing remarks MLS
Only 15 minutes from Downtown and University of Houston! This home is packed with upgrades over $70,000 worth and ready for you to move in! The A/C was replaced in 2017. BRAND NEW concrete driveway, Roof, electrical and plumbing system (PEX A pipes). Updated Windows and window shades keep the home bright and energy-efficient. Owner installed home water filter system, and gutters. Fresh interior paint, and the sellers added a covered patio in the back so you can relax or entertain outdoors. Custom built shed in the back and added Submersible stormwater pump in the back for when it rains the water can be pumped to the front and drain out water.
Key facts
- Custom built shed
- Covered patio
- Concrete driveway
Tags
Neighborhood map
What this means for you Summary
Snapshot
- This is a 3-bed/1.0-bath single-family listed at $165k.
Deal economics
- At list price, monthly cash flow is $289 ($3k/yr) — positive.
- The deal already cash-flows at list — no discount required.
- Meets the 1% rule at list price ($2k rent vs $165k).
- Recommended offer: $155k (6.0% below list) — sets the bar for market timing.
- Cap rate 8.9% vs local median 3.2% in Houston — top-decile yield for the area; either an underpriced asset or a hidden risk that comps aren't pricing in. Stress-test before assuming the spread holds.
Location & tenants
- Location reads 74/100 on livability (#184 in TX, #4,771 nationally) — a middle-class / working-renter tenant base. Strengths: amenities A+, cost of living A+, housing A+; Watch: schools D, crime F.
- Houston ISD (urban): math 27% / reading 35% proficiency, ranked #593 of 826 in TX (top 72%) — families likely to look elsewhere, expect single-tenant / working-renter base with shorter leases; 71% free/reduced lunch — lower-income household profile, screen leases tightly.
- Market conditions: Rents rising fast (+5.5%/yr); 345 active listings in the ZIP; 37 comparable units currently listed for rent nearby; rentals at typical pace (median 21d on market — plan ~3-4 weeks tenant-placement turnaround); lower-income renter base — watch delinquency; 29,883 units permitted in Harris County in 2024 (8,621 in 5+ unit buildings).
- At $1,829/mo this rent would consume 58% of the median local household income ($38k/yr) (locally 1728% of renters already pay >50% of income on rent) — very limited rent-growth headroom before tenants either downsize or default.
Forward outlook
- Local home prices are declining (-3.0%/yr); year-one equity from $1k of loan paydown is wiped out by about $5k of value loss. Plan a longer hold.
- Harris County population projected at +47% by 2050 — long-run rental-demand tailwind backs the buy-and-hold thesis.
- At projected returns (-3.0% appreciation + 5.5% rent growth), your $46k cash investment doubles in ~10 years — after that, you're playing with house money.
Negotiation context
- It's been on market 71 days — a 6% lower offer ($155k) is reasonable based on typical stale-listing flexibility.
- 6 sale attempts since 12y ago with the ask held roughly flat each time — persistent listings suggest the price (not the market) is what's stuck; bring a comps-based counter.
Risks & watch-outs
- Watch-outs: flood insurance adds $66/mo; built in 1955 — expect roof / HVAC / electrical / plumbing capex.
- Climate carrying-cost: severe flood risk; severe wind risk, 99% chance of damaging wind over 30y; extreme-heat days projected 7→24/yr by 2055 (HVAC capex compounding) — expect insurance premiums to compound above CPI over the hold.
Questions for the listing agent
- It's been on market 71 days. Have you received any prior offers? Is the seller open to a 6% concession, seller financing, or rate buy-down credit?
- Built in 1955 — when were the roof, HVAC, electrical panel, plumbing, and water heater last replaced?
- What's the actual annual flood-insurance premium (NFIP or private), and is the property in a SFHA with mandatory coverage?
- Why hasn't it sold? Are there any deal-killer items the seller is aware of (foundation, flood, title, zoning, code violations)?
- Is there a deadline driving the sale (1031 exchange, divorce, estate, relocation)? That informs how much negotiation room exists.
- Schools are D-rated, which usually means shorter tenancies and higher turnover. Who's the typical renter profile here, and what's been the actual vacancy rate?
- Crime grade is F in this area — have there been break-ins, vandalism, or insurance claims at this property in the last 3 years? What carrier currently insures it and at what premium?
- What's the average days-on-market for RENTAL listings here right now (not sales)? A rising rental-DOM trend means longer vacancies and softer asking-rent achievability than the comps imply.
- What's the recent tenant-quality profile in this submarket — average credit score on applications, eviction rate, late-payment / NSF rate, and stable-employment percentage? A property-management company in the area should have these aggregated.
- How much new for-sale + rental construction is in the pipeline within 1–3 miles? Heavy new supply typically softens prices + rents 12–24 months out; constrained supply supports both.
Investment metrics
- 1% rule
- 1.11% ✓
- Cap rate
- 8.88%
- Cash-on-cash
- 9.24%
- DSCR
- 1.41
- GRM
- 7.5
CMA / ARV
- ARV (median comp)
- $176,308
- List price
- $165,000
- Delta
- -6.41%
- Verdict
- FAIR
- Comps
- 20 within 1.0 mi
Show comp detail 12 sales within ~0.75 mi
| Address | Dist | Beds/Ba | Sqft | Sold | Price | $/sf | Match |
|---|---|---|---|---|---|---|---|
| 8126 Marcy Dr | 0.15mi | 4/2.0 (+1) | 1,240 (+6%) | 1mo | $195,000 | $157 | 72 |
| 5007 Northridge Dr | 0.31mi | 3/1.0 | 1,069 (-8%) | 2mo | $163,900 | $153 | 70 |
| 5602 Beldart St | 0.55mi | 3/1.5 | 1,173 (+1%) | 3mo | $160,000 | $136 | 69 |
| 5318 Longmeadow St | 0.52mi | 3/1.0 | 1,138 (-2%) | 3mo | $125,000 | $110 | 69 |
| 7713 St Lo Rd | 0.51mi | 3/2.0 | 1,151 (-1%) | 4mo | $199,900 | $174 | 67 |
| 4842 Larkspur St | 0.47mi | 4/2.0 (+1) | 1,200 (+3%) | 2mo | $200,000 | $167 | 62 |
| 4821 Alvin St | 0.36mi | 3/2.0 | 1,307 (+12%) | 4mo | $174,000 | $133 | 56 |
| 4918 Carmen St | 0.73mi | 3/2.0 | 1,258 (+8%) | 1mo | $213,000 | $169 | 48 |
| 5225 Longmeadow St | 0.53mi | 4/2.0 (+1) | 1,293 (+11%) | 2mo | $138,000 | $107 | 47 |
| 5639 Westover St | 0.55mi | 4/2.0 (+1) | 1,289 (+10%) | 3mo | $230,000 | $178 | 46 |
| 5707 Lyndhurst Dr | 0.60mi | 3/2.0 | 1,329 (+14%) | 1mo | $200,000 | $150 | 44 |
| 5622 Beldart St | 0.59mi | 2/1.0 (-1) | 1,002 (-14%) | 2mo | $120,000 | $120 | 43 |
Match score weights: distance 35% · size 25% · config 20% · recency 20%. Top-matched comps best support the ARV.
Projected returns pro-forma
-3.0% appreciation · 5.45% rent growth · sell at horizon
- IRR
- -2.0%
- Equity multiple
- 0.92×
- Total profit
- $-3,649
- Equity at exit
- $24,602
- IRR
- 10.2%
- Equity multiple
- 1.88×
- Total profit
- $40,636
- Equity at exit
- $14,266
Cash invested: $46,200 (down + closing). Projections, not guarantees.
Landlord ↔ Tenant lean methodology
- Overall (STATE)
- 87 Strongly Landlord-Friendly
- State Texas
- 87 Strongly Landlord-Friendly · R+5
- County
- — inherits STATE
- City
- — inherits STATE
ZIP-level market 77033
- Home prices YoY
- -16.3%
- Rents YoY
- 5.5%
- Active inventory
- 345
- Price-to-rent
- 7.5×
Monthly cashflow live
- Estimated rent
- $1,829 high interval (Pro) →
- Mortgage (P&I)
- −$865
- Tax from tax record
- −$155 /mo · $1,859/yr
- Insurance
- −$69
- Flood insurance flood zone
- −$66 /mo · $798/yr
- HOA
- −$0
- Vacancy / Maint / Mgmt
- −$384
- Net cashflow
- $289
Break-even live
Sensitivity live
| Price | -10% $383 | -5% $336 | +0% $289 | +5% $243 | +10% $196 |
|---|---|---|---|---|---|
| Rent | -10% $145 | -5% $217 | +0% $289 | +5% $362 | +10% $434 |
| Rate | -1.0pp $373 | -0.5pp $331 | base $289 | +0.5pp $247 | +1.0pp $203 |
UW: 25.0% down · 7.5% · 30yr · 1.5% tax · 5.0% vac · 8.0% maint · 8.0% mgmt
Financing live
Cash to close
- Down payment
- $41,250
- Closing costs
- $4,950
- Reserves months
- —
- Total cash needed
- —
Loan-product check · same deal, 3 products live
Conventional
25% down · 7.5% · 30yr
- Down + closing
- —
- Monthly P&I
- —
- Monthly cashflow
- —
- DSCR
- —
- Eligible?
- —
Personal DTI + credit; lowest rate.
DSCR
20% down · 8.5% · 30yr
- Down + closing
- —
- Monthly P&I
- —
- Monthly cashflow
- —
- DSCR
- —
- Eligible?
- —
No personal income docs; deal must DSCR.
Hard money
10% down · 12.0% · 12mo
- Down + closing
- —
- Monthly P&I
- —
- Monthly cashflow
- —
- DSCR
- —
- Eligible?
- —
Short-term bridge; refi at stabilization.
Rent comps 37 comps
| Address | Beds | Baths | Sqft | Rent | $/sqft | DOM | Units | Dist |
|---|---|---|---|---|---|---|---|---|
| 7918 Jutland Rd Houston, TX | 3.0 | 1.0 | 996 | $1,295 | $1.30 | 44d | 1 | 0.22mi |
| 5222 Northridge Dr Houston, TX | 4.0 | 2.0 | 1300 | $1,850 | $1.42 | 25d | 1 | 0.25mi |
| 5314 Northridge Dr Unit A Houston, TX | 3.0 | 2.0 | 872 | $1,185 | $1.36 | 44d | 1 | 0.29mi |
| 5623 Bellfort St Houston, TX | 4.0 | 1.0 | 1320 | $1,700 | $1.29 | 16d | 1 | 0.47mi |
| 5036 Mallow St Houston, TX | 3.0 | 3.0 | 1472 | $2,050 | $1.39 | 44d | 1 | 0.50mi |
| 5407 Thrush Dr Houston, TX | 4.0 | 1.0 | 1407 | $1,495 | $1.06 | 15d | 1 | 0.54mi |
| 8107 Calhoun Rd Houston, TX | 3.0 | 2.5 | 1304 | $2,250 | $1.73 | 25d | 1 | 0.56mi |
| 7818 Calhoun Rd Unit 8 Houston, TX | 2.0 | 1.0 | 800 | $1,200 | $1.50 | 44d | 1 | 0.64mi |
| 4723 Mallow St Houston, TX | 3.0 | 2.5 | 1472 | $1,850 | $1.26 | 6d | 1 | 0.64mi |
| 8521 Dosia St Houston, TX | 3.0 | 2.0 | 1028 | $1,665 | $1.62 | 13d | 1 | 0.68mi |
| 4609 Bricker St Unit C Houston, TX | 2.0 | 1.5 | 1100 | $3,200 | $2.91 | 13d | 1 | 0.71mi |
| 4609 Bricker St Unit B Houston, TX | 3.0 | 2.5 | 1300 | $3,500 | $2.69 | 13d | 1 | 0.71mi |
| 4609 Bricker St Unit ABC Houston, TX | 3.0 | 2.5 | 1375 | $3,500 | $2.55 | 12d | 1 | 0.71mi |
| 4615 Redbud St Unit b Houston, TX | 3.0 | 2.0 | 872 | $1,149 | $1.32 | 25d | 1 | 0.72mi |
| 4526 Knoxville St Unit A Houston, TX | 3.0 | 2.5 | 1474 | $1,775 | $1.20 | 16d | 1 | 0.73mi |
| 4918 Wilmington St Unit A Houston, TX | 3.0 | 3.0 | 1300 | $2,100 | $1.62 | 44d | 1 | 0.80mi |
| 5767 Belcrest St Houston, TX | 4.0 | 2.0 | 1480 | $1,790 | $1.21 | 44d | 1 | 0.81mi |
| 4810 Wilmington St Unit A Houston, TX | 3.0 | 2.0 | 1165 | $1,650 | $1.42 | 44d | 1 | 0.84mi |
| 5818 Glenhurst Dr Houston, TX | 3.0 | 2.0 | 1441 | $1,750 | $1.21 | 0d | 1 | 0.85mi |
| 4410 Bellfort Ave Unit 4404 8 Houston, TX | 2.0 | 1.0 | 812 | $999 | $1.23 | 8d | 1 | 0.88mi |
| 4530 Mayflower St Houston, TX | 3.0 | 2.0 | 1302 | $1,800 | $1.38 | 44d | 1 | 0.90mi |
| 5942 Ridgeway Dr Houston, TX | 4.0 | 2.0 | 1490 | $2,250 | $1.51 | 44d | 1 | 1.00mi |
| 4942 Bataan Rd Unit 77033 Houston, TX | 4.0 | 2.0 | 1350 | $1,800 | $1.33 | 44d | 1 | 1.05mi |
| 9509 Merle St Unit 9509A Houston, TX | 4.0 | 2.5 | 1404 | $1,500 | $1.07 | 44d | 1 | 1.06mi |
| 4326 Larkspur St Unit 3 Houston, TX | 2.0 | 1.0 | 800 | $1,200 | $1.50 | 18d | 1 | 1.07mi |
| 4117 Shelby Cir Unit 1230900P Houston, TX | 4.0 | 2.0 | 1367 | $5,253 | $3.84 | 0d | 1 | 1.18mi |
| 4207 Phlox St Houston, TX | 2.0 | 1.0 | 736 | $962 | $1.31 | 0d | 2 | 1.19mi |
| 4205 Phlox St Unit 2 BEDROOM 6 Houston, TX | 2.0 | 1.0 | 736 | $860 | $1.17 | 19d | 1 | 1.21mi |
| 5954 Doolittle Blvd Houston, TX | 3.0 | 2.0 | 1371 | $1,575 | $1.15 | 44d | 1 | 1.25mi |
| 5408 Groveton St Houston, TX | 4.0 | 2.0 | 1472 | $1,983 | $1.35 | 0d | 1 | 1.31mi |
| 6928 Paris St Houston, TX | 3.0 | 2.0 | 1276 | $1,900 | $1.49 | 0d | 1 | 1.39mi |
| 6926 Paris St Houston, TX | 3.0 | 2.0 | 1276 | $1,900 | $1.49 | 0d | 1 | 1.40mi |
| 5537 Bataan Rd Houston, TX | 2.0 | 1.0 | 880 | $1,300 | $1.48 | 44d | 1 | 1.42mi |
| 7823 Gladstone St Houston, TX | 2.0 | 2.0 | 850 | $1,600 | $1.88 | 44d | 1 | 1.43mi |
| 7826 Gladstone St Houston, TX | 2.0 | 1.0 | 760 | $1,250 | $1.64 | 0d | 1 | 1.46mi |
| 4205 Grassmere St Houston, TX | 2.0 | 1.0 | 824 | $900 | $1.09 | 25d | 1 | 1.48mi |
| 8328 Corinth St Unit B Houston, TX | 3.0 | 2.5 | 1500 | $2,800 | $1.87 | 21d | 1 | 1.49mi |
Listing history 25 events
-
2026-06-21days on market $165,000 Active 71 DOM
-
2026-06-18days on market $165,000 Active 68 DOM
-
2026-06-17days on market $165,000 Active 67 DOM
-
2026-06-16days on market $165,000 Active 66 DOM
-
2026-06-15days on market $165,000 Active 65 DOM
-
2026-06-13days on market $165,000 Active 63 DOM
-
2026-06-10days on market $165,000 Active 59 DOM
-
2026-06-08days on market $165,000 Active 58 DOM
-
2026-06-07days on market $165,000 Active 57 DOM
-
2026-06-04days on market $165,000 Active 54 DOM
-
2026-06-01days on market $165,000 Active 51 DOM
-
2026-05-31days on market $165,000 Active 50 DOM
-
2026-04-11historical
Show marketing remark (651 chars)
Only 15 minutes from Downtown and University of Houston! This home is packed with upgrades over $70,000 worth and ready for you to move in! The A/C was replaced in 2017. BRAND NEW concrete driveway, Roof, electrical and plumbing system (PEX A pipes). Updated Windows and window shades keep the home bright and energy-efficient. Owner installed home water filter system, and gutters. Fresh interior paint, and the sellers added a covered patio in the back so you can relax or entertain outdoors. Custom built shed in the back and added Submersible stormwater pump in the back for when it rains the water can be pumped to the front and drain out water.
-
2026-04-11$165,000 Active 651-char remark
Show marketing remark (651 chars)
Only 15 minutes from Downtown and University of Houston! This home is packed with upgrades over $70,000 worth and ready for you to move in! The A/C was replaced in 2017. BRAND NEW concrete driveway, Roof, electrical and plumbing system (PEX A pipes). Updated Windows and window shades keep the home bright and energy-efficient. Owner installed home water filter system, and gutters. Fresh interior paint, and the sellers added a covered patio in the back so you can relax or entertain outdoors. Custom built shed in the back and added Submersible stormwater pump in the back for when it rains the water can be pumped to the front and drain out water.
-
2026-02-16$180,000 Active
-
2026-02-16historical
-
2025-12-05$195,000 Active
-
2025-12-05historical
-
2025-10-19historical
-
2025-10-17$208,000 Active
-
2025-09-15$215,000 Active
-
2014-08-14soldstatus Sold
-
2014-07-25status Pending
-
2014-07-14$31,300 Active
-
1988-01-02soldstatus
ⓘ Source: listings_history table (triggers on properties + properties_extension) + one-shot
backfill from property_details.listing_events for pre-trigger history.
Tax reassessment forecast TX · Resets to sale price
- Current annual tax
- $1,859 · $155/mo
- Projected year-2 tax
- $3,020 · $252/mo
- Expected delta
- +$1,160/yr (+$97/mo · 62.4%)
ⓘ Screening estimate from a state-policy table — verify with the county assessor before closing.
Climate risk First Street
- Flood 8/10 Severe FEMA zone X (unshaded) · 99% chance over 30 yrs
- Wildfire 1/10 Low
- Heat 9/10 Extreme 7 d/yr ≥109°F today · 24 d/yr by 30 yrs out
- Wind 9/10 Extreme 99% chance of damaging wind over 30 yrs
- Air quality 2/10 Low 2 unhealthy d/yr today · 2 by 30 yrs out
Nearby sold comps map
Loading sold comps map…
Walkable amenities ~0.75 mi
Loading nearby amenities…
Taxation est. · year 1
- Rental income
- $21,947
- − Mortgage interest
- −$9,243
- − Property taxes
- −$1,859
- − Insurance
- −$1,622
- − Repairs & maintenance
- −$1,756
- − Management
- −$1,756
- − Depreciation
- −$4,800
- Taxable income
- $911
- Est. tax owed @ 24.0%
- −$219
- After-tax cash flow
- $3,254/yr
For passive investors: Depreciation is non-cash, so a rental often shows a tax loss while cash-flowing — sheltering income. Rental losses are passive: they offset passive income freely, and up to $25,000/yr can offset ordinary (W-2) income if you actively participate and your MAGI is under $100k (phasing out to $0 by $150k); unused losses carry forward. On sale, claimed depreciation is recaptured at up to 25%, and gains may owe capital-gains tax (a 1031 exchange can defer both). Figures are a year-1 estimate at your 24.0% rate — not tax advice; consult a CPA.
Schools (NCES district)
- District
- Houston ISD
- NCES district ID
- 4823640
- Math proficiency
- 27% ▼ -18.00%
- Reading proficiency
- 35% ▼ -6.00%
- Median HH income
- $46,054
- Composite
- 26.63/100
- National rank
- #7173
- State rank
- #593 of 826 in TX
Livability — Houston
- Score
- 74/100
- State rank
- #184
- US rank
- #4771
Category grades
Schools grade is shown separately in the Schools card above.
Census & demographics
- Census place
- Houston, TX
- County
- Harris County · 4,702,590 people
- City population
- 3,226,434
- Metro
- Houston-The Woodlands-Sugar Land, TX
- Population (ZIP)
- 29,154
- Household income
- $38,071
- Rent vs Own
- Severe rent burden
- 1728.0
Population outlook (Harris County) Hauer SSP2
- Today (2025)
- 5,571,493 people
- By 2030
- 6,089,821 · +9.3%
- By 2040
- 7,142,806 · +28.2%
- By 2050
- 8,185,864 · +46.9%
- By 2075
- 10,574,329 · +89.8%
- By 2100
- 12,109,958 · +117.4%
Race, ethnicity, and origin ACS 2023
- Neighborhood character
- Majority Black (55%)
- Race & ethnicity
- Black 55% Hispanic / Latino 43% Two or more races 17% Native American 1%
- Hispanic origin (detail)
- Mexican 35%
- Common ancestry
- Lithuanian 1%
- Foreign-born
- 18% · Canada
- Languages at home
- 61% English-only · Spanish 39%
Political lean MEDSL · Harris
- 2024 margin
- Lean D (+5.5) · D 52.0% · R 46.4% · Other 1.6%
- 2008→2024 swing
- +3.9pp toward D · 2008: 1.6pp · 2024: 5.5pp
- All cycles
- 2024: D+5.5 2020: D+13.3 2016: D+12.4 2012: D+0.1 2008: D+1.6
Not yet ingested
- Civics
- —
Market trends
- HPI YoY
- ▼ -41.49%
- Current HPI
- 212.6472
- Rent YoY
- ▲ 5.45%
- Metro
- Houston-The Woodlands-Sugar Land, TX
- State GDP YoY
- ▲ 3.95%
- F500 in state
- 110
Industry mix (Fortune 500 HQ in TX)
| Industry | F500 HQs | Revenue |
|---|---|---|
| Energy | 16 | $1,198B |
|
||
| Technology | 5 | $198B |
|
||
| Engineering / Construction | 4 | $72B |
|
||
| Energy Services | 3 | $60B |
|
||
| Utilities | 3 | $41B |
|
||
| Healthcare | 2 | $330B |
|
||
Price history
+427.2% since first listed13 events — show timeline
- 2026-04-11 Listed $165,000 HARMLS
- 2026-04-11 Listing Removed — HARMLS
- 2026-02-16 Listing Removed — HARMLS
- 2026-02-16 Listed $180,000 HARMLS
- 2025-12-05 Listing Removed — HARMLS
- 2025-12-05 Listed $195,000 HARMLS
- 2025-10-19 Listing Removed — HARMLS
- 2025-10-17 Listed $208,000 HARMLS
- 2025-09-15 Listed $215,000 HARMLS
- 2014-08-14 Sold (MLS) — HARMLS
- 2014-07-25 Pending — HARMLS
- 2014-07-14 Listed $31,300 HARMLS
- 1988-01-02 Sold (Public Records) — Public Records
Property tax history
+4.7%/yrLatest (2025): $1,859 · +11.7% YoY. Source: county tax records.
Cash-flow waterfall
monthlySold comps — $/sqft
last 12 mo · ≤1 miLoading sold comps…