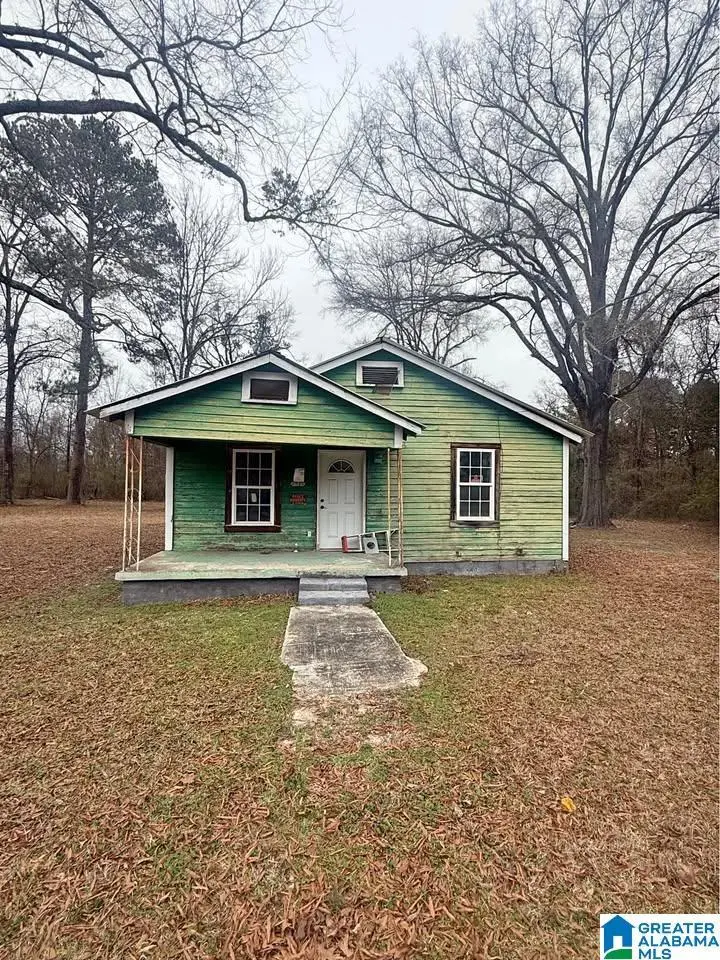
2919 Hickory St · Gadsden, AL
Flood risk 1/10 · Minimal
- FEMA flood zone
- X (unshaded)
- Chance of flooding over 30 yrs
- 0.0%
- Est. flood insurance / yr
- $507 – $1,088
Fire risk 3/10 · Minor
- Est. fire insurance / yr
- $916 – $1,700
Heat risk 6/10 · Moderate
- Hot days now (above 107°F)
- 7 days/yr
- Hot days in 30 yrs
- 19 days/yr
Wind risk 5/10 · Moderate
- Chance of severe wind over 30 yrs
- 25.0%
Air-quality risk 2/10 · Minimal
- Unhealthy air days now
- 1 days/yr
- Unhealthy air days in 30 yrs
- 2 days/yr
Risk factors via First Street. Map © Google.
Why this score? — see what drove the B- grade
The composite is a weighted blend of 9 inputs, each scored 0–100. Each bar is that input's sub-score; the figure is the points it added to the 100-point composite (weight × sub-score).
- Cash flow +30.0/30.0
- 1% rule +10.0/10.0
- DSCR +10.0/10.0
- ARV discount +7.5/15.0
- Livability +3.0/5.0
- Rent growth +2.5/5.0
- Condition / age +2.5/5.0
- Schools +2.2/10.0
- Appreciation +0.0/10.0
$45,000
🖨 Deal sheet (PDF) 📄 Offer letter ✓ Due diligence
Listing remarks
Calling all investors and savvy buyers—this 3-bedroom, 1-bathroom gem is bursting with potential and packed with key upgrades already done for you! With the heavy lifting out of the way, this home is the perfect canvas to bring your vision to life. Brand New Metal Roof, All New Electrical & Plumbing, New Sheetrock Throughout, New Windows & Doors, New Light Fixtures, New Shower Installed. All that's left is your finishing touch! Whether you're looking to flip, rent, or create your next income-producing property, this one is ready to shine. CASH OFFERS ONLY – Don’t miss your chance to scoop up this solid opportunity at a great price.
Key facts
- All new electrical
- New doors
- All new plumbing
Tags
Neighborhood map
What this means for you Summary
Snapshot
- This is a 3-bed/1.0-bath single-family listed at $45k.
Deal economics
- At list price, monthly cash flow is $322 ($4k/yr) — positive.
- The deal already cash-flows at list — no discount required.
- Meets the 1% rule at list price ($750 rent vs $45k).
- Recommended offer: $42k (6.0% below list) — sets the bar for market timing.
- Cap rate 14.9% vs local median 5.1% in Gadsden — top-decile yield for the area; either an underpriced asset or a hidden risk that comps aren't pricing in. Stress-test before assuming the spread holds.
Location & tenants
- Location reads 59/100 on livability (#335 in AL) — a working-class tenant base; expect higher turnover. Strengths: cost of living A+, housing A+; Watch: crime F, amenities F, commute F.
- Gadsden City (urban): math 15% / reading 39% proficiency, ranked #87 of 129 in AL (top 67%) — low school quality limits family demand, transient renter base, plan for 1-2y turnover; 66% free/reduced lunch — lower-income household profile, screen leases tightly.
- Zoned schools: Gadsden City High School (math 17% / reading 24%, grade F, #159 of 305 statewide, top 53%, 1,318 students, 76% FRL).
- Market conditions: 84 active listings in the ZIP; 1 comparable units currently listed for rent nearby; 119 units permitted in Etowah County in 2024 (0 in 5+ unit buildings).
Forward outlook
- Local home prices are declining (-3.0%/yr); year-one equity from $311 of loan paydown is wiped out by about $1k of value loss. Plan a longer hold.
- Etowah County population projected at -12% by 2050 — secular population decline; favor cash flow + early exit over multi-decade hold.
- At projected returns (-3.0% appreciation + 3.0% rent growth), your $13k cash investment doubles in ~4 years — after that, you're playing with house money.
Negotiation context
- It's been on market 63 days — a 6% lower offer ($42k) is reasonable based on typical stale-listing flexibility.
- 2 sale attempts; this cycle's ask has dropped $5k (10%) from the opening price — seller is motivated, your offer sets the floor, not the list.
Risks & watch-outs
- Watch-outs: built in 1935 — expect roof / HVAC / electrical / plumbing capex.
- Climate carrying-cost: moderate wind risk, 25% chance of damaging wind over 30y; extreme-heat days projected 7→19/yr by 2055 (HVAC capex compounding) — expect insurance premiums to compound above CPI over the hold.
Questions for the listing agent
- It's been on market 63 days. Have you received any prior offers? Is the seller open to a 6% concession, seller financing, or rate buy-down credit?
- Built in 1935 — when were the roof, HVAC, electrical panel, plumbing, and water heater last replaced?
- Why hasn't it sold? Are there any deal-killer items the seller is aware of (foundation, flood, title, zoning, code violations)?
- Is there a deadline driving the sale (1031 exchange, divorce, estate, relocation)? That informs how much negotiation room exists.
- Crime grade is F in this area — have there been break-ins, vandalism, or insurance claims at this property in the last 3 years? What carrier currently insures it and at what premium?
- What's the average days-on-market for RENTAL listings here right now (not sales)? A rising rental-DOM trend means longer vacancies and softer asking-rent achievability than the comps imply.
- What's the recent tenant-quality profile in this submarket — average credit score on applications, eviction rate, late-payment / NSF rate, and stable-employment percentage? A property-management company in the area should have these aggregated.
- How much new for-sale + rental construction is in the pipeline within 1–3 miles? Heavy new supply typically softens prices + rents 12–24 months out; constrained supply supports both.
Investment metrics
- 1% rule
- 1.67% ✓
- Cap rate
- 14.88%
- Cash-on-cash
- 30.65%
- DSCR
- 2.36
- GRM
- 5.0
CMA / ARV
- ARV (on-the-fly)
- $108,066
- Comps found
- 7
Show comp detail 7 sales within ~0.75 mi
| Address | Dist | Beds/Ba | Sqft | Sold | Price | $/sf | Match |
|---|---|---|---|---|---|---|---|
| 2918 Hickory St | 0.03mi | 3/1.0 | 1,410 (+8%) | 13mo | $96,000 | $68 | 74 |
| 2900 Patton St | 0.27mi | 2/1.0 (-1) | 1,283 (-2%) | 22mo | $44,000 | $34 | 62 |
| 3800 S 11th St | 0.33mi | 3/1.0 | 1,170 (-10%) | 10mo | $47,500 | $41 | 60 |
| 1109 Central Ave | 0.25mi | 3/1.0 | 1,432 (+10%) | 22mo | $140,000 | $98 | 54 |
| 1315 Colbert Ave | 0.41mi | 4/2.0 (+1) | 1,385 (+6%) | 12mo | $115,000 | $83 | 51 |
| 1613 Mount Zion Ave | 0.60mi | 3/2.0 | 1,351 (+4%) | 13mo | $134,900 | $100 | 51 |
| 500 Lincoln St | 0.55mi | 3/1.0 | 1,170 (-10%) | 22mo | $127,900 | $109 | 39 |
Match score weights: distance 35% · size 25% · config 20% · recency 20%. Top-matched comps best support the ARV.
Projected returns pro-forma
-3.0% appreciation · 3.0% rent growth · sell at horizon
- IRR
- 25.3%
- Equity multiple
- 2.05×
- Total profit
- $13,193
- Equity at exit
- $6,710
- IRR
- 33.1%
- Equity multiple
- 4.00×
- Total profit
- $37,828
- Equity at exit
- $3,891
Cash invested: $12,600 (down + closing). Projections, not guarantees.
Landlord ↔ Tenant lean methodology
- Overall (STATE)
- 90 Strongly Landlord-Friendly
- State Alabama
- 90 Strongly Landlord-Friendly · R+15
- County
- — inherits STATE
- City
- — inherits STATE
ZIP-level market 35904
- Home prices YoY
- -17.1%
- Active inventory
- 84
- Price-to-rent
- 5.0×
Monthly cashflow live
- Estimated rent
- $750 medium interval (Pro) →
- Mortgage (P&I)
- −$236
- Tax from tax record
- −$16 /mo · $191/yr
- Insurance
- −$19
- HOA
- −$0
- Vacancy / Maint / Mgmt
- −$158
- Net cashflow
- $322
Break-even live
Sensitivity live
| Price | -10% $347 | -5% $335 | +0% $322 | +5% $309 | +10% $296 |
|---|---|---|---|---|---|
| Rent | -10% $263 | -5% $292 | +0% $322 | +5% $351 | +10% $381 |
| Rate | -1.0pp $345 | -0.5pp $333 | base $322 | +0.5pp $310 | +1.0pp $298 |
UW: 25.0% down · 7.5% · 30yr · 1.5% tax · 5.0% vac · 8.0% maint · 8.0% mgmt
Financing live
Cash to close
- Down payment
- $11,250
- Closing costs
- $1,350
- Reserves months
- —
- Total cash needed
- —
Loan-product check · same deal, 3 products live
Conventional
25% down · 7.5% · 30yr
- Down + closing
- —
- Monthly P&I
- —
- Monthly cashflow
- —
- DSCR
- —
- Eligible?
- —
Personal DTI + credit; lowest rate.
DSCR
20% down · 8.5% · 30yr
- Down + closing
- —
- Monthly P&I
- —
- Monthly cashflow
- —
- DSCR
- —
- Eligible?
- —
No personal income docs; deal must DSCR.
Hard money
10% down · 12.0% · 12mo
- Down + closing
- —
- Monthly P&I
- —
- Monthly cashflow
- —
- DSCR
- —
- Eligible?
- —
Short-term bridge; refi at stabilization.
Rent comps 1 comps
| Address | Beds | Baths | Sqft | Rent | $/sqft | DOM | Units | Dist |
|---|---|---|---|---|---|---|---|---|
| 504 Pearl St Gadsden, AL | 2.0 | 1.0 | 903 | $750 | $0.83 | 44d | 1 | 0.49mi |
Listing history 5 events
-
2025-08-22status Pending
-
2025-07-24status Active
-
2025-07-21status Pending
-
2025-07-10price $45,000
-
2025-06-17$50,000 Active
ⓘ Source: listings_history table (triggers on properties + properties_extension) + one-shot
backfill from property_details.listing_events for pre-trigger history.
Tax reassessment forecast AL · Resets to sale price
- Current annual tax
- $191 · $16/mo
- Projected year-2 tax
- $191 · $16/mo
- Expected delta
- $0/yr ($0/mo · 0.0%)
ⓘ Screening estimate from a state-policy table — verify with the county assessor before closing.
Climate risk First Street
- Flood 1/10 Low FEMA zone X (unshaded) · 0% chance over 30 yrs
- Wildfire 3/10 Moderate
- Heat 6/10 Major 7 d/yr ≥107°F today · 19 d/yr by 30 yrs out
- Wind 5/10 Major 25% chance of damaging wind over 30 yrs
- Air quality 2/10 Low 1 unhealthy d/yr today · 2 by 30 yrs out
Nearby sold comps map
Loading sold comps map…
Walkable amenities ~0.75 mi
Loading nearby amenities…
Taxation est. · year 1
- Rental income
- $9,000
- − Mortgage interest
- −$2,521
- − Property taxes
- −$191
- − Insurance
- −$225
- − Repairs & maintenance
- −$720
- − Management
- −$720
- − Depreciation
- −$1,309
- Taxable income
- $3,314
- Est. tax owed @ 24.0%
- −$795
- After-tax cash flow
- $3,067/yr
For passive investors: Depreciation is non-cash, so a rental often shows a tax loss while cash-flowing — sheltering income. Rental losses are passive: they offset passive income freely, and up to $25,000/yr can offset ordinary (W-2) income if you actively participate and your MAGI is under $100k (phasing out to $0 by $150k); unused losses carry forward. On sale, claimed depreciation is recaptured at up to 25%, and gains may owe capital-gains tax (a 1031 exchange can defer both). Figures are a year-1 estimate at your 24.0% rate — not tax advice; consult a CPA.
Schools (NCES district)
- District
- Gadsden City
- NCES district ID
- 0101620
- Math proficiency
- 15% ▼ -27.00%
- Reading proficiency
- 39% ▼ -2.00%
- Median HH income
- $29,099
- Composite
- 21.62/100
- National rank
- #8292
- State rank
- #87 of 129 in AL
Livability — Gadsden
- Score
- 59/100
- State rank
- #335
- US rank
- #20131
Category grades
Schools grade is shown separately in the Schools card above.
Census & demographics
- Census place
- Gadsden, AL
- Population (ZIP)
- 13,571
Population outlook (Etowah County) Hauer SSP2
- Today (2025)
- 100,500 people
- By 2030
- 98,488 · -2.0%
- By 2040
- 93,731 · -6.7%
- By 2050
- 88,681 · -11.8%
- By 2075
- 76,746 · -23.6%
- By 2100
- 65,373 · -35.0%
Race, ethnicity, and origin ACS 2023
- Neighborhood character
- Predominantly White (77%)
- Race & ethnicity
- White 77% Black 13% Hispanic / Latino 8% Two or more races 2%
- Hispanic origin (detail)
- Mexican 5%
- Common ancestry
- Slovak 3% Serbian 1% Iranian 1%
- Foreign-born
- 3% · Canada
- Languages at home
- 93% English-only · Spanish 6%
Political lean MEDSL · Etowah
- 2024 margin
- Solid R (+55.7) · D 21.8% · R 77.5%
- 2008→2024 swing
- -17.5pp toward R · 2008: -38.2pp · 2024: -55.7pp
- All cycles
- 2024: R+55.7 2020: R+50.2 2016: R+50.1 2012: R+38.4 2008: R+38.2
Not yet ingested
- Civics
- —
Market trends
- HPI YoY
- ▼ -44.06%
- Current HPI
- 213.3981
- Rent YoY
- —
- Metro
- —
- State GDP YoY
- ▲ 2.94%
- F500 in state
- 4
Industry mix (Fortune 500 HQ in AL)
| Industry | F500 HQs | Revenue |
|---|---|---|
| Financial Services | 1 | $8B |
|
||
| Healthcare | 1 | $5B |
|
||
Price history
-10.0% since first listed5 events — show timeline
- 2025-08-22 Pending — Greater Alabama MLS
- 2025-07-24 Relisted — Greater Alabama MLS
- 2025-07-21 Pending — Greater Alabama MLS
- 2025-07-10 Price Changed $45,000 Greater Alabama MLS
- 2025-06-17 Listed $50,000 Greater Alabama MLS
Property tax history
+2.0%/yrLatest (2025): $191 · +0.0% YoY. Source: county tax records.
Cash-flow waterfall
monthlySold comps — $/sqft
last 12 mo · ≤1 miLoading sold comps…