 Duplex
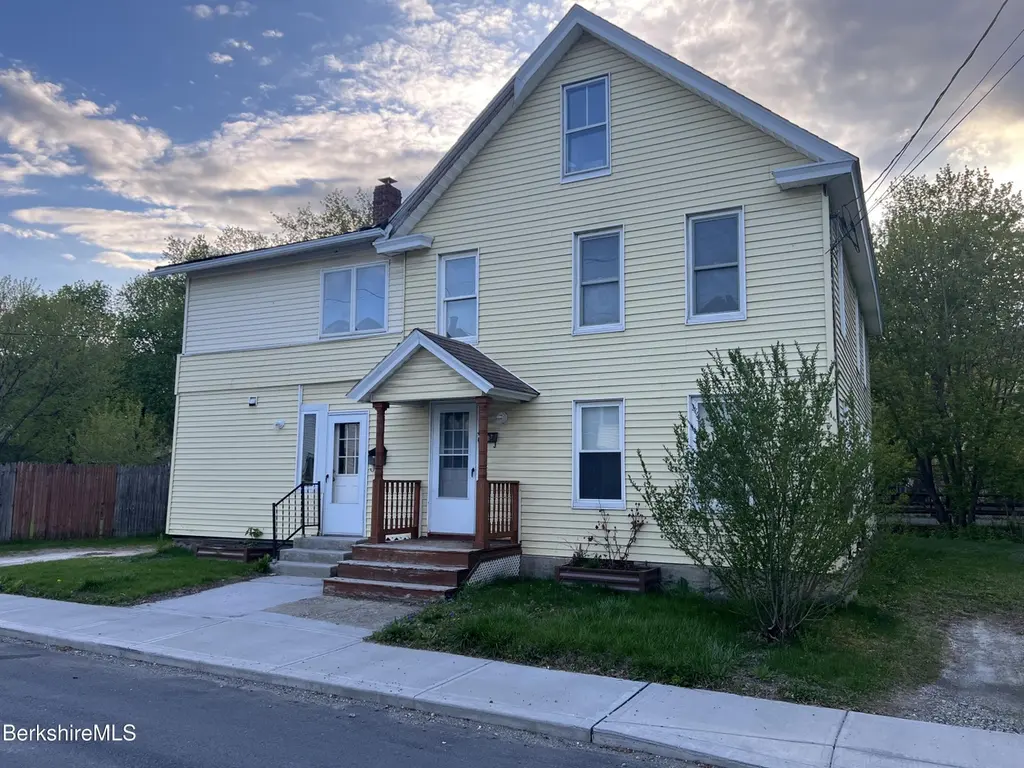
16 Albert St · Adams, MA
Flood risk 9/10 · Severe
- FEMA flood zone
- X
- Chance of flooding over 30 yrs
- 0.99%
- Est. flood insurance / yr
- $473 – $860
Fire risk 3/10 · Minor
- Est. fire insurance / yr
- $915 – $1,699
Heat risk 3/10 · Minor
- Hot days now (above 90°F)
- 8 days/yr
- Hot days in 30 yrs
- 19 days/yr
Wind risk 3/10 · Minor
- Chance of severe wind over 30 yrs
- 8.0%
Air-quality risk 2/10 · Minimal
- Unhealthy air days now
- 1 days/yr
- Unhealthy air days in 30 yrs
- 1 days/yr
Risk factors via First Street. Map © Google.
Why this score? — see what drove the B- grade
The composite is a weighted blend of 9 inputs, each scored 0–100. Each bar is that input's sub-score; the figure is the points it added to the 100-point composite (weight × sub-score).
- Cash flow +30.0/30.0
- 1% rule +10.0/10.0
- DSCR +10.0/10.0
- Appreciation +8.3/10.0
- Livability +3.6/5.0
- Rent growth +2.5/5.0
- Condition / age +2.5/5.0
- Schools +2.0/10.0
- ARV discount +0.4/15.0
$225,000
🖨 Deal sheet 📄 Offer letter ✓ Due diligence
Multi-family units
County records classify this as Multi-Family (2-4 Unit). Listing-text estimate: 2 units. confirmed
Listing remarks MLS
Nice Flat in Adams boarding bike trail.
Key facts
- Office space
- Direct access
- Large yard
Tags
Property features AI
Exterior
- Utilities: Public sewer
- Construction: Asphalt roof; Building area approximately 2260
Interior
- Bedrooms: Unit includes 2 bedrooms
- Flooring: Carpet; Linoleum
- Bathrooms: 2 full bathrooms
- Heating & cooling: Oil heating
- Interior features: Cable available; Accessible bedroom; Accessible full bath
- Laundry & utility: Washer; Dryer; Refrigerator
Neighborhood map
What this means for you Summary
Snapshot
- This is a 2 × 3-bed/1.0-bath units multifamily listed at $225k.
Deal economics
- At list price, monthly cash flow is $1k ($14k/yr) — positive. Per door: $578/mo.
- The deal already cash-flows at list — no discount required.
- Meets the 1% rule at list price ($3k rent vs $225k).
- Cap rate 12.8% vs local median 3.7% in Adams — top-decile yield for the area; either an underpriced asset or a hidden risk that comps aren't pricing in. Stress-test before assuming the spread holds.
Location & tenants
- Location reads 71/100 on livability (#131 in MA) — a middle-class / working-renter tenant base. Strengths: health & safety A+, housing A, cost of living A-; Watch: amenities F, commute F, employment D-.
- Adams-Cheshire (rural): math 14% / reading 31% proficiency, ranked #285 of 302 in MA (top 94%) — low school quality limits family demand, transient renter base, plan for 1-2y turnover.
- Zoned schools: Hoosac Valley Elementary School (math 27% / reading 42%, grade F, #577 of 938 statewide, top 65%, 374 students, 0% FRL); Hoosac Valley Middle School (math 8% / reading 28%, grade F, #264 of 305 statewide, top 87%, 288 students, 0% FRL); Hoosac Valley High School (math 22% / reading 37%, grade F, #270 of 343 statewide, top 80%, 324 students, 0% FRL) — zoned schools average 0% FRL vs 36% district-wide (36 pts lower); this property's tenant base skews higher-income than the district average.
- Market conditions: 62 active listings in the ZIP; 130 units permitted in Berkshire County in 2024 (10 in 5+ unit buildings).
Forward outlook
- In year one you build about $17k of equity ($2k loan paydown + $15k appreciation (6.7% local appreciation)).
- Berkshire County population projected at -24% by 2050 — secular population decline; favor cash flow + early exit over multi-decade hold.
- At projected returns (6.7% appreciation + 3.0% rent growth), your $63k cash investment doubles in ~3 years — after that, you're playing with house money.
- By year 3, paydown + projected appreciation supports a ~$41k cash-out refi (75% LTV) — recoverable capital for the next deal without selling this one.
Negotiation context
- Only 9 days on market — expect competitive offers; lowballing is unlikely to land.
- 2 sale attempts since 5y ago with the ask held roughly flat each time — persistent listings suggest the price (not the market) is what's stuck; bring a comps-based counter.
- Current owner paid $163k; 38% above their basis — modest negotiation headroom, anchor on the comps not their cost.
Risks & watch-outs
- Watch-outs: flood insurance adds $56/mo; built in 1900 — expect roof / HVAC / electrical / plumbing capex.
- Climate carrying-cost: severe flood risk — expect insurance premiums to compound above CPI over the hold.
Questions for the listing agent
- Can we see the unit-by-unit rent roll, current vacancy, and any below-market leases? What's the average tenancy length?
- What capital expenditures (roof, boiler, parking lot, exteriors) have been made in the last 5 years, and what's planned in the next 2?
- Built in 1900 — when were the roof, HVAC, electrical panel, plumbing, and water heater last replaced?
- What's the actual annual flood-insurance premium (NFIP or private), and is the property in a SFHA with mandatory coverage?
- Is there a deadline driving the sale (1031 exchange, divorce, estate, relocation)? That informs how much negotiation room exists.
- Schools are D-rated, which usually means shorter tenancies and higher turnover. Who's the typical renter profile here, and what's been the actual vacancy rate?
- What's the average days-on-market for RENTAL listings here right now (not sales)? A rising rental-DOM trend means longer vacancies and softer asking-rent achievability than the comps imply.
- What's the recent tenant-quality profile in this submarket — average credit score on applications, eviction rate, late-payment / NSF rate, and stable-employment percentage? A property-management company in the area should have these aggregated.
- How much new apartment / multifamily construction is in the pipeline within 1–3 miles? Heavy new supply (>2% of stock underway) typically softens rents 12–24 months out; light construction supports rent growth.
Investment metrics
- 1% rule
- 1.52% ✓
- Cap rate
- 12.75%
- Cash-on-cash
- 23.07%
- DSCR
- 2.03
- GRM
- 5.5
CMA / ARV
- ARV (on-the-fly)
- $194,360
- Comps found
- 3
Show comp detail 3 sales within ~0.75 mi
| Address | Dist | Beds/Ba | Sqft | Sold | Price | $/sf | Match |
|---|---|---|---|---|---|---|---|
| 98-100 Columbia St | 0.06mi | 5/2.0 (-1) | 2,444 (+8%) | 6mo | $149,000 | $61 | 73 |
| 3 Hayer St | 0.33mi | 5/2.0 (-1) | 2,064 (-9%) | 10mo | $325,000 | $157 | 57 |
| 5-7 Richmond | 0.66mi | 6/2.0 | 2,564 (+14%) | 6mo | $220,000 | $86 | 42 |
Match score weights: distance 35% · size 25% · config 20% · recency 20%. Top-matched comps best support the ARV.
Projected returns pro-forma
6.66% appreciation · 3.0% rent growth · sell at horizon
- IRR
- 35.1%
- Equity multiple
- 3.34×
- Total profit
- $147,566
- Equity at exit
- $150,983
- IRR
- 32.1%
- Equity multiple
- 6.94×
- Total profit
- $374,523
- Equity at exit
- $282,439
Cash invested: $63,000 (down + closing). Projections, not guarantees.
Landlord ↔ Tenant lean methodology
- Overall (STATE)
- 20 Strongly Tenant-Friendly
- State Massachusetts
- 20 Strongly Tenant-Friendly · D+15
- County
- — inherits STATE
- City
- — inherits STATE
ZIP-level market 01220
- Home prices YoY
- 2.3%
- Active inventory
- 62
- Price-to-rent
- 11.0×
Monthly cashflow live
- Estimated rent
- $3,417 medium interval (Pro) →
- Mortgage (P&I)
- −$1,180
- Tax from tax record
- −$215 /mo · $2,577/yr
- Insurance
- −$94
- Flood insurance flood zone
- −$56 /mo · $666/yr
- HOA
- −$0
- Vacancy / Maint / Mgmt
- −$718
- Net cashflow
- $1,155
Break-even live
2-unit breakdown (identical units grouped — click to expand)
| Units | Beds | Baths | Est. rent |
|---|---|---|---|
| 2× units | 3 | 1 | $3,416 |
| #1 | 3 | 1 | $1,708 |
| #2 | 3 | 1 | $1,708 |
| Total (2 units) | $3,417 | ||
UW: 25.0% down · 7.5% · 30yr · 1.5% tax · 5.0% vac · 8.0% maint · 8.0% mgmt
Financing live
Cash to close
- Down payment
- $56,250
- Closing costs
- $6,750
- Reserves months
- —
- Total cash needed
- —
Loan-product check · same deal, 3 products live
Conventional
25% down · 7.5% · 30yr
- Down + closing
- —
- Monthly P&I
- —
- Monthly cashflow
- —
- DSCR
- —
- Eligible?
- —
Personal DTI + credit; lowest rate.
DSCR
20% down · 8.5% · 30yr
- Down + closing
- —
- Monthly P&I
- —
- Monthly cashflow
- —
- DSCR
- —
- Eligible?
- —
No personal income docs; deal must DSCR.
Hard money
10% down · 12.0% · 12mo
- Down + closing
- —
- Monthly P&I
- —
- Monthly cashflow
- —
- DSCR
- —
- Eligible?
- —
Short-term bridge; refi at stabilization.
Listing history 5 events
-
2026-05-11status Pending
-
2026-05-02$225,000 Active
-
2022-03-21soldstatus $163,300 Closed 39-char remark
Show marketing remark (39 chars)
Nice Flat in Adams boarding bike trail.
-
2021-12-10historical 39-char remark
Show marketing remark (39 chars)
Nice Flat in Adams boarding bike trail.
-
2021-12-07$172,000 39-char remark
Show marketing remark (39 chars)
Nice Flat in Adams boarding bike trail.
ⓘ Source: listings_history table (triggers on properties + properties_extension) + one-shot
backfill from property_details.listing_events for pre-trigger history.
Tax reassessment forecast MA · Partial reset (capped growth)
- Current annual tax
- $2,577 · $215/mo
- Projected year-2 tax
- $2,672 · $223/mo
- Expected delta
- +$95/yr (+$8/mo · 3.7%)
ⓘ Screening estimate from a state-policy table — verify with the county assessor before closing.
Climate risk First Street
- Flood 9/10 Extreme FEMA zone X · 99% chance over 30 yrs
- Wildfire 3/10 Moderate
- Heat 3/10 Moderate 8 d/yr ≥90°F today · 19 d/yr by 30 yrs out
- Wind 3/10 Moderate 8% chance of damaging wind over 30 yrs
- Air quality 2/10 Low 1 unhealthy d/yr today · 1 by 30 yrs out
Nearby sold comps map
Loading sold comps map…
Walkable amenities ~0.75 mi
Loading nearby amenities…
Taxation est. · year 1
- Rental income
- $41,004
- − Mortgage interest
- −$12,603
- − Property taxes
- −$2,577
- − Insurance
- −$1,792
- − Repairs & maintenance
- −$3,280
- − Management
- −$3,280
- − Depreciation
- −$6,545
- Taxable income
- $10,926
- Est. tax owed @ 24.0%
- −$2,622
- After-tax cash flow
- $11,243/yr
For passive investors: Depreciation is non-cash, so a rental often shows a tax loss while cash-flowing — sheltering income. Rental losses are passive: they offset passive income freely, and up to $25,000/yr can offset ordinary (W-2) income if you actively participate and your MAGI is under $100k (phasing out to $0 by $150k); unused losses carry forward. On sale, claimed depreciation is recaptured at up to 25%, and gains may owe capital-gains tax (a 1031 exchange can defer both). Figures are a year-1 estimate at your 24.0% rate — not tax advice; consult a CPA.
Schools (NCES district)
- District
- Adams-Cheshire
- NCES district ID
- 2501780
- Math proficiency
- 14% ▼ -13.00%
- Reading proficiency
- 31% ▼ -4.00%
- Median HH income
- $45,956
- Composite
- 19.53/100
- National rank
- #8765
- State rank
- #285 of 302 in MA
Livability — Adams
- Score
- 71/100
- State rank
- #131
- US rank
- #7262
Category grades
Schools grade is shown separately in the Schools card above.
Census & demographics
- Census place
- Adams, MA
- City population
- 8,106
- Population (ZIP)
- 8,106
Population outlook (Berkshire County) Hauer SSP2
- Today (2025)
- 119,723 people
- By 2030
- 114,608 · -4.3%
- By 2040
- 102,806 · -14.1%
- By 2050
- 91,305 · -23.7%
- By 2075
- 71,517 · -40.3%
- By 2100
- 57,988 · -51.6%
Race, ethnicity, and origin ACS 2023
- Neighborhood character
- Predominantly White (94%)
- Race & ethnicity
- White 94% Two or more races 3% Hispanic / Latino 2%
- Common ancestry
- Romanian 18% Lithuanian 16% Slovak 1%
- Foreign-born
- 2% · Vietnam
- Languages at home
- 96% English-only · Spanish 2% Russian/Polish/Slavic 2% Vietnamese 1%
Political lean MEDSL · Berkshire
- 2024 margin
- Solid D (+39.9) · D 68.9% · R 29.0% · Other 2.1%
- 2008→2024 swing
- -12.5pp toward R · 2008: 52.4pp · 2024: 39.9pp
- All cycles
- 2024: D+39.9 2020: D+47.1 2016: D+41.5 2012: D+53.7 2008: D+52.4
Not yet ingested
- Civics
- —
Market trends
- HPI YoY
- ▲ 6.66%
- Current HPI
- 295.6616
- Rent YoY
- —
- Metro
- —
- State GDP YoY
- ▲ 2.28%
- F500 in state
- 38
Industry mix (Fortune 500 HQ in MA)
| Industry | F500 HQs | Revenue |
|---|---|---|
| Technology | 3 | $17B |
|
||
| Insurance | 2 | $84B |
|
||
| Retail | 2 | $76B |
|
||
| Life Sciences | 1 | $43B |
|
||
| Energy Technology | 1 | $31B |
|
||
| Aerospace / Defense | 1 | $18B |
|
||
Price history
+30.8% since first listed5 events — show timeline
- 2026-05-11 Pending — BCMLS
- 2026-05-02 Listed $225,000 BCMLS
- 2022-03-21 Sold (MLS) $163,300 BCMLS
- 2021-12-10 Listing Removed — BCMLS
- 2021-12-07 Listed $172,000 BCMLS
Property tax history
+1.7%/yrLatest (2023): $2,577 · +2.2% YoY. Source: county tax records.
Cash-flow waterfall
monthlySold comps — $/sqft
last 12 mo · ≤1 miLoading sold comps…