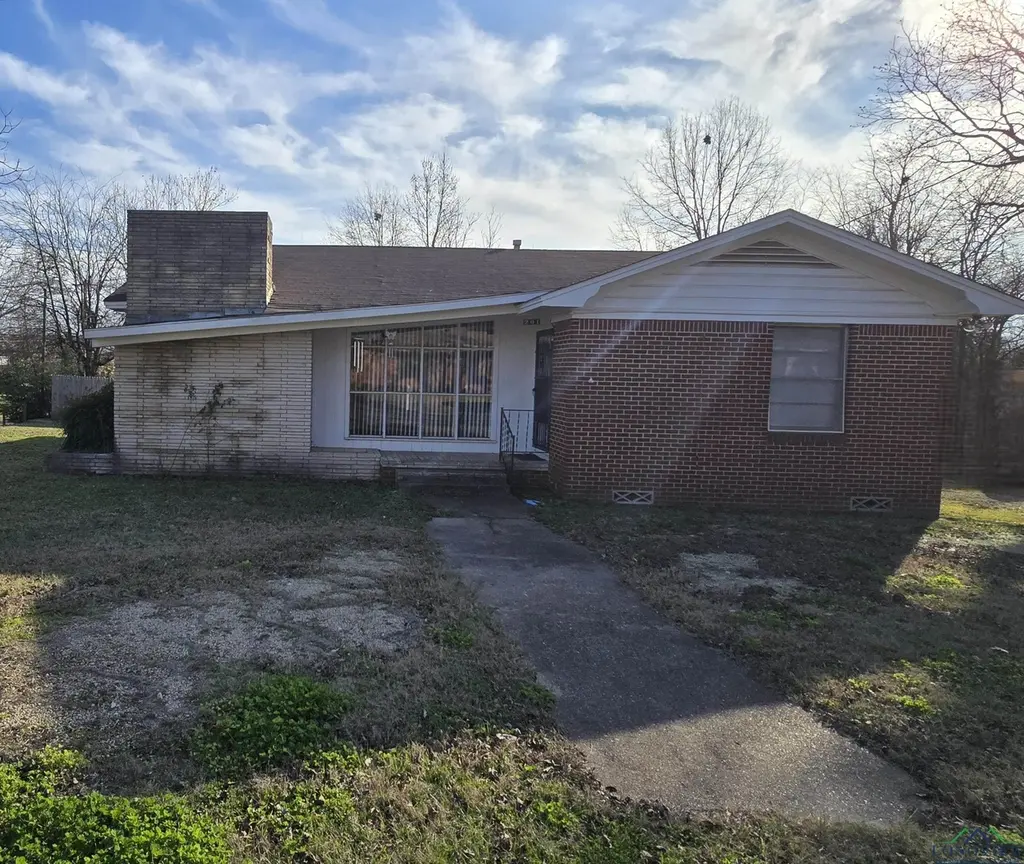
201 Frazior St · Linden, TX
Flood risk No data
- FEMA flood zone
- —
- Chance of flooding over 30 yrs
- —
- Est. flood insurance / yr
- —
Fire risk No data
- Est. fire insurance / yr
- —
Heat risk No data
- Hot days now (above threshold)
- —
- Hot days in 30 yrs
- —
Wind risk No data
- Chance of severe wind over 30 yrs
- —
Air-quality risk No data
- Unhealthy air days now
- —
- Unhealthy air days in 30 yrs
- —
Risk factors via First Street. Map © Google.
Why this score? — see what drove the A- grade
The composite is a weighted blend of 9 inputs, each scored 0–100. Each bar is that input's sub-score; the figure is the points it added to the 100-point composite (weight × sub-score).
- Cash flow +30.0/30.0
- ARV discount +15.0/15.0
- DSCR +10.0/10.0
- 1% rule +8.5/10.0
- Appreciation +6.4/10.0
- Schools +3.3/10.0
- Livability +3.0/5.0
- Rent growth +2.5/5.0
- Condition / age +2.2/5.0
$80,000
🖨 Deal sheet 📄 Offer letter ✓ Due diligence
Listing remarks MLS
This inviting home offers 2 bedrooms and 2 full bathrooms, plus a versatile bonus room that could easily serve as a third bedroom, home office, or flex space. With a functional layout and solid bones, this property is ready for a little TLC to truly shine. Ideal for buyers looking to personalize their space or investors seeking value-add potential. Enjoy the opportunity to update finishes, add your own style, and build equity. Conveniently located and full of possibilities—don’t miss the chance to make this home your own. Sold as-is
Key facts
- 0.24 acre lot
- Garage
- Built 1945
Neighborhood map
What this means for you Summary
Snapshot
- This is a 2-bed/2.0-bath single-family listed at $80k. Condition is rated fair.
Deal economics
- At list price, monthly cash flow is $301 ($4k/yr) — positive.
- The deal already cash-flows at list — no discount required.
- Meets the 1% rule at list price ($1k rent vs $80k).
- Recommended offer: $70k (12.0% below list) — sets the bar for market timing.
Location & tenants
- Location reads 59/100 on livability (#1,176 in TX) — a working-class tenant base; expect higher turnover. Strengths: cost of living A+, housing A+; Watch: crime D, schools F, amenities F.
- Linden-Kildare CISD (rural): math 37% / reading 42% proficiency, ranked #450 of 826 in TX (top 54%) — families likely to look elsewhere, expect single-tenant / working-renter base with shorter leases.
- Market conditions: 84 active listings in the ZIP; 12 units permitted in Cass County in 2024 (0 in 5+ unit buildings).
Forward outlook
- In year one you build about $3k of equity ($553 loan paydown + $2k appreciation (2.8% local appreciation)).
- Cass County population projected to shrink 9% by 2050 — rents likely to lag national; underwrite the cash flow, not the appreciation.
- At projected returns (2.8% appreciation + 3.0% rent growth), your $22k cash investment doubles in ~4 years — after that, you're playing with house money.
Negotiation context
- It's been on market 155 days — a 12% lower offer ($70k) is reasonable based on typical stale-listing flexibility.
- 2 sale attempts since 4y ago; this cycle's ask has dropped $29k (27%) from the opening price — seller is motivated, your offer sets the floor, not the list.
Risks & watch-outs
- Watch-outs: built in 1945 — expect roof / HVAC / electrical / plumbing capex.
Questions for the listing agent
- It's been on market 155 days. Have you received any prior offers? Is the seller open to a 12% concession, seller financing, or rate buy-down credit?
- Have any recent inspections been done? Can we get a copy of the seller's disclosures and any deferred-maintenance estimates?
- Built in 1945 — when were the roof, HVAC, electrical panel, plumbing, and water heater last replaced?
- Why hasn't it sold? Are there any deal-killer items the seller is aware of (foundation, flood, title, zoning, code violations)?
- Is there a deadline driving the sale (1031 exchange, divorce, estate, relocation)? That informs how much negotiation room exists.
- Schools are F-rated, which usually means shorter tenancies and higher turnover. Who's the typical renter profile here, and what's been the actual vacancy rate?
- Crime grade is D in this area — have there been break-ins, vandalism, or insurance claims at this property in the last 3 years? What carrier currently insures it and at what premium?
- What's the average days-on-market for RENTAL listings here right now (not sales)? A rising rental-DOM trend means longer vacancies and softer asking-rent achievability than the comps imply.
- What's the recent tenant-quality profile in this submarket — average credit score on applications, eviction rate, late-payment / NSF rate, and stable-employment percentage? A property-management company in the area should have these aggregated.
- How much new for-sale + rental construction is in the pipeline within 1–3 miles? Heavy new supply typically softens prices + rents 12–24 months out; constrained supply supports both.
Investment metrics
- 1% rule
- 1.35% ✓
- Cap rate
- 10.81%
- Cash-on-cash
- 16.13%
- DSCR
- 1.72
- GRM
- 6.2
CMA / ARV
- ARV (median comp)
- $143,296
- List price
- $80,000
- Delta
- -44.17%
- Verdict
- UNDERPRICED
- Comps
- 2 within 1.0 mi
Show comp detail 1 sale within ~0.75 mi
| Address | Dist | Beds/Ba | Sqft | Sold | Price | $/sf | Match |
|---|---|---|---|---|---|---|---|
| 607 W Campbell Rd | 0.31mi | 3/2.0 (+1) | 1,460 (-2%) | 3mo | $149,000 | $102 | 74 |
Match score weights: distance 35% · size 25% · config 20% · recency 20%. Top-matched comps best support the ARV.
Projected returns pro-forma
2.77% appreciation · 3.0% rent growth · sell at horizon
- IRR
- 22.1%
- Equity multiple
- 2.24×
- Total profit
- $27,843
- Equity at exit
- $34,925
- IRR
- 23.3%
- Equity multiple
- 4.28×
- Total profit
- $73,516
- Equity at exit
- $53,024
Cash invested: $22,400 (down + closing). Projections, not guarantees.
Landlord ↔ Tenant lean methodology
- Overall (STATE)
- 87 Strongly Landlord-Friendly
- State Texas
- 87 Strongly Landlord-Friendly · R+5
- County
- — inherits STATE
- City
- — inherits STATE
ZIP-level market 75563
- Home prices YoY
- 2.0%
- Active inventory
- 84
- Price-to-rent
- 6.2×
Monthly cashflow live
- Estimated rent
- $1,081 medium interval (Pro) →
- Mortgage (P&I)
- −$420
- Tax est. 1.5%
- −$100 /mo · $1,200/yr
- Insurance
- −$33
- HOA
- −$0
- Vacancy / Maint / Mgmt
- −$227
- Net cashflow
- $301
Break-even live
UW: 25.0% down · 7.5% · 30yr · 1.5% tax · 5.0% vac · 8.0% maint · 8.0% mgmt
Financing live
Cash to close
- Down payment
- $20,000
- Closing costs
- $2,400
- Reserves months
- —
- Total cash needed
- —
Loan-product check · same deal, 3 products live
Conventional
25% down · 7.5% · 30yr
- Down + closing
- —
- Monthly P&I
- —
- Monthly cashflow
- —
- DSCR
- —
- Eligible?
- —
Personal DTI + credit; lowest rate.
DSCR
20% down · 8.5% · 30yr
- Down + closing
- —
- Monthly P&I
- —
- Monthly cashflow
- —
- DSCR
- —
- Eligible?
- —
No personal income docs; deal must DSCR.
Hard money
10% down · 12.0% · 12mo
- Down + closing
- —
- Monthly P&I
- —
- Monthly cashflow
- —
- DSCR
- —
- Eligible?
- —
Short-term bridge; refi at stabilization.
Listing history 19 events
-
2026-06-18days on market $80,000 Active 155 DOM
-
2026-06-17days on market $80,000 Active 154 DOM
-
2026-06-16days on market $80,000 Active 153 DOM
-
2026-06-15days on market $80,000 Active 152 DOM
-
2026-06-13days on market $80,000 Active 150 DOM
-
2026-06-12days on market $80,000 Active 149 DOM
-
2026-06-10days on market $80,000 Active 146 DOM
-
2026-06-08days on market $80,000 Active 145 DOM
-
2026-06-08days on market $80,000 Active 144 DOM
-
2026-06-05days on market $80,000 Active 142 DOM
-
2026-06-04price $80,000 Active 140 DOM
-
2026-06-03days on market $99,999 Active 140 DOM
-
2026-06-02days on market $99,999 Active 139 DOM
-
2026-06-01days on market $99,999 Active 138 DOM
-
2026-05-31days on market $99,999 Active 137 DOM
-
2026-03-05price $99,999 550-char remark
Show marketing remark (550 chars)
This inviting home offers 2 bedrooms and 2 full bathrooms, plus a versatile bonus room that could easily serve as a third bedroom, home office, or flex space. With a functional layout and solid bones, this property is ready for a little TLC to truly shine. Ideal for buyers looking to personalize their space or investors seeking value-add potential. Enjoy the opportunity to update finishes, add your own style, and build equity. Conveniently located and full of possibilities—don’t miss the chance to make this home your own. Sold as-is
-
2026-01-14$109,000 Active 550-char remark
Show marketing remark (550 chars)
This inviting home offers 2 bedrooms and 2 full bathrooms, plus a versatile bonus room that could easily serve as a third bedroom, home office, or flex space. With a functional layout and solid bones, this property is ready for a little TLC to truly shine. Ideal for buyers looking to personalize their space or investors seeking value-add potential. Enjoy the opportunity to update finishes, add your own style, and build equity. Conveniently located and full of possibilities—don’t miss the chance to make this home your own. Sold as-is
-
2022-09-26soldstatus 187-char remark
Show marketing remark (187 chars)
This 2 bedroom, 2 bath property sits on a spacious lot right in the heart of Linden, TX. It features two living areas. This home is minutes from shopping and restaurants near Cass County.
-
2022-08-19$150,000 187-char remark
Show marketing remark (187 chars)
This 2 bedroom, 2 bath property sits on a spacious lot right in the heart of Linden, TX. It features two living areas. This home is minutes from shopping and restaurants near Cass County.
ⓘ Source: listings_history table (triggers on properties + properties_extension) + one-shot
backfill from property_details.listing_events for pre-trigger history.
Nearby sold comps map
Loading sold comps map…
Walkable amenities ~0.75 mi
Loading nearby amenities…
Taxation est. · year 1
- Rental income
- $12,971
- − Mortgage interest
- −$4,481
- − Property taxes
- −$1,200
- − Insurance
- −$400
- − Repairs & maintenance
- −$1,038
- − Management
- −$1,038
- − Depreciation
- −$2,327
- Taxable income
- $2,487
- Est. tax owed @ 24.0%
- −$597
- After-tax cash flow
- $3,016/yr
For passive investors: Depreciation is non-cash, so a rental often shows a tax loss while cash-flowing — sheltering income. Rental losses are passive: they offset passive income freely, and up to $25,000/yr can offset ordinary (W-2) income if you actively participate and your MAGI is under $100k (phasing out to $0 by $150k); unused losses carry forward. On sale, claimed depreciation is recaptured at up to 25%, and gains may owe capital-gains tax (a 1031 exchange can defer both). Figures are a year-1 estimate at your 24.0% rate — not tax advice; consult a CPA.
Condition & rehab AI · 12 photos
This home requires moderate renovations to improve its curb appeal and interior condition, with a focus on landscaping, exterior paint, and kitchen updates.
Repairs flagged
- Major Landscaping — Overgrown lawn and debris need significant attention.
- Minor Exterior paint — Paint appears worn in some areas, but not severe enough to require immediate attention.
- Moderate Kitchen cabinets — Dated design and potential wear and tear on the cabinets.
Value-add opportunities
- Both Landscaping and exterior paint — Improving curb appeal and overall appearance.
- Both Kitchen cabinets and appliances — Updating the kitchen will enhance both resale and rental value.
- Both Bathroom fixtures and tile — Updating the bathrooms will improve both resale and rental value.
- Both HVAC and plumbing systems — Ensuring these systems are in good working order will improve both resale and rental value.
Renovation cost estimate screening
| Repair item | Severity | Est. cost |
|---|---|---|
| Landscaping · Overgrown lawn and debris need significant attention. | Major | $15,000–50,000 |
| Exterior paint · Paint appears worn in some areas, but not severe enough to require immediate attention. | Minor | $500–3,000 |
| Kitchen cabinets · Dated design and potential wear and tear on the cabinets. | Moderate | $3,000–15,000 |
| Total estimated repair cost · 3 items | $18,500–68,000 |
Value-add ROI direction
- Both Landscaping and exterior paint — Improving curb appeal and overall appearance. ↑
- Both Kitchen cabinets and appliances — Updating the kitchen will enhance both resale and rental value. ↑
- Both Bathroom fixtures and tile — Updating the bathrooms will improve both resale and rental value. ↑
- Both HVAC and plumbing systems — Ensuring these systems are in good working order will improve both resale and rental value. ↑
ⓘ Cost ranges are severity-bucket heuristics (US national rule-of-thumb). Get contractor quotes + a written scope before underwriting a rehab budget.
Schools (NCES district)
- District
- Linden-Kildare CISD
- NCES district ID
- 4827540
- Math proficiency
- 37% ▲ 11.00%
- Reading proficiency
- 42% ▲ 3.00%
- Median HH income
- $35,293
- Composite
- 32.66/100
- National rank
- #5659
- State rank
- #450 of 826 in TX
Livability — Linden
- Score
- 59/100
- State rank
- #1176
- US rank
- #20579
Category grades
Schools grade is shown separately in the Schools card above.
Census & demographics
- Census place
- Linden, TX
- Population (ZIP)
- 3,967
Population outlook (Cass County) Hauer SSP2
- Today (2025)
- 29,998 people
- By 2030
- 29,583 · -1.4%
- By 2040
- 28,512 · -5.0%
- By 2050
- 27,230 · -9.2%
- By 2075
- 24,917 · -16.9%
- By 2100
- 21,582 · -28.1%
Race, ethnicity, and origin ACS 2023
- Neighborhood character
- Predominantly White (76%)
- Race & ethnicity
- White 76% Black 16% Hispanic / Latino 5% Two or more races 3% Native American 2%
- Common ancestry
- Italian 1% Lithuanian 1% Iranian 1%
- Foreign-born
- 3% · Canada
- Languages at home
- 96% English-only · Spanish 3% Other Indo-European 1%
Political lean MEDSL · Cass
- 2024 margin
- Solid R (+65.7) · D 17.0% · R 82.7%
- 2008→2024 swing
- -25.2pp toward R · 2008: -40.4pp · 2024: -65.7pp
- All cycles
- 2024: R+65.7 2020: R+59.1 2016: R+59.7 2012: R+49.5 2008: R+40.4
Not yet ingested
- Civics
- —
Market trends
- HPI YoY
- ▲ 2.77%
- Current HPI
- 142.6814
- Rent YoY
- —
- Metro
- —
- State GDP YoY
- ▲ 3.95%
- F500 in state
- 110
Industry mix (Fortune 500 HQ in TX)
| Industry | F500 HQs | Revenue |
|---|---|---|
| Energy | 16 | $1,198B |
|
||
| Technology | 5 | $198B |
|
||
| Engineering / Construction | 4 | $72B |
|
||
| Energy Services | 3 | $60B |
|
||
| Utilities | 3 | $41B |
|
||
| Healthcare | 2 | $330B |
|
||
Price history
-33.3% since first listed4 events — show timeline
- 2026-03-05 Price Changed $99,999 LAAR
- 2026-01-14 Listed $109,000 LAAR
- 2022-09-26 Sold (MLS) — LAAR
- 2022-08-19 Listed $150,000 LAAR
Cash-flow waterfall
monthlySold comps — $/sqft
last 12 mo · ≤1 miLoading sold comps…