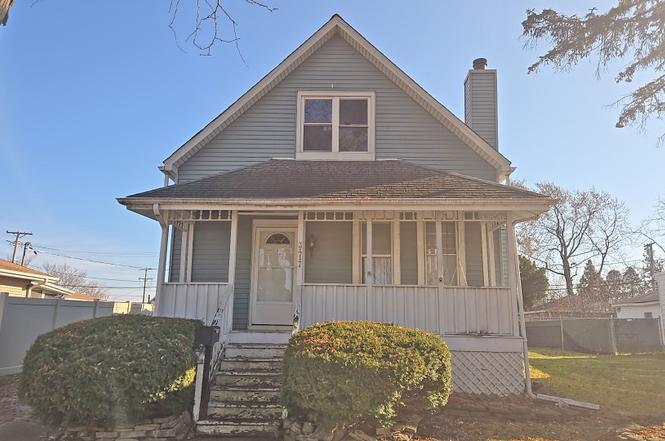
3417 Butler Ave · Steger, IL
Flood risk 1/10 · Minimal
- FEMA flood zone
- X (unshaded)
- Chance of flooding over 30 yrs
- 0.0%
- Est. flood insurance / yr
- $507 – $1,088
Fire risk 1/10 · Minimal
- Est. fire insurance / yr
- $804 – $1,492
Heat risk 3/10 · Minor
- Hot days now (above 101°F)
- 7 days/yr
- Hot days in 30 yrs
- 16 days/yr
Wind risk 2/10 · Minimal
- Chance of severe wind over 30 yrs
- —
Air-quality risk 2/10 · Minimal
- Unhealthy air days now
- 2 days/yr
- Unhealthy air days in 30 yrs
- 2 days/yr
Risk factors via First Street. Map © Google.
Why this score? — see what drove the B- grade
The composite is a weighted blend of 9 inputs, each scored 0–100. Each bar is that input's sub-score; the figure is the points it added to the 100-point composite (weight × sub-score).
- Cash flow +30.0/30.0
- 1% rule +10.0/10.0
- DSCR +10.0/10.0
- ARV discount +7.5/15.0
- Livability +3.4/5.0
- Rent growth +2.5/5.0
- Condition / age +2.5/5.0
- Schools +0.7/10.0
- Appreciation +0.0/10.0
$84,900
🖨 Deal sheet (PDF) 📄 Offer letter ✓ Due diligence
Listing remarks
Exciting opportunity! This frame 1.5 story offers 2 bedrooms, 1.5 baths and a basement that can be finished for extra living space. This property is waiting for the right owner to unlock its full potential and turn it into a stunning home. Conveniently located near shopping, restaurants and transportation, this home is ideal for a first-time buyer ready to transform it into a fabulous living space or an investor looking to add to their rental portfolio.
Key facts
- Built 1909
- Listed 186 days
Property features AI
Finance
- HOA & community: No master association fees (not required)
Exterior
- Utilities: Public water; Public sewer
- Home design: Detached single-family home; 1.5-story design; Fee simple ownership; Home is over 100 years old; Built before 1978
- Construction: Frame construction
- Exterior features: Lot under 0.25 acre
Interior
- Kitchen: Main-level kitchen (approx. 15 x 9)
- Bedrooms: Primary bedroom on second level (approx. 18 x 14); Second bedroom on main level (approx. 11 x 9); Two additional bedrooms listed
- Bathrooms: One full bathroom; One half bathroom
- Heating & cooling: Natural gas forced-air heating
- Interior features: Five total rooms; Unfinished full basement
- Laundry & utility: Dedicated laundry room
Neighborhood map
What this means for you Summary
Snapshot
- This is a 2-bed/1.5-bath other listed at $85k.
Deal economics
- At list price, monthly cash flow is $563 ($7k/yr) — positive.
- The deal already cash-flows at list — no discount required.
- Meets the 1% rule at list price ($2k rent vs $85k).
- Recommended offer: $75k (12.0% below list) — sets the bar for market timing.
- Cap rate 14.2% vs local median 5.1% in Steger — top-decile yield for the area; either an underpriced asset or a hidden risk that comps aren't pricing in. Stress-test before assuming the spread holds.
Location & tenants
- Location reads 67/100 on livability (#498 in IL) — a middle-class / working-renter tenant base. Strengths: commute A+, cost of living A+, housing A+; Watch: employment C-, health & safety D+, amenities F.
- Bloom Twp Hsd 206 (suburban): math 8% / reading 9% proficiency, ranked #591 of 620 in IL (top 95%) — low school quality limits family demand, transient renter base, plan for 1-2y turnover.
- Zoned schools: Bloom Trail High School (math 12% / reading 12%, grade F, #511 of 693 statewide, top 75%, 1,227 students, 0% FRL).
- Market conditions: 43 active listings in the ZIP; 5 comparable units currently listed for rent nearby; rentals at typical pace (median 26d on market — plan ~3-4 weeks tenant-placement turnaround); 2,028 units permitted in Will County in 2024 (530 in 5+ unit buildings).
Forward outlook
- Local home prices are declining (-3.0%/yr); year-one equity from $587 of loan paydown is wiped out by about $3k of value loss. Plan a longer hold.
- Will County population projected to shrink 4% by 2050 — rents likely to lag national; underwrite the cash flow, not the appreciation.
- At projected returns (-3.0% appreciation + 3.0% rent growth), your $24k cash investment doubles in ~5 years — after that, you're playing with house money.
Negotiation context
- It's been on market 186 days — a 12% lower offer ($75k) is reasonable based on typical stale-listing flexibility.
- 3 sale attempts since 19y ago; this cycle's ask has dropped $15k (15%) from the opening price — seller is motivated, your offer sets the floor, not the list.
Risks & watch-outs
- Watch-outs: property tax is 3.3% of price; built in 1909 — expect roof / HVAC / electrical / plumbing capex.
Questions for the listing agent
- It's been on market 186 days. Have you received any prior offers? Is the seller open to a 12% concession, seller financing, or rate buy-down credit?
- Built in 1909 — when were the roof, HVAC, electrical panel, plumbing, and water heater last replaced?
- Property tax is high relative to price — has the assessment been appealed recently, and will the sale trigger a re-assessment?
- Why hasn't it sold? Are there any deal-killer items the seller is aware of (foundation, flood, title, zoning, code violations)?
- Is there a deadline driving the sale (1031 exchange, divorce, estate, relocation)? That informs how much negotiation room exists.
- Schools are F-rated, which usually means shorter tenancies and higher turnover. Who's the typical renter profile here, and what's been the actual vacancy rate?
- What's the average days-on-market for RENTAL listings here right now (not sales)? A rising rental-DOM trend means longer vacancies and softer asking-rent achievability than the comps imply.
- What's the recent tenant-quality profile in this submarket — average credit score on applications, eviction rate, late-payment / NSF rate, and stable-employment percentage? A property-management company in the area should have these aggregated.
- How much new for-sale + rental construction is in the pipeline within 1–3 miles? Heavy new supply typically softens prices + rents 12–24 months out; constrained supply supports both.
Investment metrics
- 1% rule
- 1.91% ✓
- Cap rate
- 14.24%
- Cash-on-cash
- 28.40%
- DSCR
- 2.26
- GRM
- 4.4
CMA / ARV
No comps found within radius.
Projected returns pro-forma
-3.0% appreciation · 3.0% rent growth · sell at horizon
- IRR
- 22.7%
- Equity multiple
- 1.93×
- Total profit
- $22,174
- Equity at exit
- $12,659
- IRR
- 30.7%
- Equity multiple
- 3.77×
- Total profit
- $65,866
- Equity at exit
- $7,341
Cash invested: $23,772 (down + closing). Projections, not guarantees.
Landlord ↔ Tenant lean methodology
- Overall (STATE)
- 43 Moderately Tenant-Leaning
- State Illinois
- 43 Moderately Tenant-Leaning · D+7
- County
- — inherits STATE
- City
- — inherits STATE
ZIP-level market 60475
- Active inventory
- 43
- Price-to-rent
- 4.4×
Monthly cashflow live
- Estimated rent
- $1,620 high interval (Pro) →
- Mortgage (P&I)
- −$445
- Tax from tax record
- −$237 /mo · $2,838/yr
- Insurance
- −$35
- HOA
- −$0
- Vacancy / Maint / Mgmt
- −$340
- Net cashflow
- $563
Break-even live
Sensitivity live
| Price | -10% $611 | -5% $587 | +0% $563 | +5% $538 | +10% $514 |
|---|---|---|---|---|---|
| Rent | -10% $435 | -5% $499 | +0% $563 | +5% $626 | +10% $690 |
| Rate | -1.0pp $605 | -0.5pp $584 | base $563 | +0.5pp $541 | +1.0pp $518 |
UW: 25.0% down · 7.5% · 30yr · 1.5% tax · 5.0% vac · 8.0% maint · 8.0% mgmt
Financing live
Cash to close
- Down payment
- $21,225
- Closing costs
- $2,547
- Reserves months
- —
- Total cash needed
- —
Loan-product check · same deal, 3 products live
Conventional
25% down · 7.5% · 30yr
- Down + closing
- —
- Monthly P&I
- —
- Monthly cashflow
- —
- DSCR
- —
- Eligible?
- —
Personal DTI + credit; lowest rate.
DSCR
20% down · 8.5% · 30yr
- Down + closing
- —
- Monthly P&I
- —
- Monthly cashflow
- —
- DSCR
- —
- Eligible?
- —
No personal income docs; deal must DSCR.
Hard money
10% down · 12.0% · 12mo
- Down + closing
- —
- Monthly P&I
- —
- Monthly cashflow
- —
- DSCR
- —
- Eligible?
- —
Short-term bridge; refi at stabilization.
Rent comps 5 comps
| Address | Beds | Baths | Sqft | Rent | $/sqft | DOM | Units | Dist |
|---|---|---|---|---|---|---|---|---|
| 22 E 35th St Steger, IL | 2.0 | 1.0 | 740 | $1,250 | $1.69 | 25d | 1 | 0.33mi |
| 3135 Chicago Rd Unit 2nd Steger, IL | 2.0 | 1.0 | 1300 | $1,650 | $1.27 | 25d | 1 | 0.55mi |
| 3763 Emerald Ave Steger, IL | 3.0 | 1.0 | 1125 | $1,950 | $1.73 | 25d | 1 | 0.70mi |
| 316 W 34th St Steger, IL | 3.0 | 1.0–1.5 | 720 | $1,493 | $2.07 | 0d | 5 | 1.18mi |
| 236 Chestnut Ave Unit S South Chicago Heights, IL | 3.0 | 1.0 | 1032 | $2,000 | $1.94 | 25d | 1 | 1.25mi |
Listing history 16 events
-
2026-06-10status $84,900 Pending 186 DOM
-
2026-06-09days on market $84,900 Active 186 DOM
-
2026-06-08days on market $84,900 Active 185 DOM
-
2026-06-07days on market $84,900 Active 184 DOM
-
2026-06-04days on market $84,900 Active 181 DOM
-
2026-06-03days on market $84,900 Active 180 DOM
-
2026-06-02days on market $84,900 Active 179 DOM
-
2026-06-01days on market $84,900 Active 178 DOM
-
2026-05-31days on market $84,900 Active 177 DOM
-
2026-02-16price $84,900
-
2026-01-12price $89,900
-
2025-12-05$99,900 Active
-
2008-07-09historical
-
2008-04-20
-
2007-10-18historical
-
2007-04-18
ⓘ Source: listings_history table (triggers on properties + properties_extension) + one-shot
backfill from property_details.listing_events for pre-trigger history.
Tax reassessment forecast IL · Partial reset (capped growth)
- Current annual tax
- $2,838 · $237/mo
- Projected year-2 tax
- $2,838 · $237/mo
- Expected delta
- $0/yr ($0/mo · 0.0%)
ⓘ Screening estimate from a state-policy table — verify with the county assessor before closing.
Climate risk First Street
- Flood 1/10 Low FEMA zone X (unshaded) · 0% chance over 30 yrs
- Wildfire 1/10 Low
- Heat 3/10 Moderate 7 d/yr ≥101°F today · 16 d/yr by 30 yrs out
- Wind 2/10 Low
- Air quality 2/10 Low 2 unhealthy d/yr today · 2 by 30 yrs out
Nearby sold comps map
Loading sold comps map…
Walkable amenities ~0.75 mi
Loading nearby amenities…
Taxation est. · year 1
- Rental income
- $19,438
- − Mortgage interest
- −$4,756
- − Property taxes
- −$2,838
- − Insurance
- −$424
- − Repairs & maintenance
- −$1,555
- − Management
- −$1,555
- − Depreciation
- −$2,470
- Taxable income
- $5,839
- Est. tax owed @ 24.0%
- −$1,401
- After-tax cash flow
- $5,349/yr
For passive investors: Depreciation is non-cash, so a rental often shows a tax loss while cash-flowing — sheltering income. Rental losses are passive: they offset passive income freely, and up to $25,000/yr can offset ordinary (W-2) income if you actively participate and your MAGI is under $100k (phasing out to $0 by $150k); unused losses carry forward. On sale, claimed depreciation is recaptured at up to 25%, and gains may owe capital-gains tax (a 1031 exchange can defer both). Figures are a year-1 estimate at your 24.0% rate — not tax advice; consult a CPA.
Schools (NCES district)
- District
- Bloom Twp Hsd 206
- NCES district ID
- 1706420
- Math proficiency
- 8% ▼ -3.00%
- Reading proficiency
- 9% ▼ -8.00%
- Median HH income
- $39,795
- Composite
- 7.4/100
- National rank
- #9952
- State rank
- #591 of 620 in IL
Livability — Steger
- Score
- 67/100
- State rank
- #498
- US rank
- #10279
Category grades
Schools grade is shown separately in the Schools card above.
Census & demographics
- Census place
- Steger, IL
- City population
- 10,103
- Population (ZIP)
- 10,103
Population outlook (Will County) Hauer SSP2
- Today (2025)
- 705,368 people
- By 2030
- 708,154 · +0.4%
- By 2040
- 702,692 · -0.4%
- By 2050
- 680,249 · -3.6%
- By 2075
- 611,990 · -13.2%
- By 2100
- 516,215 · -26.8%
Race, ethnicity, and origin ACS 2023
- Neighborhood character
- Diverse neighborhood (Simpson 0.65)
- Race & ethnicity
- White 52% Hispanic / Latino 23% Black 18% Two or more races 11% Asian 1%
- Hispanic origin (detail)
- Mexican 21%
- Common ancestry
- Romanian 5% Lithuanian 1% Italian 1%
- Foreign-born
- 7% · Canada, South Korea
- Languages at home
- 85% English-only · Spanish 13% Other Indo-European 1%
Political lean MEDSL · Will
- 2024 margin
- Toss-up / Even · D 50.1% · R 48.5% · Other 1.4%
- 2008→2024 swing
- -11.6pp toward R · 2008: 13.2pp · 2024: 1.6pp
- All cycles
- 2024: D+1.6 2020: D+8.3 2016: D+5.7 2012: D+3.7 2008: D+13.2
Not yet ingested
- Civics
- —
Market trends
- HPI YoY
- ▼ -92.95%
- Current HPI
- 134.0677
- Rent YoY
- —
- Metro
- —
- State GDP YoY
- ▲ 1.59%
- F500 in state
- 60
Industry mix (Fortune 500 HQ in IL)
| Industry | F500 HQs | Revenue |
|---|---|---|
| Insurance | 4 | $201B |
|
||
| Consumer Goods | 4 | $87B |
|
||
| Industrial Machinery | 3 | $64B |
|
||
| Healthcare | 2 | $55B |
|
||
| Retail / Pharmacy | 1 | $148B |
|
||
| Agriculture / Food | 1 | $86B |
|
||
Price history
-15.0% since first listed7 events — show timeline
- 2026-02-16 Price Changed $84,900 MRED as Distributed by MLS Grid
- 2026-01-12 Price Changed $89,900 MRED as Distributed by MLS Grid
- 2025-12-05 Listed $99,900 MRED as Distributed by MLS Grid
- 2008-07-09 Listing Removed — MRED as Distributed by MLS Grid
- 2008-04-20 Listed — MRED as Distributed by MLS Grid
- 2007-10-18 Listing Removed — MRED as Distributed by MLS Grid
- 2007-04-18 Listed — MRED as Distributed by MLS Grid
Property tax history
+4.8%/yrLatest (2024): $2,838 · +9.4% YoY. Source: county tax records.
Cash-flow waterfall
monthlySold comps — $/sqft
last 12 mo · ≤1 miLoading sold comps…