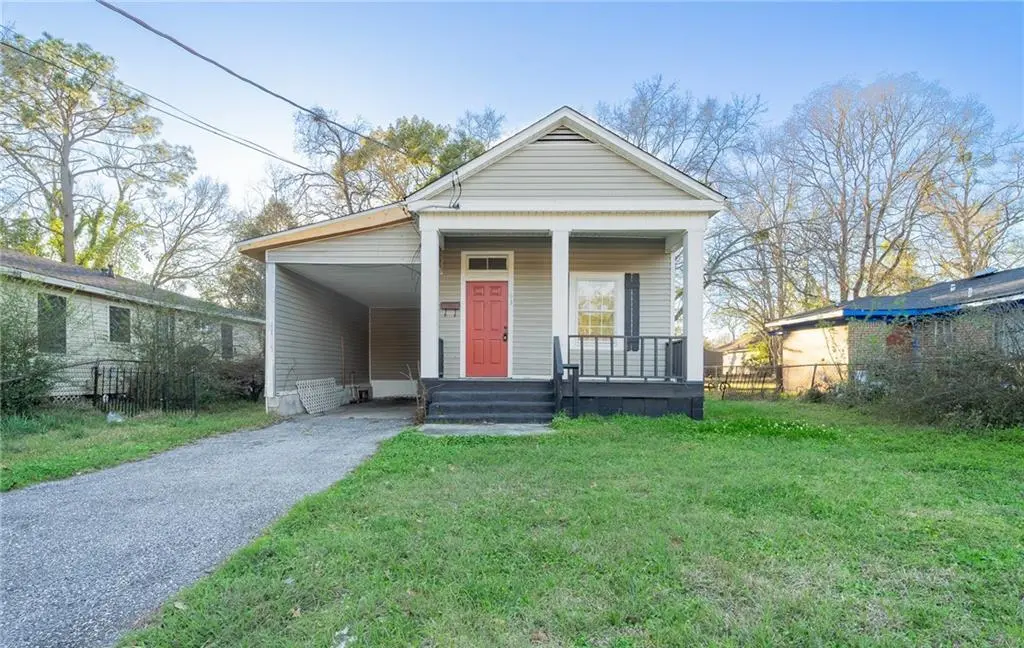
63 Macks St · Mobile, AL
Flood risk 1/10 · Minimal
- FEMA flood zone
- X (unshaded)
- Chance of flooding over 30 yrs
- 0.0%
- Est. flood insurance / yr
- $507 – $1,088
Fire risk 3/10 · Minor
- Est. fire insurance / yr
- $916 – $1,700
Heat risk 9/10 · Severe
- Hot days now (above 104°F)
- 7 days/yr
- Hot days in 30 yrs
- 21 days/yr
Wind risk 9/10 · Severe
- Chance of severe wind over 30 yrs
- 99.0%
Air-quality risk 2/10 · Minimal
- Unhealthy air days now
- 1 days/yr
- Unhealthy air days in 30 yrs
- 1 days/yr
Risk factors via First Street. Map © Google.
Why this score? — see what drove the C+ grade
The composite is a weighted blend of 9 inputs, each scored 0–100. Each bar is that input's sub-score; the figure is the points it added to the 100-point composite (weight × sub-score).
- Cash flow +30.0/30.0
- DSCR +10.0/10.0
- 1% rule +7.8/10.0
- Livability +3.8/5.0
- ARV discount +3.2/15.0
- Rent growth +2.5/5.0
- Condition / age +2.5/5.0
- Schools +2.3/10.0
- Appreciation +0.0/10.0
$85,000
🖨 Deal sheet 📄 Offer letter ✓ Due diligence
Listing remarks
This charming, updated cottage is filled with natural light and features soaring ceilings that create an open, airy feel throughout. Enjoy relaxing evenings on the inviting front porch, or unwind in the fenced backyard for added privacy and comfort. Conveniently located, this home offers the perfect blend of style and everyday livability. Schedule your showing today!
Key facts
- Front porch
- Natural light
- Soaring ceilings
Tags
Property features AI
Exterior
- Parking: 2-space carport
- Utilities: Cable available; Electricity available (110 volts); Natural gas available; Public sewer
- Home design: Single-family residence; Residential property
- Construction: Vinyl siding; Insulated windows; Brick/mortar foundation; Shingle roof
- Exterior features: Back yard fencing; View
Interior
- Kitchen: Dishwasher; Electric oven; Microwave
- Bedrooms: 2 bedrooms
- Flooring: Ceramic tile; Laminate
- Bathrooms: 1 full bathroom
- Heating & cooling: Central heating; Central air conditioning
- Interior features: 10-foot high ceilings on main level
- Laundry & utility: Gas water heater
Neighborhood map
What this means for you Summary
Snapshot
- This is a 2-bed/1.0-bath single-family listed at $85k.
Deal economics
- At list price, monthly cash flow is $340 ($4k/yr) — positive.
- The deal already cash-flows at list — no discount required.
- Meets the 1% rule at list price ($1k rent vs $85k).
- Recommended offer: $82k (3.0% below list) — sets the bar for market timing.
- Cap rate 11.1% vs local median 4.9% in Mobile — top-decile yield for the area; either an underpriced asset or a hidden risk that comps aren't pricing in. Stress-test before assuming the spread holds.
Location & tenants
- Location reads 75/100 on livability (#20 in AL, #4,262 nationally) — a middle-class / working-renter tenant base. Strengths: commute A+, cost of living A+, housing A+; Watch: schools D-, crime F, employment D-.
- Mobile County (urban): math 15% / reading 39% proficiency, ranked #81 of 129 in AL (top 63%) — low school quality limits family demand, transient renter base, plan for 1-2y turnover; 67% free/reduced lunch — lower-income household profile, screen leases tightly.
- Market conditions: 45 active listings in the ZIP; 23 comparable units currently listed for rent nearby; rentals at typical pace (median 21d on market — plan ~3-4 weeks tenant-placement turnaround); 1,678 units permitted in Mobile County in 2024 (264 in 5+ unit buildings).
Forward outlook
- Local home prices are declining (-3.0%/yr); year-one equity from $588 of loan paydown is wiped out by about $3k of value loss. Plan a longer hold.
- Mobile County population projected to shrink 8% by 2050 — rents likely to lag national; underwrite the cash flow, not the appreciation.
- At projected returns (-3.0% appreciation + 3.0% rent growth), your $24k cash investment doubles in ~8 years — after that, you're playing with house money.
Negotiation context
- It's been on market 51 days — a 3% lower offer ($82k) is reasonable based on typical stale-listing flexibility.
- 4 sale attempts; this cycle's ask is 8895% above the opening price — seller raised mid-cycle; expect resistance to lowballs.
Risks & watch-outs
- Climate carrying-cost: severe wind risk, 99% chance of damaging wind over 30y; extreme-heat days projected 7→21/yr by 2055 (HVAC capex compounding) — expect insurance premiums to compound above CPI over the hold.
Questions for the listing agent
- It's been on market 51 days. Have you received any prior offers? Is the seller open to a 3% concession, seller financing, or rate buy-down credit?
- Is there a deadline driving the sale (1031 exchange, divorce, estate, relocation)? That informs how much negotiation room exists.
- Schools are D-rated, which usually means shorter tenancies and higher turnover. Who's the typical renter profile here, and what's been the actual vacancy rate?
- Crime grade is F in this area — have there been break-ins, vandalism, or insurance claims at this property in the last 3 years? What carrier currently insures it and at what premium?
- What's the average days-on-market for RENTAL listings here right now (not sales)? A rising rental-DOM trend means longer vacancies and softer asking-rent achievability than the comps imply.
- What's the recent tenant-quality profile in this submarket — average credit score on applications, eviction rate, late-payment / NSF rate, and stable-employment percentage? A property-management company in the area should have these aggregated.
- How much new for-sale + rental construction is in the pipeline within 1–3 miles? Heavy new supply typically softens prices + rents 12–24 months out; constrained supply supports both.
Investment metrics
- 1% rule
- 1.28% ✓
- Cap rate
- 11.09%
- Cash-on-cash
- 17.14%
- DSCR
- 1.76
- GRM
- 6.5
CMA / ARV
- ARV (median comp)
- $77,527
- List price
- $85,000
- Delta
- 9.64%
- Verdict
- FAIR
- Comps
- 20 within 1.0 mi
Show comp detail 10 sales within ~0.75 mi
| Address | Dist | Beds/Ba | Sqft | Sold | Price | $/sf | Match |
|---|---|---|---|---|---|---|---|
| 3019 Calais St | 0.61mi | 2/1.0 | 936 (+5%) | 7mo | $163,500 | $175 | 58 |
| 162 Union Ave | 0.34mi | 3/1.0 (+1) | 800 (-10%) | 9mo | $13,000 | $16 | 55 |
| 203 Sage Ave N | 0.44mi | 3/1.0 (+1) | 940 (+5%) | 14mo | $35,000 | $37 | 54 |
| 173 Sage Ave N | 0.42mi | 3/1.0 (+1) | 918 (+3%) | 20mo | $35,000 | $38 | 54 |
| 3013 ORLEANS St | 0.65mi | 2/1.0 | 844 (-6%) | 10mo | $125,000 | $148 | 52 |
| 2850 Pages Ln | 0.62mi | 3/1.0 (+1) | 949 (+6%) | 5mo | $18,000 | $19 | 51 |
| 137 Item Ave | 0.71mi | 2/1.0 | 1,020 (+14%) | 5mo | $89,000 | $87 | 40 |
| 56 Alexander St | 0.71mi | 2/1.0 | 808 (-10%) | 18mo | $61,000 | $75 | 35 |
| 2857 Nall St | 0.74mi | 3/1.0 (+1) | 854 (-4%) | 24mo | $28,000 | $33 | 33 |
| 102 Blacksher Ct | 0.61mi | 3/1.0 (+1) | 1,000 (+12%) | 23mo | $149,900 | $150 | 27 |
Match score weights: distance 35% · size 25% · config 20% · recency 20%. Top-matched comps best support the ARV.
Projected returns pro-forma
-3.0% appreciation · 3.0% rent growth · sell at horizon
- IRR
- 8.4%
- Equity multiple
- 1.33×
- Total profit
- $7,847
- Equity at exit
- $12,674
- IRR
- 17.6%
- Equity multiple
- 2.45×
- Total profit
- $34,598
- Equity at exit
- $7,349
Cash invested: $23,800 (down + closing). Projections, not guarantees.
Landlord ↔ Tenant lean methodology
- Overall (STATE)
- 90 Strongly Landlord-Friendly
- State Alabama
- 90 Strongly Landlord-Friendly · R+15
- County
- — inherits STATE
- City
- — inherits STATE
ZIP-level market 36607
- Active inventory
- 45
- Price-to-rent
- 6.5×
Monthly cashflow live
- Estimated rent
- $1,085 high interval (Pro) →
- Mortgage (P&I)
- −$446
- Tax from tax record
- −$36 /mo · $432/yr
- Insurance
- −$35
- HOA
- −$0
- Vacancy / Maint / Mgmt
- −$228
- Net cashflow
- $340
Break-even live
UW: 25.0% down · 7.5% · 30yr · 1.5% tax · 5.0% vac · 8.0% maint · 8.0% mgmt
Financing live
Cash to close
- Down payment
- $21,250
- Closing costs
- $2,550
- Reserves months
- —
- Total cash needed
- —
Loan-product check · same deal, 3 products live
Conventional
25% down · 7.5% · 30yr
- Down + closing
- —
- Monthly P&I
- —
- Monthly cashflow
- —
- DSCR
- —
- Eligible?
- —
Personal DTI + credit; lowest rate.
DSCR
20% down · 8.5% · 30yr
- Down + closing
- —
- Monthly P&I
- —
- Monthly cashflow
- —
- DSCR
- —
- Eligible?
- —
No personal income docs; deal must DSCR.
Hard money
10% down · 12.0% · 12mo
- Down + closing
- —
- Monthly P&I
- —
- Monthly cashflow
- —
- DSCR
- —
- Eligible?
- —
Short-term bridge; refi at stabilization.
Rent comps 23 comps
| Address | Beds | Baths | Sqft | Rent | $/sqft | DOM | Units | Dist |
|---|---|---|---|---|---|---|---|---|
| 55 Macks St Mobile, AL | 2.0 | 1.0 | 848 | $945 | $1.11 | 21d | 1 | 0.01mi |
| 156 Hemley Ave Mobile, AL | 3.0 | 1.0 | 936 | $1,195 | $1.28 | 43d | 1 | 0.33mi |
| 113 Randolph St Unit 1 Mobile, AL | 1.0 | 1.0 | 800 | $958 | $1.20 | 21d | 1 | 0.47mi |
| 2604 Dauphin St Mobile, AL | 2.0 | 1.0 | 950 | $1,072 | $1.13 | 43d | 2 | 0.70mi |
| 2604 Dauphin St #210 Mobile, AL | 2.0 | 1.0 | 950 | $1,150 | $1.21 | 21d | 1 | 0.70mi |
| 2850 Edgewood St Mobile, AL | 2.0 | 1.0 | 816 | $1,000 | $1.23 | 21d | 1 | 0.73mi |
| 120 Paris Ave Mobile, AL | 2.0 | 1.0 | 1054 | $1,150 | $1.09 | 21d | 1 | 0.79mi |
| 3252 Orleans St Mobile, AL | 2.0 | 1.0 | 900 | $850 | $0.94 | 43d | 1 | 0.79mi |
| 168 W Collins St Mobile, AL | 3.0 | 1.0 | 968 | $725 | $0.75 | 21d | 1 | 0.83mi |
| 151 Du Rhu Dr Mobile, AL | 1.0–3.0 | 1.0–2.0 | 1052 | $2,270 | $2.16 | 13d | 12 | 0.84mi |
| 2853 Josephine St Mobile, AL | 2.0 | 1.0 | 780 | $975 | $1.25 | 21d | 1 | 0.85mi |
| 2859 Brierwood Dr Mobile, AL | 3.0 | 1.0 | 1057 | $1,500 | $1.42 | 13d | 1 | 1.03mi |
| 276 S Sage Ave Mobile, AL | 1.0–2.0 | 1.0 | 850 | $1,055 | $1.24 | 43d | 1 | 1.09mi |
| 2500 Taylor Ave Mobile, AL | 2.0 | 1.0 | 840 | $1,195 | $1.42 | 43d | 1 | 1.17mi |
| 2656 Pathway Pl Mobile, AL | 2.0–3.0 | 1.0 | 778 | $949 | $1.22 | 13d | 9 | 1.19mi |
| 2503 Richard Ave Mobile, AL | 2.0 | 1.0 | 928 | $805 | $0.87 | 13d | 1 | 1.21mi |
| 104 Ellinor St Mobile, AL | 2.0 | 1.0 | 896 | $1,275 | $1.42 | 21d | 1 | 1.26mi |
| 2161 Homewood St Unit B Mobile, AL | 1.0 | 1.0 | 600 | $1,295 | $2.16 | 21d | 1 | 1.35mi |
| 708 Bond St Mobile, AL | 3.0 | 1.0 | 1100 | $1,350 | $1.23 | 21d | 1 | 1.36mi |
| 442 Cottage Hill Rd Unit 13 Mobile, AL | 1.0 | 1.0 | 637 | $860 | $1.35 | 43d | 1 | 1.48mi |
| 146 Yester Oaks Dr Mobile, AL | 1.0–3.0 | 1.0–2.5 | 1203 | $1,280 | $1.06 | 13d | 12 | 1.49mi |
| 186 Stanton Rd Mobile, AL | 1.0–3.0 | 1.0–2.5 | 1263 | $2,062 | $1.63 | 43d | 1 | 1.49mi |
| 2966 Northwest Dr Mobile, AL | 3.0 | 1.0 | 792 | $895 | $1.13 | 21d | 1 | 1.50mi |
Listing history 26 events
-
2026-06-18days on market $85,000 Active 51 DOM
-
2026-06-17days on market $85,000 Active 50 DOM
-
2026-06-16days on market $85,000 Active 49 DOM
-
2026-06-15days on market $85,000 Active 48 DOM
-
2026-06-14days on market $85,000 Active 46 DOM
-
2026-06-13days on market $85,000 Active 45 DOM
-
2026-06-10days on market $85,000 Active 43 DOM
-
2026-06-09days on market $85,000 Active 42 DOM
-
2026-06-08days on market $85,000 Active 41 DOM
-
2026-06-07days on market $85,000 Active 40 DOM
-
2026-06-05days on market $85,000 Active 37 DOM
-
2026-06-03days on market $85,000 Active 36 DOM
-
2026-06-02days on market $85,000 Active 35 DOM
-
2026-06-01days on market $85,000 Active 34 DOM
-
2026-05-31days on market $85,000 Active 33 DOM
-
2026-05-30days on market $85,000 Active 32 DOM
-
2026-05-16$945
-
2026-05-16historical $945
-
2026-05-13$945
-
2026-04-28$85,000 Active 369-char remark
-
2025-09-28historical $945
-
2025-09-06$945
-
2025-06-18price $75,000
-
2025-04-28price $89,500
-
2025-04-03price $94,999
-
2022-11-16price $94,000
ⓘ Source: listings_history table (triggers on properties + properties_extension) + one-shot
backfill from property_details.listing_events for pre-trigger history.
Tax reassessment forecast AL · Resets to sale price
- Current annual tax
- $432 · $36/mo
- Projected year-2 tax
- $432 · $36/mo
- Expected delta
- $0/yr ($0/mo · 0.0%)
ⓘ Screening estimate from a state-policy table — verify with the county assessor before closing.
Climate risk First Street
- Flood 1/10 Low FEMA zone X (unshaded) · 0% chance over 30 yrs
- Wildfire 3/10 Moderate
- Heat 9/10 Extreme 7 d/yr ≥104°F today · 21 d/yr by 30 yrs out
- Wind 9/10 Extreme 99% chance of damaging wind over 30 yrs
- Air quality 2/10 Low 1 unhealthy d/yr today · 1 by 30 yrs out
Nearby sold comps map
Loading sold comps map…
Walkable amenities ~0.75 mi
Loading nearby amenities…
Taxation est. · year 1
- Rental income
- $13,018
- − Mortgage interest
- −$4,761
- − Property taxes
- −$432
- − Insurance
- −$425
- − Repairs & maintenance
- −$1,041
- − Management
- −$1,041
- − Depreciation
- −$2,473
- Taxable income
- $2,844
- Est. tax owed @ 24.0%
- −$683
- After-tax cash flow
- $3,396/yr
For passive investors: Depreciation is non-cash, so a rental often shows a tax loss while cash-flowing — sheltering income. Rental losses are passive: they offset passive income freely, and up to $25,000/yr can offset ordinary (W-2) income if you actively participate and your MAGI is under $100k (phasing out to $0 by $150k); unused losses carry forward. On sale, claimed depreciation is recaptured at up to 25%, and gains may owe capital-gains tax (a 1031 exchange can defer both). Figures are a year-1 estimate at your 24.0% rate — not tax advice; consult a CPA.
Schools (NCES district)
- District
- Mobile County
- NCES district ID
- 0102370
- Math proficiency
- 15% ▼ -28.00%
- Reading proficiency
- 39% ▬ 0.00%
- Median HH income
- $42,455
- Composite
- 22.9/100
- National rank
- #8002
- State rank
- #81 of 129 in AL
Livability — Mobile
- Score
- 75/100
- State rank
- #20
- US rank
- #4262
Category grades
Schools grade is shown separately in the Schools card above.
Census & demographics
- Census place
- Mobile, AL
- City population
- 205,729
- Population (ZIP)
- 5,529
Population outlook (Mobile County) Hauer SSP2
- Today (2025)
- 415,303 people
- By 2030
- 411,755 · -0.9%
- By 2040
- 399,670 · -3.8%
- By 2050
- 382,616 · -7.9%
- By 2075
- 337,353 · -18.8%
- By 2100
- 283,391 · -31.8%
Race, ethnicity, and origin ACS 2023
- Neighborhood character
- Majority Black (56%)
- Race & ethnicity
- Black 56% White 40% Two or more races 3%
- Common ancestry
- Slovak 4% Lithuanian 2% Scotch-Irish 1%
- Foreign-born
- 1%
Political lean MEDSL · Mobile
- 2024 margin
- R (+16.4) · D 41.3% · R 57.7%
- 2008→2024 swing
- -7.7pp toward R · 2008: -8.7pp · 2024: -16.4pp
- All cycles
- 2024: R+16.4 2020: R+11.9 2016: R+13.9 2012: R+9.3 2008: R+8.7
Not yet ingested
- Civics
- —
Market trends
- HPI YoY
- ▼ -155.04%
- Current HPI
- 127.0483
- Rent YoY
- —
- Metro
- —
- State GDP YoY
- ▲ 2.94%
- F500 in state
- 4
Industry mix (Fortune 500 HQ in AL)
| Industry | F500 HQs | Revenue |
|---|---|---|
| Financial Services | 1 | $8B |
|
||
| Healthcare | 1 | $5B |
|
||
Price history
-9.6% since first listed11 events — show timeline
- 2026-06-09 Rental Removed $945 GCMLSAL
- 2026-05-16 Listed for Rent $945 GCMLSAL
- 2026-05-16 Rental Removed $945 BUILDIUM
- 2026-05-13 Listed for Rent $945 BUILDIUM
- 2026-04-28 Listed $85,000 GCMLS AL
- 2025-09-28 Rental Removed $945 BUILDIUM
- 2025-09-06 Listed for Rent $945 BUILDIUM
- 2025-06-18 Price Changed $75,000 GCMLS AL
- 2025-04-28 Price Changed $89,500 GCMLS AL
- 2025-04-03 Price Changed $94,999 GCMLS AL
- 2022-11-16 Price Changed $94,000 GCMLS AL
Property tax history
+1.3%/yrLatest (2025): $432 · +6.9% YoY. Source: county tax records.
Cash-flow waterfall
monthlySold comps — $/sqft
last 12 mo · ≤1 miLoading sold comps…