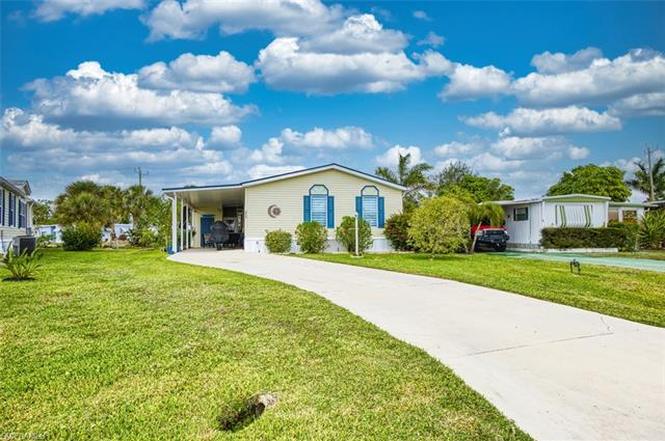
45 San Remo Cir · Naples, FL
Flood risk 8/10 · Major
- FEMA flood zone
- AE
- Chance of flooding over 30 yrs
- 0.98%
- Est. flood insurance / yr
- $1,737 – $8,500
Fire risk 3/10 · Minor
- Est. fire insurance / yr
- $947 – $1,759
Heat risk 10/10 · Severe
- Hot days now (above 107°F)
- 7 days/yr
- Hot days in 30 yrs
- 27 days/yr
Wind risk 10/10 · Severe
- Chance of severe wind over 30 yrs
- 99.0%
Air-quality risk 2/10 · Minimal
- Unhealthy air days now
- 2 days/yr
- Unhealthy air days in 30 yrs
- 2 days/yr
Risk factors via First Street. Map © Google.
Why this score? — see what drove the D+ grade
The composite is a weighted blend of 9 inputs, each scored 0–100. Each bar is that input's sub-score; the figure is the points it added to the 100-point composite (weight × sub-score).
- Cash flow +16.5/30.0
- ARV discount +7.5/15.0
- DSCR +5.1/10.0
- Schools +5.0/10.0
- 1% rule +4.2/10.0
- Livability +4.0/5.0
- Condition / age +2.5/5.0
- Rent growth +2.1/5.0
- Appreciation +0.0/10.0
$309,900
🖨 Deal sheet (PDF) 📄 Offer letter ✓ Due diligence
Listing remarks MLS
Beautiful two bedroom, two bath, plus den manufactured home. 18 inch ceramic tile floors. Large master bath, with dual sinks and spacious shower. Riviera Colony is a 55 plus community with clubhouse, heated pool, shuffleboard and more.
Key facts
- True workshop
- Huge tiled carport
- Safe area
Tags
Property features AI
Finance
- Other: Part of a complex with 100 units; single unit in building and on single floor; Possession at closing
- HOA & community: Mandatory HOA; Quarterly master HOA fee ($402); Total annual recurring HOA fees $1,608; On-site management; HOA covers cable, management, master association fee, and recreation facilities; Community amenities include BBQ/picnic area, bike and jog path, bocce court, community pool, community room, library, shuffleboard, and underground utilities; Non-gated community (Riviera Colony)
Exterior
- Parking: Paved parking with 2+ spaces; Attached carport with 3 carport spaces
- Security: Impact resistant windows; Impact resistant doors
- Utilities: Central water; Central sewer; Cable available
- Home design: Residential manufactured home; Modular, wood frame construction; Vinyl siding exterior; Metal roof; 1 story (ranch); Rear exposure faces north; Irregular-shaped lot; Landscaped view
- Construction: Built in 2006; Wood frame construction; Manufactured building design; Metal roof; Vinyl siding; Foundation information not provided
- Exterior features: Extra building on property; Fruit trees; Manual sprinkler; Storage; Screened lanai/porch; Private above-ground spa (electric heated)
Interior
- Kitchen: Kitchen island; Breakfast bar; Dishwasher; Range; Microwave; Refrigerator; Refrigerator with icemaker
- Bedrooms: 3 bedrooms; Master bedroom on ground floor; First-floor bedroom
- Flooring: Wood flooring
- Bathrooms: 2 full bathrooms; Master bath with shower only
- Heating & cooling: Central electric heat; Central electric cooling; Ceiling fans
- Interior features: Built-in cabinets; Cable prewire available; Cathedral and vaulted ceilings; Closet cabinets; Foyer; Volume ceiling; Great room floor plan; 3 ceiling fans; Furnished
- Laundry & utility: Washer and dryer included; Washer/dryer hookup; Laundry in residence; Workshop
Neighborhood map
What this means for you Summary
Snapshot
- This is a 3-bed/2.0-bath manufactured listed at $310k.
Deal economics
- At list price, monthly cash flow is $-245 ($-3k/yr) — negative.
- To cash-flow at today's rent, offer at most $267k (14.0% below list).
- To meet the 1% rule (rent ≥ 1% of price), the offer needs to be $284k (8.4% below list).
- Recommended offer: $267k (14.0% below list) — sets the bar for cash-flow.
Location & tenants
- Location reads 80/100 on livability (#126 in FL, #1,903 nationally) — a professional / high-income tenant draw. Strengths: crime A+, amenities A+, employment A+; Watch: commute D+, cost of living F.
- Collier (suburban): math 60% / reading 56% proficiency, ranked #16 of 73 in FL (top 22%) — acceptable for families but not a draw, mixed tenant base, ~2y average lease.
- Zoned schools: Lely Elementary School (math 45% / reading 46%, grade D-, #1,247 of 2,144 statewide, top 59%, 499 students, 62% FRL); East Naples Middle School (math 56% / reading 44%, grade C, #254 of 571 statewide, top 45%, 854 students, 63% FRL); Lely High School (math 40% / reading 39%, grade F, #304 of 667 statewide, top 47%, 1,504 students, 54% FRL) — zoned schools at 60% FRL track the district average.
- Zoned-school proficiency averages 45% at this address vs 58% district-wide (-13 pts) — the specific schools serving this property underperform the Collier average; the district grade overstates school quality for this exact location.
- Market conditions: Rents soft (-1.7%/yr); 777 active listings in the ZIP; 40 comparable units currently listed for rent nearby; rentals at typical pace (median 25d on market — plan ~3-4 weeks tenant-placement turnaround); 3,520 units permitted in Collier County in 2024 (959 in 5+ unit buildings).
- At $2,838/mo this rent would consume 49% of the median local household income ($70k/yr) (locally 980% of renters already pay >50% of income on rent) — very limited rent-growth headroom before tenants either downsize or default.
Forward outlook
- Local home prices are declining (-3.0%/yr); year-one equity from $2k of loan paydown is wiped out by about $9k of value loss. Plan a longer hold.
- Collier County population projected at +30% by 2050 — long-run rental-demand tailwind backs the buy-and-hold thesis.
Negotiation context
- It's been on market 154 days — a 12% lower offer ($273k) is reasonable based on typical stale-listing flexibility.
- 2 sale attempts since 17y ago with the ask held roughly flat each time — persistent listings suggest the price (not the market) is what's stuck; bring a comps-based counter.
- Current owner paid $138k; list at $310k implies a 125% gain — meaningful room to come down on a strong offer.
Risks & watch-outs
- Watch-outs: flood insurance adds $427/mo.
- Climate carrying-cost: in FEMA flood zone AE (mandatory federal flood insurance); severe wind risk, 99% chance of damaging wind over 30y; extreme-heat days projected 7→27/yr by 2055 (HVAC capex compounding) — expect insurance premiums to compound above CPI over the hold.
Questions for the listing agent
- What do current leases actually rent for vs. the listed asking? Can we see a recent rent roll and the last 12 months of T-12 income?
- It's been on market 154 days. Have you received any prior offers? Is the seller open to a 14% concession, seller financing, or rate buy-down credit?
- What's the actual annual flood-insurance premium (NFIP or private), and is the property in a SFHA with mandatory coverage?
- What does the HOA fee cover, when was the last increase, and are there any pending special assessments or reserve-fund shortfalls?
- Why hasn't it sold? Are there any deal-killer items the seller is aware of (foundation, flood, title, zoning, code violations)?
- Is there a deadline driving the sale (1031 exchange, divorce, estate, relocation)? That informs how much negotiation room exists.
- Schools are B-rated — typically a magnet for longer-tenancy family renters. What's the average tenant stay here, and is there a school-zone premium baked into asking?
- The area grade is low — what's the realistic commute time and amenity access for the typical tenant pool here? Any planned neighborhood developments (good or bad) we should know about?
- What's the average days-on-market for RENTAL listings here right now (not sales)? A rising rental-DOM trend means longer vacancies and softer asking-rent achievability than the comps imply.
- What's the recent tenant-quality profile in this submarket — average credit score on applications, eviction rate, late-payment / NSF rate, and stable-employment percentage? A property-management company in the area should have these aggregated.
- How much new for-sale + rental construction is in the pipeline within 1–3 miles? Heavy new supply typically softens prices + rents 12–24 months out; constrained supply supports both.
Investment metrics
- 1% rule
- 0.92% ✗
- Cap rate
- 7.00%
- Cash-on-cash
- 2.51%
- DSCR
- 1.11
- GRM
- 9.1
CMA / ARV
No comps found within radius.
Projected returns pro-forma
-3.0% appreciation · 0.0% rent growth · sell at horizon
- IRR
- -25.9%
- Equity multiple
- 0.15×
- Total profit
- $-73,887
- Equity at exit
- $46,207
- IRR
- -40.2%
- Equity multiple
- -0.33×
- Total profit
- $-115,545
- Equity at exit
- $26,794
Cash invested: $86,772 (down + closing). Projections, not guarantees.
Landlord ↔ Tenant lean methodology
- Overall (STATE)
- 87 Strongly Landlord-Friendly
- State Florida
- 87 Strongly Landlord-Friendly · R+3
- County
- — inherits STATE
- City
- — inherits STATE
ZIP-level market 34112
- Rents YoY
- -1.7%
- Active inventory
- 777
- Price-to-rent
- 9.1×
Monthly cashflow live
- Estimated rent
- $2,838 high interval (Pro) →
- Mortgage (P&I)
- −$1,625
- Tax from tax record
- −$172 /mo · $2,069/yr
- Insurance
- −$129
- Flood insurance flood zone
- −$427 /mo · $5,118/yr
- HOA
- −$134
- Vacancy / Maint / Mgmt
- −$596
- Net cashflow
- $-245
Break-even live
Sensitivity live
| Price | -10% $-70 | -5% $-157 | +0% $-245 | +5% $-333 | +10% $-420 |
|---|---|---|---|---|---|
| Rent | -10% $-469 | -5% $-357 | +0% $-245 | +5% $-133 | +10% $-21 |
| Rate | -1.0pp $-89 | -0.5pp $-166 | base $-245 | +0.5pp $-325 | +1.0pp $-407 |
UW: 25.0% down · 7.5% · 30yr · 1.5% tax · 5.0% vac · 8.0% maint · 8.0% mgmt
Financing live
Cash to close
- Down payment
- $77,475
- Closing costs
- $9,297
- Reserves months
- —
- Total cash needed
- —
Loan-product check · same deal, 3 products live
Conventional
25% down · 7.5% · 30yr
- Down + closing
- —
- Monthly P&I
- —
- Monthly cashflow
- —
- DSCR
- —
- Eligible?
- —
Personal DTI + credit; lowest rate.
DSCR
20% down · 8.5% · 30yr
- Down + closing
- —
- Monthly P&I
- —
- Monthly cashflow
- —
- DSCR
- —
- Eligible?
- —
No personal income docs; deal must DSCR.
Hard money
10% down · 12.0% · 12mo
- Down + closing
- —
- Monthly P&I
- —
- Monthly cashflow
- —
- DSCR
- —
- Eligible?
- —
Short-term bridge; refi at stabilization.
Rent comps 40 comps
| Address | Beds | Baths | Sqft | Rent | $/sqft | DOM | Units | Dist |
|---|---|---|---|---|---|---|---|---|
| 148 Lake Point Ln Naples, FL | 2.0 | 2.5 | 1530 | $2,100 | $1.37 | 25d | 1 | 0.25mi |
| 360 Charlemagne Blvd Unit D105 Naples, FL | 2.0 | 2.0 | 1082 | $3,200 | $2.96 | 25d | 1 | 0.29mi |
| 30 Maui Cir #30 Naples, FL | 3.0 | 2.0 | 1552 | $2,795 | $1.80 | 25d | 1 | 0.31mi |
| 4410 Chantelle Dr Unit H-205 Naples, FL | 2.0 | 2.0 | 1349 | $3,500 | $2.59 | 15d | 1 | 0.32mi |
| 332 Charlemagne Blvd Unit H103 Naples, FL | 2.0 | 2.0 | 1082 | $3,495 | $3.23 | 25d | 1 | 0.37mi |
| 332 Charlemagne Blvd Unit H101 Naples, FL | 2.0 | 2.0 | 1082 | $3,500 | $3.23 | 25d | 1 | 0.37mi |
| 4911 Catalina Dr Unit 22 Naples, FL | 3.0 | 1.5 | 1200 | $1,950 | $1.62 | 15d | 1 | 0.44mi |
| 4907 Catalina Dr Unit 45 Naples, FL | 3.0 | 2.0 | 1270 | $1,900 | $1.50 | 15d | 1 | 0.47mi |
| 5419 Rattlesnake Hammock Rd Unit 307F Naples, FL | 2.0 | 2.0 | 1071 | $1,950 | $1.82 | 15d | 1 | 0.48mi |
| 5595 Greenwood Cir #92 Naples, FL | 3.0 | 2.0 | 1450 | $5,000 | $3.45 | 25d | 1 | 0.48mi |
| 5499 Rattlesnake Hammock Rd Naples, FL | 2.0 | 2.0 | 1071 | $1,775 | $1.66 | 15d | 2 | 0.52mi |
| 200 Valley Stream Dr Unit 8B Naples, FL | 2.0 | 2.0 | 979 | $1,750 | $1.79 | 25d | 1 | 0.52mi |
| 5778 Greenwood Cir Naples, FL | 3.0 | 2.0 | 1450 | $4,000 | $2.76 | 25d | 1 | 0.55mi |
| 300 Valley Stream Dr Unit 3D Naples, FL | 2.0 | 2.0 | 979 | $1,795 | $1.83 | 22d | 1 | 0.56mi |
| 300 Valley Stream Dr Unit 3D Naples, FL | 2.0 | 2.0 | 979 | $1,795 | $1.83 | 25d | 1 | 0.56mi |
| 4261 Pearl Harbor Dr Unit 1546170P Naples, FL | 3.0 | 2.0 | 1797 | $3,387 | $1.88 | 15d | 1 | 0.58mi |
| 4830 Cortez Cir Naples, FL | 3.0 | 2.0 | 1218 | $3,100 | $2.55 | 25d | 1 | 0.58mi |
| 4977 Pepper Cir #205 Naples, FL | 2.0 | 2.0 | 1250 | $2,250 | $1.80 | 22d | 1 | 0.59mi |
| 3308 Duchess Dr Naples, FL | 3.0 | 3.0 | 1735 | $3,600 | $2.07 | 25d | 1 | 0.60mi |
| 5502 Greenwood Cir #1 Naples, FL | 3.0 | 2.0 | 1450 | $2,400 | $1.66 | 25d | 1 | 0.61mi |
| 4231 Gulfstream Dr Apt 102 Naples, FL | 3.0 | 2.0 | 1178 | $1,995 | $1.69 | 15d | 1 | 0.63mi |
| 5535 Rattlesnake Hammock Rd #302 Naples, FL | 2.0 | 2.0 | 1205 | $2,800 | $2.32 | 25d | 1 | 0.65mi |
| 5708 Deauville Cir Unit 308 Naples, FL | 3.0 | 2.0 | 1500 | $4,500 | $3.00 | 25d | 1 | 0.66mi |
| 2093 Pine Isle Ln #2093 Naples, FL | 2.0 | 2.0 | 927 | $1,695 | $1.83 | 25d | 1 | 0.67mi |
| 4290 Gulfstream Dr #5 Naples, FL | 2.0 | 2.0 | 956 | $1,600 | $1.67 | 25d | 1 | 0.67mi |
| 4300 Gulfstream Dr Unit 2D Naples, FL | 2.0 | 2.0 | 1115 | $1,295 | $1.16 | 25d | 1 | 0.67mi |
| 5792 Deauville Cir Unit A103 Naples, FL | 2.0 | 2.0 | 1209 | $3,900 | $3.23 | 25d | 1 | 0.69mi |
| 3250 W Crown Pointe Blvd #101 Naples, FL | 3.0 | 2.0 | 1653 | $7,000 | $4.23 | 25d | 1 | 0.69mi |
| 4900 Biscayne Dr #22 Naples, FL | 2.0 | 2.0 | 1108 | $1,800 | $1.62 | 22d | 1 | 0.69mi |
| 232 Pebble Beach Blvd #104 Naples, FL | 3.0 | 2.0 | 1298 | $1,975 | $1.52 | 25d | 1 | 0.70mi |
| 5635 Rattlesnake Hammock Rd Apt 203D Naples, FL | 2.0 | 2.0 | 1054 | $1,700 | $1.61 | 22d | 1 | 0.73mi |
| 240 Pebble Beach Blvd #702 Naples, FL | 2.0 | 2.0 | 1090 | $4,000 | $3.67 | 25d | 1 | 0.76mi |
| 5651 Rattlesnake Hammock Rd Unit C-108 Naples, FL | 2.0 | 2.0 | 1054 | $1,800 | $1.71 | 25d | 1 | 0.77mi |
| 3625 Boca Ciega Dr Naples, FL | 2.0 | 2.0 | 930 | $2,400 | $2.58 | 25d | 2 | 0.78mi |
| 190 Pebble Beach Blvd #301 Naples, FL | 2.0 | 2.0 | 954 | $1,700 | $1.78 | 25d | 1 | 0.78mi |
| 3195 Boca Ciega Dr Unit C10 Naples, FL | 2.0 | 2.0 | 1400 | $3,000 | $2.14 | 25d | 1 | 0.78mi |
| 213 Bay Meadows Dr Naples, FL | 3.0 | 2.0 | 1650 | $5,500 | $3.33 | 25d | 1 | 0.79mi |
| 5733 Deauville Cir Unit G308 Naples, FL | 3.0 | 2.0 | 1427 | $3,600 | $2.52 | 25d | 1 | 0.81mi |
| 5741 Deauville Cir Unit F108 Naples, FL | 3.0 | 2.0 | 1427 | $3,600 | $2.52 | 25d | 1 | 0.81mi |
| 5665 Whitaker Rd #202 Naples, FL | 2.0 | 2.0 | 1099 | $1,900 | $1.73 | 22d | 1 | 0.83mi |
HOA detail
- Monthly dues
- $134 · $1,608/yr
- Likely covers
- pool
Listing history 21 events
-
2026-06-21days on market $309,900 Active 154 DOM
-
2026-06-18days on market $309,900 Active 151 DOM
-
2026-06-17days on market $309,900 Active 150 DOM
-
2026-06-16days on market $309,900 Active 149 DOM
-
2026-06-15days on market $309,900 Active 148 DOM
-
2026-06-14days on market $309,900 Active 146 DOM
-
2026-06-10days on market $309,900 Active 143 DOM
-
2026-06-09days on market $309,900 Active 142 DOM
-
2026-06-08days on market $309,900 Active 141 DOM
-
2026-06-07days on market $309,900 Active 140 DOM
-
2026-06-03days on market $309,900 Active 136 DOM
-
2026-06-02days on market $309,900 Active 135 DOM
-
2026-06-01days on market $309,900 Active 134 DOM
-
2026-05-31days on market $309,900 Active 133 DOM
-
2026-05-30days on market $309,900 Active 132 DOM
-
2026-02-09price $309,900
-
2026-01-18$324,900 Active
-
2010-04-02soldstatus $137,500 235-char remark
Show marketing remark (235 chars)
Beautiful two bedroom, two bath, plus den manufactured home. 18 inch ceramic tile floors. Large master bath, with dual sinks and spacious shower. Riviera Colony is a 55 plus community with clubhouse, heated pool, shuffleboard and more.
-
2009-08-10$139,900 235-char remark
Show marketing remark (235 chars)
Beautiful two bedroom, two bath, plus den manufactured home. 18 inch ceramic tile floors. Large master bath, with dual sinks and spacious shower. Riviera Colony is a 55 plus community with clubhouse, heated pool, shuffleboard and more.
-
2001-12-10soldstatus $42,000
-
1996-01-22soldstatus $46,000
ⓘ Source: listings_history table (triggers on properties + properties_extension) + one-shot
backfill from property_details.listing_events for pre-trigger history.
Tax reassessment forecast FL · Resets to sale price
- Current annual tax
- $2,069 · $172/mo
- Projected year-2 tax
- $2,572 · $214/mo
- Expected delta
- +$503/yr (+$42/mo · 24.3%)
ⓘ Screening estimate from a state-policy table — verify with the county assessor before closing.
Climate risk First Street
- Flood 8/10 Severe FEMA zone AE · 98% chance over 30 yrs
- Wildfire 3/10 Moderate
- Heat 10/10 Extreme 7 d/yr ≥107°F today · 27 d/yr by 30 yrs out
- Wind 10/10 Extreme 99% chance of damaging wind over 30 yrs
- Air quality 2/10 Low 2 unhealthy d/yr today · 2 by 30 yrs out
Nearby sold comps map
Loading sold comps map…
Walkable amenities ~0.75 mi
Loading nearby amenities…
Taxation est. · year 1
- Rental income
- $34,058
- − Mortgage interest
- −$17,359
- − Property taxes
- −$2,069
- − Insurance
- −$6,668
- − Repairs & maintenance
- −$2,725
- − Management
- −$2,725
- − HOA
- −$1,608
- − Depreciation
- −$9,015
- Taxable loss
- −$8,110
- Est. tax savings @ 24.0%
- +$1,947
- After-tax cash flow
- $-994/yr
For passive investors: Depreciation is non-cash, so a rental often shows a tax loss while cash-flowing — sheltering income. Rental losses are passive: they offset passive income freely, and up to $25,000/yr can offset ordinary (W-2) income if you actively participate and your MAGI is under $100k (phasing out to $0 by $150k); unused losses carry forward. On sale, claimed depreciation is recaptured at up to 25%, and gains may owe capital-gains tax (a 1031 exchange can defer both). Figures are a year-1 estimate at your 24.0% rate — not tax advice; consult a CPA.
Schools (NCES district)
- District
- Collier
- NCES district ID
- 1200330
- Math proficiency
- 60% ▼ -4.00%
- Reading proficiency
- 56% ▼ -2.00%
- Median HH income
- $58,275
- Composite
- 50.23/100
- National rank
- #1892
- State rank
- #16 of 73 in FL
Livability — Naples
- Score
- 80/100
- State rank
- #126
- US rank
- #1903
Category grades
Schools grade is shown separately in the Schools card above.
Census & demographics
- County
- Collier County · 396,295 people
- City population
- 344,941
- Metro
- Naples-Marco Island, FL
- Population (ZIP)
- 27,193
- Household income
- $69,842
- Rent vs Own
- Severe rent burden
- 980.0
Population outlook (Collier County) Hauer SSP2
- Today (2025)
- 420,858 people
- By 2030
- 450,054 · +6.9%
- By 2040
- 502,232 · +19.3%
- By 2050
- 544,932 · +29.5%
- By 2075
- 627,203 · +49.0%
- By 2100
- 659,015 · +56.6%
Race, ethnicity, and origin ACS 2023
- Neighborhood character
- Predominantly White (74%)
- Race & ethnicity
- White 74% Hispanic / Latino 18% Two or more races 9% Black 6% Native American 2% Asian 1%
- Hispanic origin (detail)
- Mexican 7% Puerto Rican 2% Cuban 4% Dominican 1%
- Common ancestry
- Hispanic 4% Romanian 3% Portuguese 2%
- Foreign-born
- 19% · Canada, Jamaica
- Languages at home
- 75% English-only · Spanish 17% French/Haitian/Cajun 4% German/W. Germanic 1%
Political lean MEDSL · Collier
- 2024 margin
- Solid R (+33.1) · D 33.1% · R 66.2%
- 2008→2024 swing
- -10.6pp toward R · 2008: -22.5pp · 2024: -33.1pp
- All cycles
- 2024: R+33.1 2020: R+24.7 2016: R+26.0 2012: R+30.1 2008: R+22.5
Not yet ingested
- Civics
- —
Market trends
- HPI YoY
- ▼ -235.10%
- Current HPI
- 256.9182
- Rent YoY
- ▼ -1.69%
- Metro
- Naples-Marco Island, FL
- State GDP YoY
- ▲ 3.28%
- F500 in state
- 36
Industry mix (Fortune 500 HQ in FL)
| Industry | F500 HQs | Revenue |
|---|---|---|
| Industrial Technology | 2 | $29B |
|
||
| Insurance | 2 | $17B |
|
||
| Retail | 1 | $60B |
|
||
| Technology Distribution | 1 | $58B |
|
||
| Homebuilding | 1 | $35B |
|
||
| Technology Manufacturing | 1 | $35B |
|
||
Price history
+573.7% since first listed6 events — show timeline
- 2026-02-09 Price Changed $309,900 NAPLESMLS
- 2026-01-18 Listed $324,900 NAPLESMLS
- 2010-04-02 Sold (MLS) $137,500 NAPLESMLS
- 2009-08-10 Listed $139,900 NAPLESMLS
- 2001-12-10 Sold (Public Records) $42,000 Public Records
- 1996-01-22 Sold (Public Records) $46,000 Public Records
Property tax history
+7.2%/yrLatest (2025): $2,069 · +9.0% YoY. Source: county tax records.
Cash-flow waterfall
monthlySold comps — $/sqft
last 12 mo · ≤1 miLoading sold comps…