 🏗️ New Construction
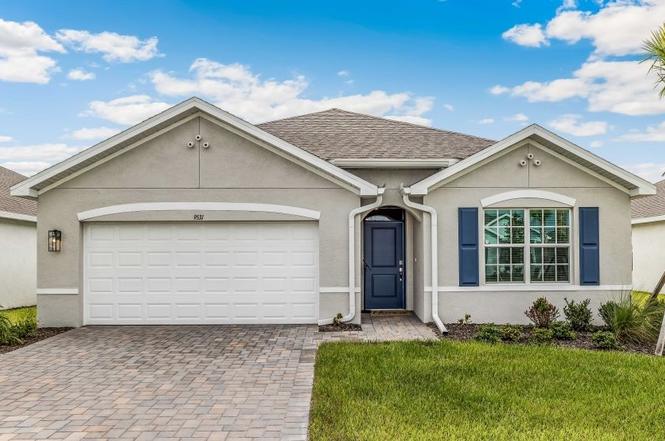
CALI Plan · Punta Gorda, FL
Flood risk No data
- FEMA flood zone
- —
- Chance of flooding over 30 yrs
- —
- Est. flood insurance / yr
- —
Fire risk No data
- Est. fire insurance / yr
- —
Heat risk No data
- Hot days now (above threshold)
- —
- Hot days in 30 yrs
- —
Wind risk No data
- Chance of severe wind over 30 yrs
- —
Air-quality risk No data
- Unhealthy air days now
- —
- Unhealthy air days in 30 yrs
- —
Risk factors via First Street. Map © Google.
Why this score? — see what drove the F grade
The composite is a weighted blend of 9 inputs, each scored 0–100. Each bar is that input's sub-score; the figure is the points it added to the 100-point composite (weight × sub-score).
- Cash flow +7.6/30.0
- ARV discount +7.5/15.0
- Schools +4.6/10.0
- Livability +3.8/5.0
- Rent growth +2.5/5.0
- Condition / age +2.5/5.0
- 1% rule +2.3/10.0
- DSCR +1.7/10.0
- Appreciation +0.0/10.0
$299,990
🖨 Deal sheet (PDF) 📄 Offer letter ✓ Due diligence
Listing remarks
The Cali floorplan at Seagrass is a 1,828 square foot home with 4 bedrooms, 2 bathrooms, and a two-car garage. As one of our most popular floorplans, this one-story home features an open-concept design to enhance the wonderful feel of this home. The well-appointed kitchen includes a large island perfect for bar-style eating or entertaining, a walk-in pantry, and plenty of cabinets and counter space to offer ample storage space. The dining room and living room both overlook the covered lanai, which is a great area for relaxing and enjoying the Florida weather. The large primary bedroom located at the back of the home for privacy, can comfortably fit a king-size bed, and includes an en suite
Key facts
- Open-concept design
- Covered lanai
- Large island
Tags
Property features AI
Finance
- Other: Virtual tour available
- Financial info: List price $299,990
Exterior
- Home design: CALI plan (new construction plan); Single-level home (plan designation)
- Construction: New construction plan (CALI)
- Exterior features: Located at 9695 Turtle Grass Cir, Punta Gorda, FL 33950
Interior
- Bedrooms: 4 bedrooms
- Bathrooms: 2 full bathrooms
- Interior features: Open living area totaling 1,828 (living area stated separately)
Neighborhood map
What this means for you Summary
Snapshot
- This is a 4-bed/2.0-bath single-family listed at $300k.
Deal economics
- At list price, monthly cash flow is $-417 ($-5k/yr) — negative.
- To cash-flow at today's rent, offer at most $292k (2.5% below list).
- To meet the 1% rule (rent ≥ 1% of price), the offer needs to be $256k (14.7% below list).
- Recommended offer: $256k (14.7% below list) — sets the bar for 1% rule.
- Cap rate 4.9% vs local median 2.8% in Punta Gorda — top-decile yield for the area; either an underpriced asset or a hidden risk that comps aren't pricing in. Stress-test before assuming the spread holds.
Location & tenants
- Location reads 76/100 on livability (#225 in FL, #3,567 nationally) — a middle-class / working-renter tenant base. Strengths: schools A+, crime A+, health & safety A+; Watch: cost of living D+, amenities D-, commute F.
- Charlotte (suburban): math 54% / reading 54% proficiency, ranked #22 of 73 in FL (top 30%) — acceptable for families but not a draw, mixed tenant base, ~2y average lease.
- Market conditions: Rents soft (-0.1%/yr); 999 active listings in the ZIP; 6 comparable units currently listed for rent nearby; rentals at typical pace (median 23d on market — plan ~3-4 weeks tenant-placement turnaround); solid renter incomes; 4,585 units permitted in Charlotte County in 2024 (703 in 5+ unit buildings).
- This rent runs 40% of the median local income ($76k/yr) — at the standard rent-burdened threshold; future hikes will face affordability resistance.
Forward outlook
- Local home prices are declining (-3.0%/yr); year-one equity from $2k of loan paydown is wiped out by about $11k of value loss. Plan a longer hold.
- Charlotte County population projected at +24% by 2050 — long-run rental-demand tailwind backs the buy-and-hold thesis.
Negotiation context
- It's been on market 243 days — a 12% lower offer ($264k) is reasonable based on typical stale-listing flexibility.
Questions for the listing agent
- What do current leases actually rent for vs. the listed asking? Can we see a recent rent roll and the last 12 months of T-12 income?
- It's been on market 243 days. Have you received any prior offers? Is the seller open to a 15% concession, seller financing, or rate buy-down credit?
- Why hasn't it sold? Are there any deal-killer items the seller is aware of (foundation, flood, title, zoning, code violations)?
- Is there a deadline driving the sale (1031 exchange, divorce, estate, relocation)? That informs how much negotiation room exists.
- Schools are A-rated — typically a magnet for longer-tenancy family renters. What's the average tenant stay here, and is there a school-zone premium baked into asking?
- The area grade is low — what's the realistic commute time and amenity access for the typical tenant pool here? Any planned neighborhood developments (good or bad) we should know about?
- What's the average days-on-market for RENTAL listings here right now (not sales)? A rising rental-DOM trend means longer vacancies and softer asking-rent achievability than the comps imply.
- What's the recent tenant-quality profile in this submarket — average credit score on applications, eviction rate, late-payment / NSF rate, and stable-employment percentage? A property-management company in the area should have these aggregated.
- How much new for-sale + rental construction is in the pipeline within 1–3 miles? Heavy new supply typically softens prices + rents 12–24 months out; constrained supply supports both.
Investment metrics
- 1% rule
- 0.73% ✗
- Cap rate
- 4.87%
- Cash-on-cash
- -5.07%
- DSCR
- 0.77
- GRM
- 11.5
CMA / ARV
- ARV (on-the-fly)
- $352,804
- Comps found
- 4
Show comp detail 4 sales within ~0.75 mi
| Address | Dist | Beds/Ba | Sqft | Sold | Price | $/sf | Match |
|---|---|---|---|---|---|---|---|
| 9531 Turtle Grass Cir | 0.02mi | 4/2.0 | 1,828 (0%) | 9mo | $299,999 | $164 | 92 |
| 9534 Turtle Grass Cir | 0.03mi | 3/2.0 (-1) | 1,672 (-8%) | 16mo | $328,999 | $197 | 66 |
| 9584 Turtle Grass Cir | 0.07mi | 3/2.0 (-1) | 1,672 (-8%) | 14mo | $322,999 | $193 | 66 |
| 2910 Acline Rd | 0.51mi | 3/2.0 (-1) | 2,022 (+11%) | 12mo | $283,000 | $140 | 44 |
Match score weights: distance 35% · size 25% · config 20% · recency 20%. Top-matched comps best support the ARV.
Projected returns pro-forma
-3.0% appreciation · 0.0% rent growth · sell at horizon
- IRR
- -28.3%
- Equity multiple
- 0.08×
- Total profit
- $-91,187
- Equity at exit
- $52,604
- IRR
- -44.4%
- Equity multiple
- -0.44×
- Total profit
- $-142,422
- Equity at exit
- $30,504
Cash invested: $98,785 (down + closing). Projections, not guarantees.
Landlord ↔ Tenant lean methodology
- Overall (STATE)
- 87 Strongly Landlord-Friendly
- State Florida
- 87 Strongly Landlord-Friendly · R+3
- County
- — inherits STATE
- City
- — inherits STATE
ZIP-level market 33950
- Home prices YoY
- -29.9%
- Rents YoY
- -0.1%
- Active inventory
- 999
- Price-to-rent
- 9.8×
Monthly cashflow live
- Estimated rent
- $2,558 high interval (Pro) →
- Mortgage (P&I)
- −$1,850
- Tax est. 1.5%
- −$441 /mo · $5,292/yr
- Insurance
- −$147
- HOA
- −$0
- Vacancy / Maint / Mgmt
- −$537
- Net cashflow
- $-417
Break-even live
Sensitivity live
| Price | -10% $-173 | -5% $-295 | +0% $-417 | +5% $-539 | +10% $-661 |
|---|---|---|---|---|---|
| Rent | -10% $-619 | -5% $-518 | +0% $-417 | +5% $-316 | +10% $-215 |
| Rate | -1.0pp $-239 | -0.5pp $-327 | base $-417 | +0.5pp $-508 | +1.0pp $-601 |
UW: 25.0% down · 7.5% · 30yr · 1.5% tax · 5.0% vac · 8.0% maint · 8.0% mgmt
Financing live
Cash to close
- Down payment
- $88,201
- Closing costs
- $10,584
- Reserves months
- —
- Total cash needed
- —
Loan-product check · same deal, 3 products live
Conventional
25% down · 7.5% · 30yr
- Down + closing
- —
- Monthly P&I
- —
- Monthly cashflow
- —
- DSCR
- —
- Eligible?
- —
Personal DTI + credit; lowest rate.
DSCR
20% down · 8.5% · 30yr
- Down + closing
- —
- Monthly P&I
- —
- Monthly cashflow
- —
- DSCR
- —
- Eligible?
- —
No personal income docs; deal must DSCR.
Hard money
10% down · 12.0% · 12mo
- Down + closing
- —
- Monthly P&I
- —
- Monthly cashflow
- —
- DSCR
- —
- Eligible?
- —
Short-term bridge; refi at stabilization.
Rent comps 6 comps
| Address | Beds | Baths | Sqft | Rent | $/sqft | DOM | Units | Dist |
|---|---|---|---|---|---|---|---|---|
| 9489 Turtle Grass Cir Punta Gorda, FL | 4.0 | 2.0 | 1828 | $2,500 | $1.37 | 15d | 1 | 0.11mi |
| 26120 Jones Loop Rd Punta Gorda, FL | 3.0 | 1.0–2.0 | 1105 | $2,275 | $2.06 | 15d | 27 | 0.45mi |
| 9975 Bishop Creek Way Punta Gorda, FL | 3.0 | 2.0 | 1899 | $2,300 | $1.21 | 22d | 1 | 0.73mi |
| 9984 Spring Gulch Ln Punta Gorda, FL | 3.0 | 2.0 | 1507 | $1,849 | $1.23 | 22d | 1 | 0.80mi |
| 9996 Spring Gulch Ln Punta Gorda, FL | 4.0 | 2.0 | 1950 | $1,895 | $0.97 | 22d | 1 | 0.84mi |
| 3500 Mondovi Ct #811 Punta Gorda, FL | 3.0 | 2.0 | 1596 | $3,200 | $2.01 | 22d | 1 | 1.25mi |
Listing history 14 events
-
2026-06-18days on market $299,990 Active 243 DOM
-
2026-06-17days on market $299,990 Active 242 DOM
-
2026-06-16days on market $299,990 Active 241 DOM
-
2026-06-15days on market $299,990 Active 240 DOM
-
2026-06-14days on market $299,990 Active 238 DOM
-
2026-06-13days on market $299,990 Active 237 DOM
-
2026-06-10days on market $299,990 Active 235 DOM
-
2026-06-09days on market $299,990 Active 234 DOM
-
2026-06-08days on market $299,990 Active 233 DOM
-
2026-06-05days on market $299,990 Active 229 DOM
-
2026-06-02days on market $299,990 Active 227 DOM
-
2026-06-01days on market $299,990 Active 226 DOM
-
2026-05-31days on market $299,990 Active 225 DOM
-
2026-05-30days on market $299,990 Active 224 DOM
ⓘ Source: listings_history table (triggers on properties + properties_extension) + one-shot
backfill from property_details.listing_events for pre-trigger history.
Nearby sold comps map
Loading sold comps map…
Walkable amenities ~0.75 mi
Loading nearby amenities…
Taxation est. · year 1
- Rental income
- $30,701
- − Mortgage interest
- −$19,763
- − Property taxes
- −$5,292
- − Insurance
- −$1,764
- − Repairs & maintenance
- −$2,456
- − Management
- −$2,456
- − Depreciation
- −$10,263
- Taxable loss
- −$11,293
- Est. tax savings @ 24.0%
- +$2,710
- After-tax cash flow
- $-2,294/yr
For passive investors: Depreciation is non-cash, so a rental often shows a tax loss while cash-flowing — sheltering income. Rental losses are passive: they offset passive income freely, and up to $25,000/yr can offset ordinary (W-2) income if you actively participate and your MAGI is under $100k (phasing out to $0 by $150k); unused losses carry forward. On sale, claimed depreciation is recaptured at up to 25%, and gains may owe capital-gains tax (a 1031 exchange can defer both). Figures are a year-1 estimate at your 24.0% rate — not tax advice; consult a CPA.
Schools (NCES district)
- District
- Charlotte
- NCES district ID
- 1200240
- Math proficiency
- 54% ▼ -6.00%
- Reading proficiency
- 54% ▼ -1.00%
- Median HH income
- $44,864
- Composite
- 45.62/100
- National rank
- #2586
- State rank
- #22 of 73 in FL
Livability — Punta Gorda
- Score
- 76/100
- State rank
- #225
- US rank
- #3567
Category grades
Schools grade is shown separately in the Schools card above.
Census & demographics
- Census place
- Punta Gorda, FL
- County
- Charlotte County · 196,994 people
- City population
- 68,831
- Metro
- Punta Gorda, FL
- Population (ZIP)
- 24,955
- Household income
- $76,369
- Rent vs Own
- Severe rent burden
- 608.0
Population outlook (Charlotte County) Hauer SSP2
- Today (2025)
- 198,646 people
- By 2030
- 210,507 · +6.0%
- By 2040
- 230,857 · +16.2%
- By 2050
- 247,148 · +24.4%
- By 2075
- 281,777 · +41.8%
- By 2100
- 293,609 · +47.8%
Race, ethnicity, and origin ACS 2023
- Neighborhood character
- Predominantly White (86%)
- Race & ethnicity
- White 86% Two or more races 5% Black 5% Hispanic / Latino 4% Asian 1%
- Common ancestry
- Lithuanian 5% Romanian 4% Italian 2%
- Foreign-born
- 7% · Canada
- Languages at home
- 95% English-only · Spanish 3% Other Indo-European 1% German/W. Germanic 1%
Political lean MEDSL · Charlotte
- 2024 margin
- Solid R (+34.0) · D 32.7% · R 66.7%
- 2008→2024 swing
- -26.7pp toward R · 2008: -7.2pp · 2024: -34.0pp
- All cycles
- 2024: R+34.0 2020: R+26.6 2016: R+27.8 2012: R+14.3 2008: R+7.2
Not yet ingested
- Civics
- —
Market trends
- HPI YoY
- ▼ -111.73%
- Current HPI
- 261.6573
- Rent YoY
- ▼ -0.06%
- Metro
- Punta Gorda, FL
- State GDP YoY
- ▲ 3.28%
- F500 in state
- 36
Industry mix (Fortune 500 HQ in FL)
| Industry | F500 HQs | Revenue |
|---|---|---|
| Industrial Technology | 2 | $29B |
|
||
| Insurance | 2 | $17B |
|
||
| Retail | 1 | $60B |
|
||
| Technology Distribution | 1 | $58B |
|
||
| Homebuilding | 1 | $35B |
|
||
| Technology Manufacturing | 1 | $35B |
|
||
Cash-flow waterfall
monthlySold comps — $/sqft
last 12 mo · ≤1 miLoading sold comps…