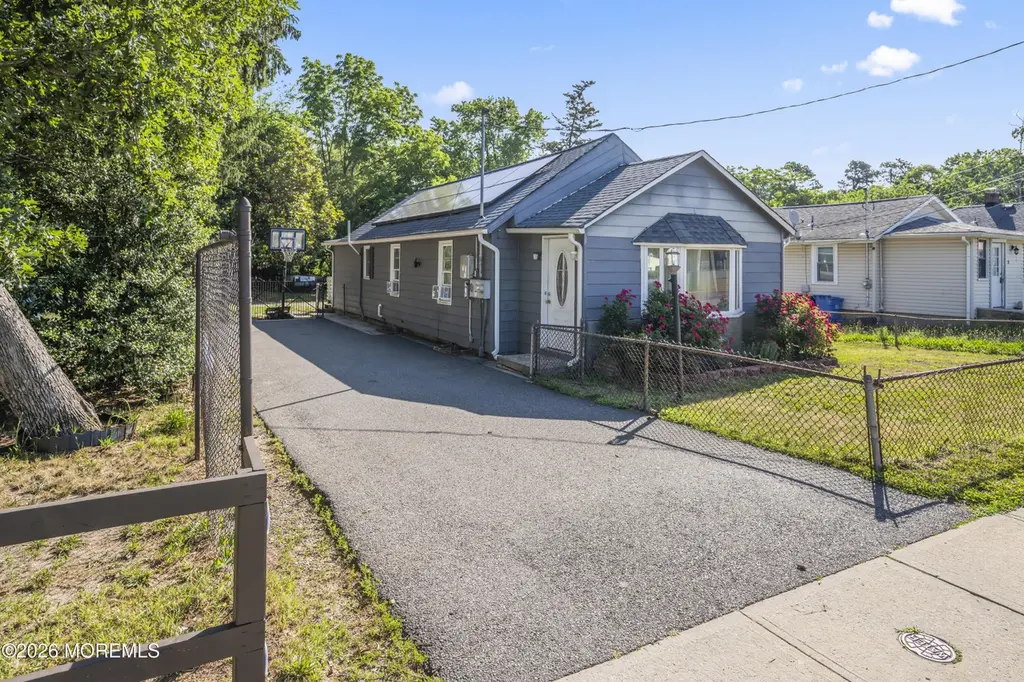
213 Manapaqua Ave · Lakehurst, NJ
Flood risk 1/10 · Minimal
- FEMA flood zone
- X (unshaded)
- Chance of flooding over 30 yrs
- 0.0%
- Est. flood insurance / yr
- $507 – $1,088
Fire risk 5/10 · Moderate
- Est. fire insurance / yr
- $526 – $976
Heat risk 6/10 · Moderate
- Hot days now (above 103°F)
- 7 days/yr
- Hot days in 30 yrs
- 15 days/yr
Wind risk 6/10 · Moderate
- Chance of severe wind over 30 yrs
- 62.0%
Air-quality risk 3/10 · Minor
- Unhealthy air days now
- 3 days/yr
- Unhealthy air days in 30 yrs
- 4 days/yr
Risk factors via First Street. Map © Google.
Why this score? — see what drove the C grade
The composite is a weighted blend of 9 inputs, each scored 0–100. Each bar is that input's sub-score; the figure is the points it added to the 100-point composite (weight × sub-score).
- Cash flow +25.1/30.0
- DSCR +8.2/10.0
- ARV discount +7.5/15.0
- 1% rule +6.6/10.0
- Livability +3.6/5.0
- Rent growth +2.5/5.0
- Condition / age +2.5/5.0
- Schools +2.2/10.0
- Appreciation +0.2/10.0
$299,999
🖨 Deal sheet 📄 Offer letter ✓ Due diligence
Listing remarks MLS
APPROXIMATELY 5 YEARS APPLIANCE, 2 SHEDS, ROOF 2 YEARS, NICE PROPERTY, HUGE KITCHEN, LOTS OF POTENTIAL. ,Oil Tank Above Ground
Key facts
- Leased solar panels
- Quaint downtown
- Fenced backyard
Tags
Property features AI
Exterior
- Parking: No garage spaces
- Utilities: Public sewer
- Home design: Fee simple ownership
- Exterior features: Shingle roof; Level topography; Basement with Bilco-style doors and other features
Interior
- Kitchen: Stove; Refrigerator
- Bedrooms: 2 bedrooms (both on first level)
- Flooring: Wood flooring
- Bathrooms: 1 full bathroom
- Heating & cooling: Oil above-ground heating with forced air; Multiple cooling units
- Interior features: AC units; Ceiling fan(s); Light fixtures; Self/cleaning oven; Enclosed room (first level); Living room (first level); Dining room (first level)
- Laundry & utility: Washer; Dryer; Laundry room (first level)
Neighborhood map
What this means for you Summary
Snapshot
- This is a 1-bed/1.0-bath single-family listed at $300k.
Deal economics
- At list price, monthly cash flow is $660 ($8k/yr) — positive.
- The deal already cash-flows at list — no discount required.
- Meets the 1% rule at list price ($3k rent vs $300k).
Location & tenants
- Location reads 71/100 on livability (#254 in NJ) — a middle-class / working-renter tenant base. Strengths: housing A+, health & safety A+; Watch: schools D, cost of living D, amenities F.
- Lakehurst School District (suburban): math 15% / reading 25% proficiency, ranked #589 of 612 in NJ (top 96%) — low school quality limits family demand, transient renter base, plan for 1-2y turnover.
- Market conditions: 9 active listings in the ZIP; 1 comparable units currently listed for rent nearby; 4,434 units permitted in Ocean County in 2024 (868 in 5+ unit buildings).
Forward outlook
- Local home prices are declining (-3.0%/yr); year-one equity from $2k of loan paydown is wiped out by about $9k of value loss. Plan a longer hold.
- Ocean County population projected to shrink 8% by 2050 — rents likely to lag national; underwrite the cash flow, not the appreciation.
Negotiation context
- Only 2 days on market — expect competitive offers; lowballing is unlikely to land.
- 2 sale attempts since 18y ago with the ask held roughly flat each time — persistent listings suggest the price (not the market) is what's stuck; bring a comps-based counter.
- Current owner paid $190k; list at $300k implies a 58% gain — meaningful room to come down on a strong offer.
Risks & watch-outs
- Watch-outs: built in 1940 — expect roof / HVAC / electrical / plumbing capex.
- Climate carrying-cost: major wind risk, 62% chance of damaging wind over 30y; moderate wildfire risk; extreme-heat days projected 7→15/yr by 2055 (HVAC capex compounding) — expect insurance premiums to compound above CPI over the hold.
Questions for the listing agent
- Built in 1940 — when were the roof, HVAC, electrical panel, plumbing, and water heater last replaced?
- Is there a deadline driving the sale (1031 exchange, divorce, estate, relocation)? That informs how much negotiation room exists.
- Schools are D-rated, which usually means shorter tenancies and higher turnover. Who's the typical renter profile here, and what's been the actual vacancy rate?
- What's the average days-on-market for RENTAL listings here right now (not sales)? A rising rental-DOM trend means longer vacancies and softer asking-rent achievability than the comps imply.
- What's the recent tenant-quality profile in this submarket — average credit score on applications, eviction rate, late-payment / NSF rate, and stable-employment percentage? A property-management company in the area should have these aggregated.
- How much new for-sale + rental construction is in the pipeline within 1–3 miles? Heavy new supply typically softens prices + rents 12–24 months out; constrained supply supports both.
Investment metrics
- 1% rule
- 1.16% ✓
- Cap rate
- 8.93%
- Cash-on-cash
- 9.43%
- DSCR
- 1.42
- GRM
- 7.2
CMA / ARV
No comps found within radius.
Projected returns pro-forma
-3.0% appreciation · 3.0% rent growth · sell at horizon
- IRR
- -2.1%
- Equity multiple
- 0.92×
- Total profit
- $-6,522
- Equity at exit
- $44,731
- IRR
- 7.7%
- Equity multiple
- 1.58×
- Total profit
- $48,676
- Equity at exit
- $25,938
Cash invested: $84,000 (down + closing). Projections, not guarantees.
Landlord ↔ Tenant lean methodology
- Overall (STATE)
- 21 Tenant-Leaning
- State New Jersey
- 21 Tenant-Leaning · D+6
- County
- — inherits STATE
- City
- — inherits STATE
ZIP-level market 08733
- Home prices YoY
- -2.5%
- Active inventory
- 9
- Price-to-rent
- 7.2×
Monthly cashflow live
- Estimated rent
- $3,468 medium interval (Pro) →
- Mortgage (P&I)
- −$1,573
- Tax from tax record
- −$381 /mo · $4,573/yr
- Insurance
- −$125
- HOA
- −$0
- Vacancy / Maint / Mgmt
- −$728
- Net cashflow
- $660
Break-even live
UW: 25.0% down · 7.5% · 30yr · 1.5% tax · 5.0% vac · 8.0% maint · 8.0% mgmt
Financing live
Cash to close
- Down payment
- $75,000
- Closing costs
- $9,000
- Reserves months
- —
- Total cash needed
- —
Loan-product check · same deal, 3 products live
Conventional
25% down · 7.5% · 30yr
- Down + closing
- —
- Monthly P&I
- —
- Monthly cashflow
- —
- DSCR
- —
- Eligible?
- —
Personal DTI + credit; lowest rate.
DSCR
20% down · 8.5% · 30yr
- Down + closing
- —
- Monthly P&I
- —
- Monthly cashflow
- —
- DSCR
- —
- Eligible?
- —
No personal income docs; deal must DSCR.
Hard money
10% down · 12.0% · 12mo
- Down + closing
- —
- Monthly P&I
- —
- Monthly cashflow
- —
- DSCR
- —
- Eligible?
- —
Short-term bridge; refi at stabilization.
Rent comps 1 comps
| Address | Beds | Baths | Sqft | Rent | $/sqft | DOM | Units | Dist |
|---|---|---|---|---|---|---|---|---|
| 2501 Route 37 Manchester, NJ | 2.0 | 2.0–2.5 | 1252 | $3,468 | $2.77 | 1d | 6 | 1.36mi |
Listing history 3 events
-
2026-06-18days on market $299,999 Active 2 DOM
-
2026-06-17remarks 542-char remark
-
2026-06-17$299,999 Active 1 DOM
ⓘ Source: listings_history table (triggers on properties + properties_extension) + one-shot
backfill from property_details.listing_events for pre-trigger history.
Tax reassessment forecast NJ · Partial reset (capped growth)
- Current annual tax
- $4,573 · $381/mo
- Projected year-2 tax
- $6,022 · $502/mo
- Expected delta
- +$1,448/yr (+$121/mo · 31.7%)
ⓘ Screening estimate from a state-policy table — verify with the county assessor before closing.
Climate risk First Street
- Flood 1/10 Low FEMA zone X (unshaded) · 0% chance over 30 yrs
- Wildfire 5/10 Major
- Heat 6/10 Major 7 d/yr ≥103°F today · 15 d/yr by 30 yrs out
- Wind 6/10 Major 62% chance of damaging wind over 30 yrs
- Air quality 3/10 Moderate 3 unhealthy d/yr today · 4 by 30 yrs out
Nearby sold comps map
Loading sold comps map…
Walkable amenities ~0.75 mi
Loading nearby amenities…
Taxation est. · year 1
- Rental income
- $41,610
- − Mortgage interest
- −$16,805
- − Property taxes
- −$4,573
- − Insurance
- −$1,500
- − Repairs & maintenance
- −$3,329
- − Management
- −$3,329
- − Depreciation
- −$8,727
- Taxable income
- $3,347
- Est. tax owed @ 24.0%
- −$803
- After-tax cash flow
- $7,117/yr
For passive investors: Depreciation is non-cash, so a rental often shows a tax loss while cash-flowing — sheltering income. Rental losses are passive: they offset passive income freely, and up to $25,000/yr can offset ordinary (W-2) income if you actively participate and your MAGI is under $100k (phasing out to $0 by $150k); unused losses carry forward. On sale, claimed depreciation is recaptured at up to 25%, and gains may owe capital-gains tax (a 1031 exchange can defer both). Figures are a year-1 estimate at your 24.0% rate — not tax advice; consult a CPA.
Schools (NCES district)
- District
- Lakehurst School District
- NCES district ID
- 3408160
- Math proficiency
- 15% ▬ 0.00%
- Reading proficiency
- 25% ▬ 0.00%
- Median HH income
- $60,420
- Composite
- 22.13/100
- National rank
- #13525
- State rank
- #589 of 612 in NJ
Livability — Lakehurst
- Score
- 71/100
- State rank
- #254
- US rank
- #7255
Category grades
Schools grade is shown separately in the Schools card above.
Census & demographics
- Census place
- Lakehurst, NJ
- Population (ZIP)
- 2,864
Population outlook (Ocean County) Hauer SSP2
- Today (2025)
- 586,991 people
- By 2030
- 581,403 · -1.0%
- By 2040
- 564,913 · -3.8%
- By 2050
- 538,149 · -8.3%
- By 2075
- 468,845 · -20.1%
- By 2100
- 350,297 · -40.3%
Race, ethnicity, and origin ACS 2023
- Neighborhood character
- Predominantly White (65%)
- Race & ethnicity
- White 65% Hispanic / Latino 16% Two or more races 14% Black 9% Asian 5% Native American 1%
- Hispanic origin (detail)
- Mexican 3% Puerto Rican 8%
- Common ancestry
- Romanian 9% Slovak 4% Iranian 2%
- Foreign-born
- 8% · Canada, Jamaica
- Languages at home
- 87% English-only · Tagalog/Filipino 6% Spanish 6% German/W. Germanic 1%
Political lean MEDSL · Ocean
- 2024 margin
- Solid R (+36.0) · D 31.4% · R 67.4% · Other 1.2%
- 2008→2024 swing
- -17.6pp toward R · 2008: -18.4pp · 2024: -36.0pp
- All cycles
- 2024: R+36.0 2020: R+28.7 2016: R+34.0 2012: R+17.7 2008: R+18.4
Not yet ingested
- Civics
- —
Market trends
- HPI YoY
- ▼ -9.53%
- Current HPI
- 363.7763
- Rent YoY
- —
- Metro
- —
- State GDP YoY
- ▲ 2.05%
- F500 in state
- 34
Industry mix (Fortune 500 HQ in NJ)
| Industry | F500 HQs | Revenue |
|---|---|---|
| Consumer Goods | 3 | $31B |
|
||
| Pharmaceuticals | 2 | $153B |
|
||
| Technology | 2 | $21B |
|
||
| Insurance | 2 | $20B |
|
||
| Healthcare | 2 | $19B |
|
||
| Financial Services | 1 | $70B |
|
||
Price history
+50.1% since first listed4 events — show timeline
- 2026-06-16 Listed $299,999 MOMLS
- 2008-12-19 Sold (Public Records) $190,000 Public Records
- 2008-12-16 Sold (MLS) $190,000 BRIGHT MLS
- 2008-06-02 Listed $199,900 BRIGHT MLS
Property tax history
+3.3%/yrLatest (2025): $4,573 · +4.7% YoY. Source: county tax records.
Cash-flow waterfall
monthlySold comps — $/sqft
last 12 mo · ≤1 miLoading sold comps…